
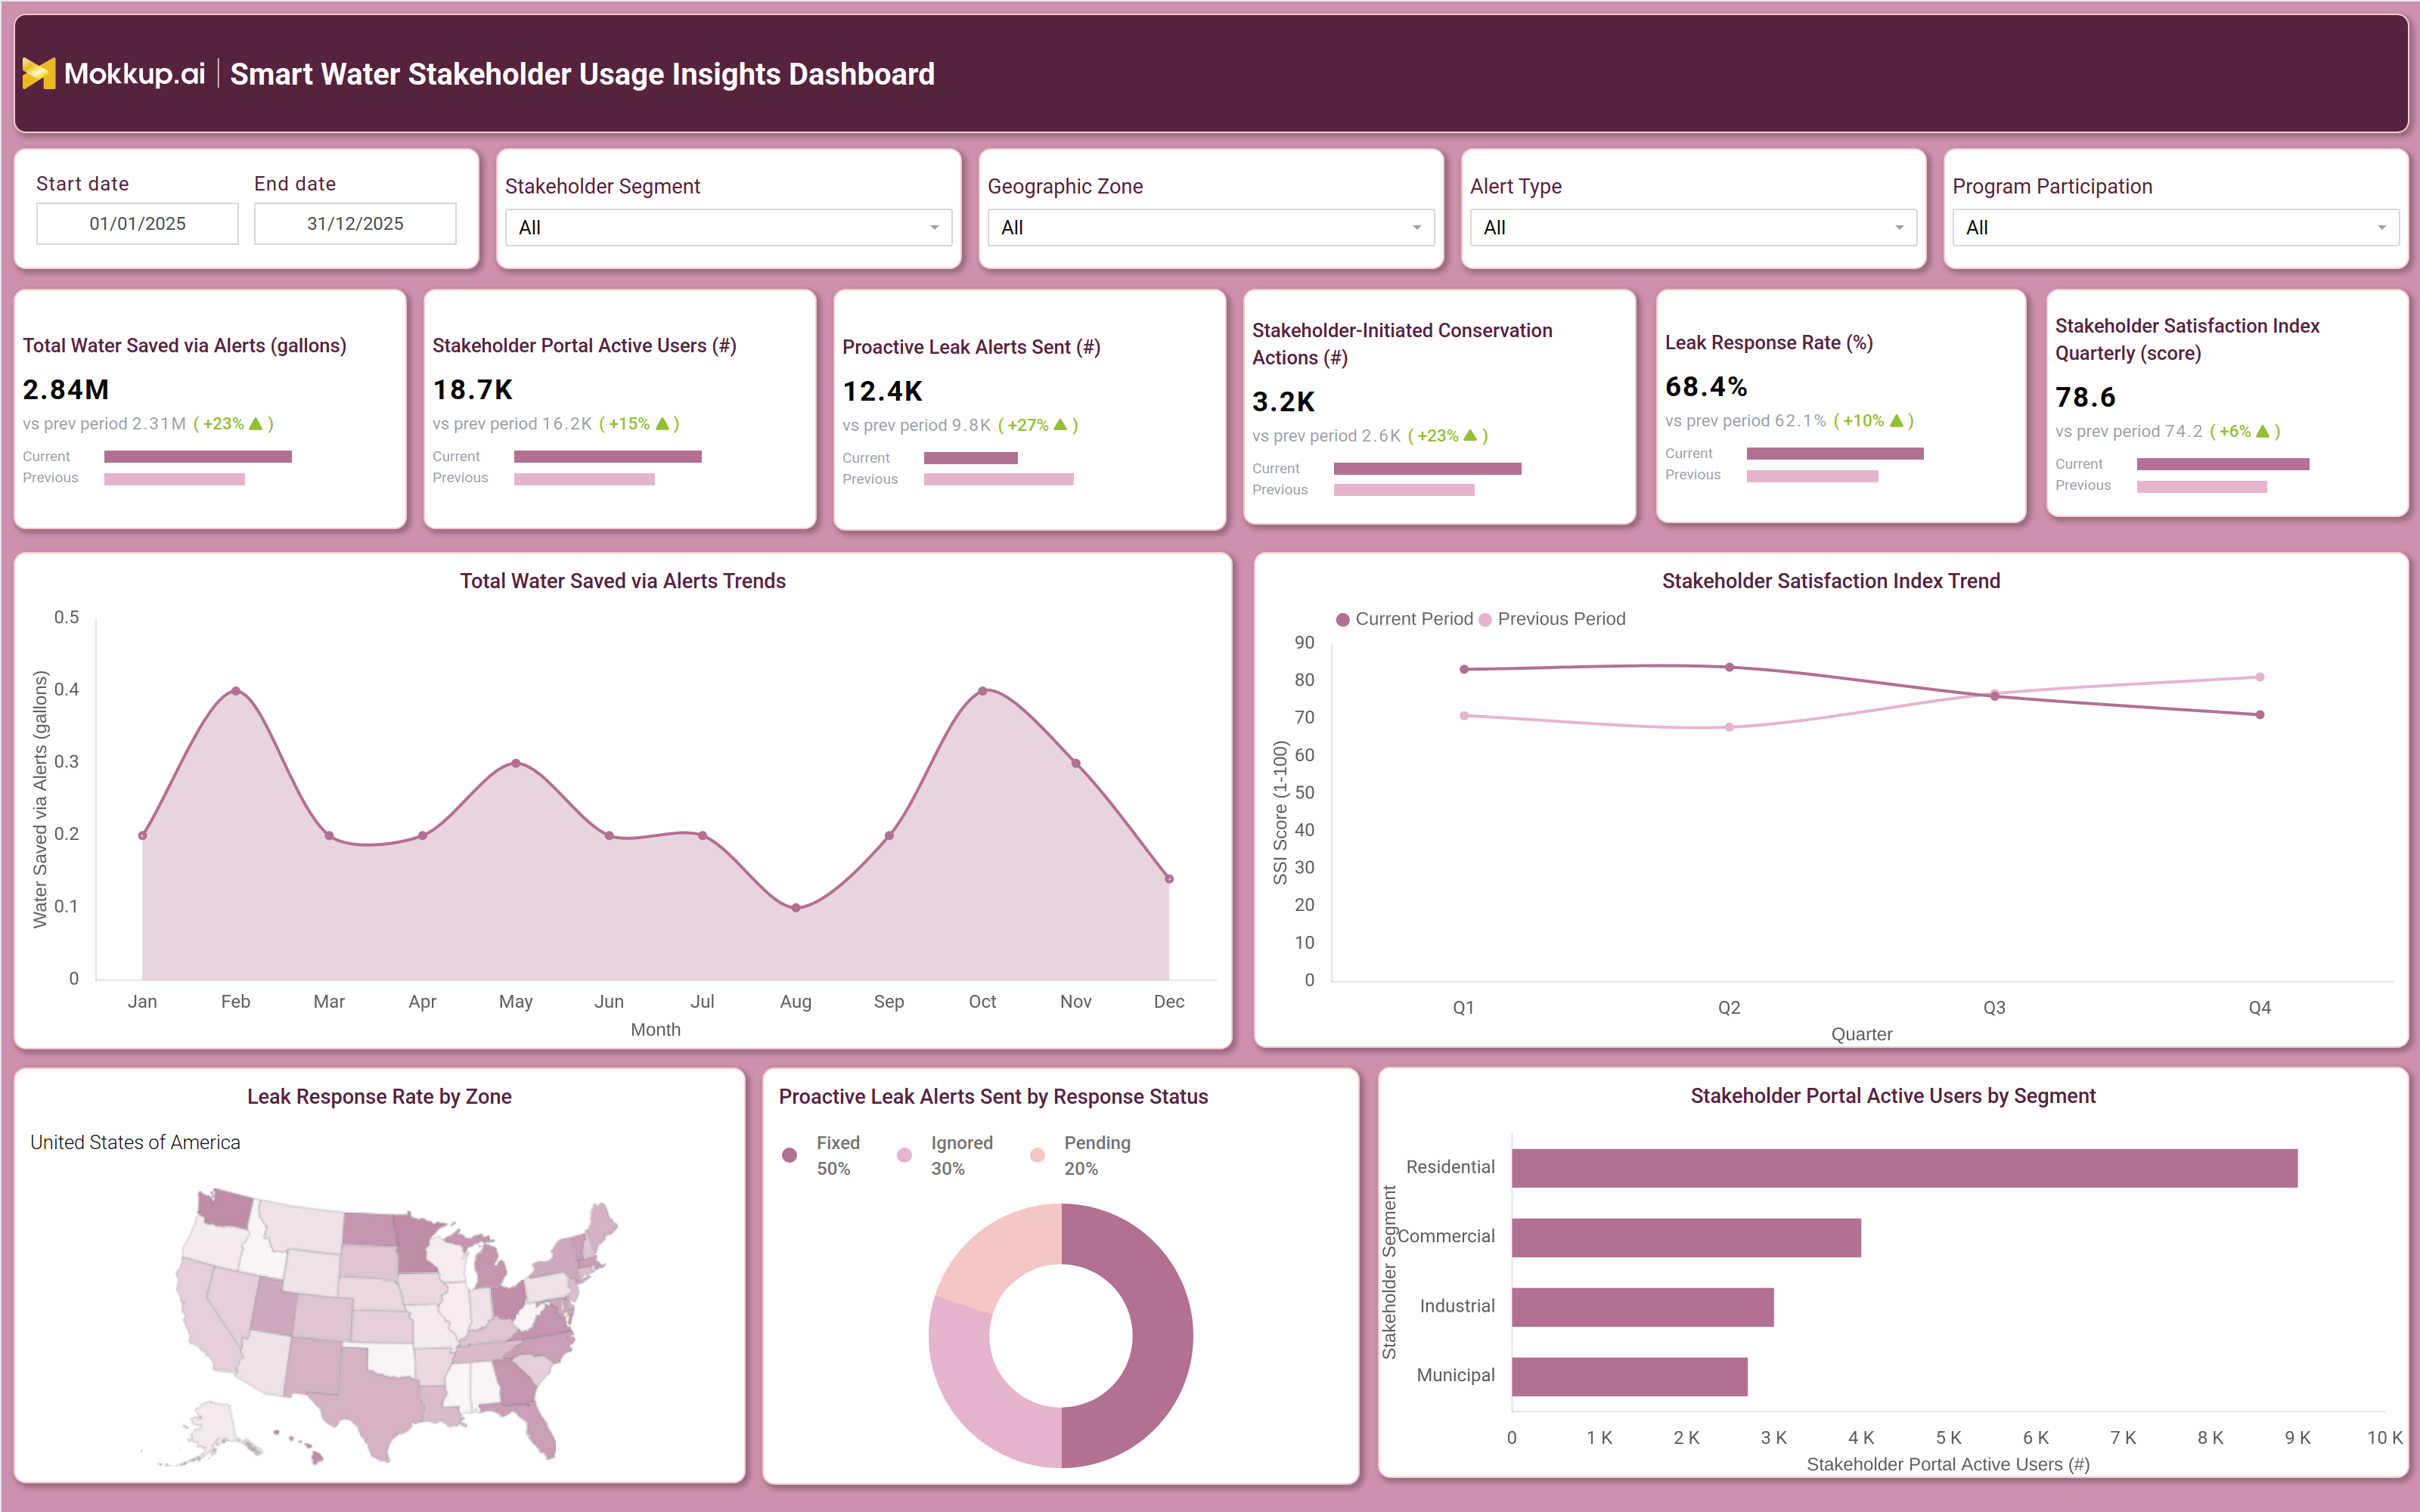
What is a Smart Water Stakeholder Usage Insights Dashboard?
The Smart Water Stakeholder Usage Insights Dashboard is a reporting template built for water utilities that need a clear view of how customers, municipalities, and commercial accounts respond to conservation programs and leak alerts. As a water utility stakeholder engagement dashboard, it consolidates portal activity, alert response outcomes, and conservation participation into a single view so utility teams no longer have to combine data from separate systems. The layout is organized around filters for date range, stakeholder segment, geographic zone, alert type, and program participation, letting analysts narrow the view to a specific customer group or region before reviewing trends. Utilities running leak notification programs, water-saving incentives, or stakeholder portals can use this template to monitor how outreach efforts are translating into measurable water savings and behavior change.
How to Create a Smart Water Stakeholder Usage Insights Dashboard
You don't need to build your report from scratch, just start with a ready-to-use dashboard template from Mokkup. Add in your data and export it however you like. Here's how to do it:
1. Create or Log in to Your Mokkup Account
Start by signing up on Mokkup.ai using your email. If you already have an account, just log in, and you'll be good to go.
2. Choose and Customize Your Dashboard Template
Find the Smart Water Stakeholder Usage Insights Dashboard template in the Templates section. Use the drag-and-drop editor to adjust KPIs, edit filters, or add elements based on your data.
3. Export to Your BI Tool
Once your dashboard wireframe is ready, use the BI Tool Export feature to send it directly to Power BI or Tableau for further analysis and enhancements. You can also download the dashboard as a PDF, PNG, or JPEG, embed it on a platform, or invite your team to collaborate.
Note: This is a Pro template. You'll need a Pro subscription on Mokkup to use and customize this dashboard wireframe. Upgrade anytime to unlock full access.
Smart Water Stakeholder Usage Insights Dashboard Example
A utility engagement manager typically opens this dashboard at the start of a reporting cycle to understand whether stakeholder outreach is producing results. Coming in with a general question about whether customers are responding to leak alerts and whether portal engagement is growing, the manager starts at the top KPI row before moving into the trend and segment views for more context. From there, the manager can identify whether proactive leak alerts are being resolved quickly or piling up as ignored and pending cases, which shapes decisions about escalation and follow-up communication. By comparing the stakeholder satisfaction trend against portal activity, teams can determine whether rising engagement is matched by rising sentiment. Reviewing leak response rate by zone, planners can compare geographic areas and prioritize outreach or staffing where response is lagging behind other regions. Segment-level views of portal activity across residential, commercial, industrial, and municipal accounts help teams decide which stakeholder group needs more education, incentives, or account management attention, tying leak alert response tracking together with water conservation program tracking so both sides of the engagement picture are visible at once. Altogether, the dashboard helps utility teams move from raw stakeholder activity data to a clear point of view on program performance, root-causing engagement gaps before they turn into service complaints. Using stakeholder portal usage analytics alongside conservation and leak response metrics, teams can prioritize which segments and zones deserve the next round of attention and demonstrate the impact of outreach programs to leadership.
How to Analyze Data in a Smart Water Stakeholder Usage Insights Dashboard
Here is how you can analyze data from this dashboard:
- Analyze stakeholder segments: Filter by stakeholder segment to isolate residential, commercial, industrial, or municipal engagement patterns.
- Compare performance over time: Adjust the date range to evaluate current and previous period performance across all KPI tiles.
- Focus on specific regions: Use the geographic zone filter to narrow the map view to a particular state or region.
- Track conservation trends: Review the Total Water Saved via Alerts Trends chart to identify seasonal peaks in water savings.
- Measure engagement changes: Compare the Stakeholder Satisfaction Index Trend with portal activity to detect shifts in engagement.
- Evaluate leak alert outcomes: Segment leak alerts by response status to distinguish fixed, pending, and ignored cases.
- Identify active user groups: Compare stakeholder portal usage by segment to determine which groups drive overall adoption.
- Assess program effectiveness: Apply the program participation filter to compare outcomes for enrolled and non-enrolled stakeholders.
Benefits of a Smart Water Stakeholder Usage Insights Dashboard
The following are the benefits of using this dashboard:
- Centralize stakeholder insights: Bring stakeholder engagement, leak alerts, and conservation data into a single water utility KPI dashboard.
- Reduce manual reporting: Replace spreadsheet-based tracking with an interactive visual dashboard.
- Improve leak response monitoring: Track leak alert status and zone-level performance to identify response gaps.
- Identify performance issues faster: Pinpoint underperforming stakeholder segments and geographic regions with ease.
- Support data-driven planning: Use engagement trends to justify budget allocation and staffing decisions.
- Compare results over time: Analyze current and previous period performance for every key metric.
- Share insights with leadership: Provide stakeholder portal usage analytics without exposing raw source data.
- Strengthen conservation programs: Connect leak alerts with stakeholder actions to measure program effectiveness.
KPIs to Track in a Smart Water Stakeholder Usage Insights Dashboard
The following key KPIs can be tracked by using this dashboard:
- Total Water Saved via Alerts (gallons): Measures cumulative water conserved as a direct result of proactive leak alerts sent to stakeholders.
- Stakeholder Portal Active Users (count): Tracks how many stakeholders are actively using the engagement portal.
- Proactive Leak Alerts Sent (count): Counts the volume of leak notifications issued to stakeholders during the selected period.
- Stakeholder-Initiated Conservation Actions (count): Measures how many conservation actions stakeholders took on their own after receiving alerts or program communication.
- Leak Response Rate (%): Shows the share of leak alerts that received a stakeholder response or resolution action.
- Stakeholder Satisfaction Index Quarterly (score): Reflects overall stakeholder sentiment toward the utility's engagement and alert programs each quarter.
Frequently Asked Questions
1. What is the Smart Water Stakeholder Usage Insights Dashboard used for?
It helps water utilities track how stakeholders engage with leak alerts, conservation programs, and the stakeholder portal. Teams use it to monitor response rates, satisfaction, and portal activity across segments and zones.
2. Can I customize this dashboard template for my utility?
Yes. This water utility KPI dashboard template can be customized in Mokkup's drag-and-drop editor to match your own KPIs, filters, and branding before exporting to Power BI, Tableau, or other formats.
3. Which stakeholder segments does this water utility stakeholder engagement dashboard track?
It tracks residential, commercial, industrial, and municipal stakeholder segments, along with geographic zone and program participation filters for deeper analysis.