
What is an Irrigation Water Conservation & Sustainability Dashboard?
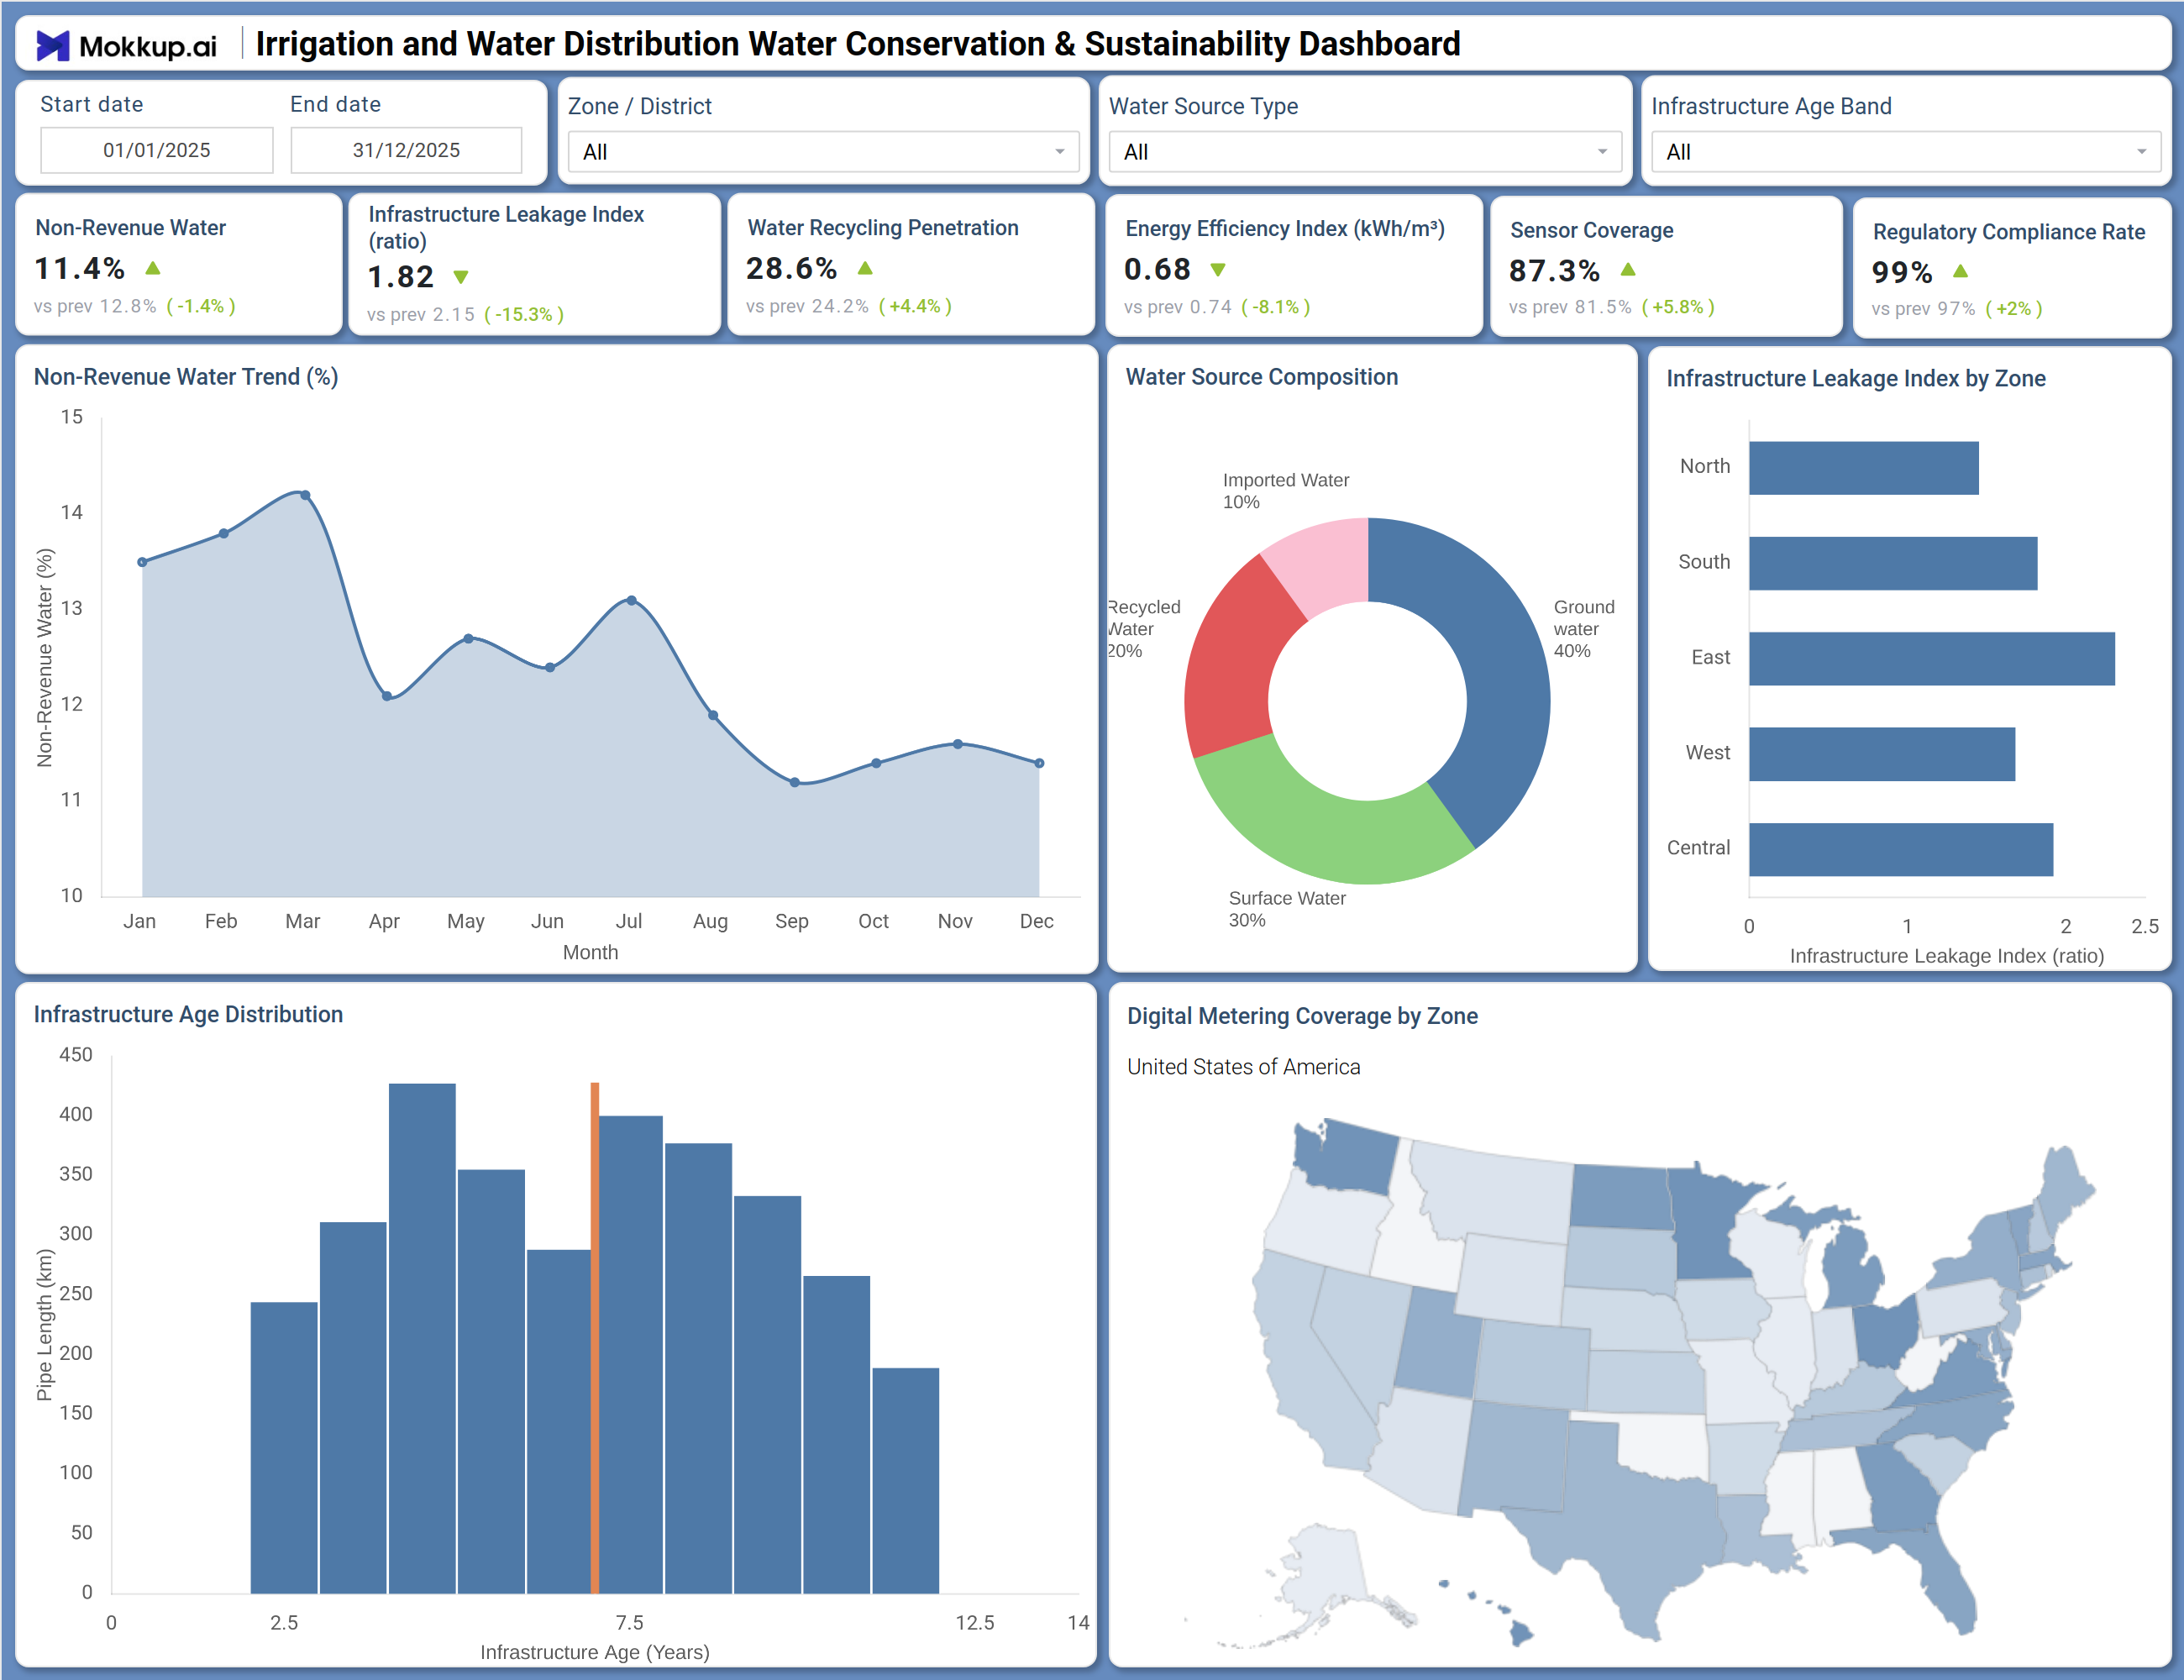
The irrigation water conservation sustainability dashboard is a purpose-built analytics tool designed for water utility managers, irrigation planners, and municipal water departments responsible for large-scale distribution networks. It consolidates critical performance metrics — including non-revenue water percentages, infrastructure leakage ratios, recycling penetration, energy efficiency, and regulatory compliance, into a single operational view that supports both day-to-day oversight and long-term sustainability planning. Teams rely on it to benchmark network health, monitor resource utilization patterns, and meet compliance mandates across multiple service zones. By surfacing geographic insight through digital metering coverage zone monitoring, it enables decision-makers to act on inefficiencies before they escalate into costly infrastructure failures.
How to Create an Irrigation Water Conservation & Sustainability Dashboard
You don't need to build your report from scratch—just start with a ready-to-use dashboard template from Mokkup. Add in your data and export it however you like. Here's how to do it:
1. Create or Log in to Your Mokkup Account
Start by signing up on Mokkup.ai using your email. If you already have an account, just log in, and you'll be good to go.
2. Choose and Customize Your Dashboard Template
Find the Irrigation Water Conservation & Sustainability Dashboard template in the Templates section. Use the drag-and-drop editor to adjust KPIs, edit filters, or add elements based on your data.
3. Export to Your BI Tool
Once your dashboard wireframe is ready, use the BI Tool Export feature to send it directly to Power BI or Tableau for further analysis and enhancements. You can also download the dashboard as a PDF, PNG, or JPEG, embed it on a platform, or invite your team to collaborate.
Note: This is a Pro template. You'll need a Pro subscription on Mokkup to use and customize this dashboard wireframe. Upgrade anytime to unlock full access.
Irrigation Water Conservation & Sustainability Dashboard Example
When a water utility manager opens this dashboard at the start of a planning cycle, the first task is typically understanding where water losses are occurring and whether they have improved or worsened over the review period. The top row of KPI tiles immediately signals the current health of the network — whether non-revenue water loss monitoring efforts are producing measurable gains and whether the leakage index is trending in the right direction. Managers can then examine the time-series trend chart to see if losses spike during specific months, which may point to seasonal demand surges, aging pipe failures, or unaddressed maintenance gaps. This early read shapes the priority of any field interventions or capital planning discussions before resources are committed. Moving into the composition and zone views, teams can assess how their water source mix is balanced across groundwater, surface water, recycled water, and imported sources, and whether that balance is shifting in ways that support water recycling penetration tracking goals over time.
The zone-level leakage index chart makes it straightforward to pinpoint which districts carry the highest infrastructure risk, enabling planners to allocate inspection and repair budgets where they will have the greatest impact rather than distributing resources evenly across low-risk areas. For infrastructure teams, the age distribution chart provides a clear picture of which pipe cohorts are approaching or exceeding typical service lifespans, turning abstract asset data into actionable replacement candidates. These cohorts can be cross-referenced against the leakage index by zone to identify where age and performance risk overlap. Meanwhile, the digital metering coverage map gives network managers a geographic picture of where sensor deployment remains incomplete, helping them focus rollout efforts on areas that currently fall outside active monitoring coverage.
How to Analyze Data in an Irrigation Water Conservation & Sustainability Dashboard
Here is how you can analyze data from this dashboard:
- Use the Zone / District filter to isolate leakage, recycling penetration, and efficiency performance for specific service areas.
- Use the Water Source Type filter to assess how reliance on groundwater, surface water, or recycled sources is distributed across the network.
- Use the Infrastructure Age Band filter to focus analysis on older pipe cohorts most likely to show elevated leakage ratios.
- Review the Non-Revenue Water Trend chart to identify months where water loss peaks and correlate those spikes with seasonal demand or maintenance events.
- Monitor the Infrastructure Leakage Index by Zone bar chart to detect which districts carry the highest leakage risk before losses worsen.
- Analyze the Water Source Composition donut chart to evaluate the balance between groundwater, surface water, recycled water, and imported water and guide water recycling penetration tracking decisions.
- Examine the Infrastructure Age Distribution chart to identify pipe age cohorts that exceed recommended service life thresholds and prioritize them for capital replacement programs.
- Review the Digital Metering Coverage by Zone map to find geographic gaps in sensor deployment and guide targeted rollout to unmonitored regions.
Benefits of a Irrigation Water Conservation & Sustainability Dashboard
The following are the benefits of using this dashboard:
- Centralizes non-revenue water, leakage index, recycling penetration, energy efficiency, and compliance metrics across the entire distribution network in one structured template.
- Supports non-revenue water loss monitoring across multiple zones simultaneously, reducing the time needed to identify where losses are highest and most persistent.
- Reduces manual data compilation for sustainability and regulatory reporting with pre-built KPI tiles and chart layouts ready for immediate use.
- Enables zone-level infrastructure leakage index analysis to guide capital investment decisions and prioritize pipe replacement programs where risk is greatest.
- Provides a time-series breakdown of non-revenue water trends for operational efficiency planning and monthly performance reviews across service periods.
- Helps water utility managers align with regulatory compliance requirements without rebuilding performance reports from scratch each reporting cycle.
- Gives field operations teams and senior leadership a shared view of network health, leakage risk, and sustainability progress to align priorities and actions.
KPIs to Track in an Irrigation Water Conservation & Sustainability Dashboard
The following key KPIs can be tracked by using this dashboard:
- Non-Revenue Water (%): This irrigation water conservation sustainability dashboard tracks the share of distributed water that generates no revenue, a core indicator of physical and commercial losses that directly impacts operational costs and conservation targets.
- Infrastructure Leakage Index (ratio): Tracks the ratio of actual leakage to the theoretical minimum leakage for the network, higher values signal deteriorating infrastructure and are a primary input to prioritizing repair and rehabilitation spending.
- Water Recycling Penetration (%): Quantifies the proportion of recycled water in the overall supply mix, directly supporting water recycling penetration tracking goals and providing a measurable indicator of progress toward circular water use.
- Energy Efficiency Index (kWh/m³): Measures the energy consumed per cubic meter of water delivered — the energy efficiency index water distribution benchmark that reveals pumping efficiency and helps identify where operational costs can be reduced.
- Sensor Coverage (%): Evaluates the proportion of the network monitored by active sensors against total infrastructure — a critical metric for assessing digital metering coverage zone monitoring completeness and identifying blind spots in network visibility.
- Regulatory Compliance Rate (%): Tracks adherence to water quality and distribution standards across all monitored zones, supporting audit readiness and alignment with sustainability reporting frameworks.
Frequently Asked Questions
1. What teams use an Irrigation Water Conservation & Sustainability Dashboard?
Water utility operations teams, municipal infrastructure planners, sustainability and ESG reporting teams, and irrigation network managers all rely on this dashboard to track network performance, monitor losses, and demonstrate compliance with regulatory requirements.
2. How does this dashboard improve non-revenue water management?
The Non-Revenue Water Trend chart and the Infrastructure Leakage Index by Zone chart work together to show both the overall trajectory of water losses and which districts contribute most — enabling targeted interventions rather than broad, costly remediation efforts across the entire network.
3. Can this dashboard track infrastructure aging and pipe replacement needs?
Yes. The Infrastructure Age Distribution chart plots pipe length by age cohort, allowing planners to identify which segments of the network are approaching or exceeding typical service lifespans and should be prioritized for capital replacement or rehabilitation programs.
4. How does the Infrastructure Leakage Index by Zone chart work?
The chart displays a horizontal bar for each zone — North, South, East, West, and Central — showing the leakage index ratio for that area. A longer bar indicates greater leakage relative to the theoretical minimum, helping managers rank zones by infrastructure risk and allocate repair resources where they will have the most impact.
5. What does the Energy Efficiency Index measure?
The Energy Efficiency Index measures energy consumption in kilowatt-hours per cubic meter of water delivered. As the primary energy efficiency index water distribution benchmark in this dashboard, it reflects how efficiently pumping and treatment infrastructure converts energy into delivered output — lower values indicate better performance and reduced operating costs.