
What is a Smart Water Security Monitoring Dashboard?
The Smart Water Security Monitoring Dashboard is a cybersecurity analytics solution designed for IT/OT security teams, compliance managers, and operations leadership responsible for protecting water treatment and distribution infrastructure. It brings together critical security metrics, including intrusion attempt trends, mean time to detect, vulnerability patch rates, privileged access compliance, dormant account counts, and open firewall rule violations tracking into a single view tailored for water utility environments. By consolidating threat detection, identity hygiene, and network compliance indicators, it enables security teams to maintain a continuous smart water security monitoring posture across multiple facilities and network segments. Water utilities, municipal treatment plants, and distribution network operators rely on this dashboard to stay ahead of evolving cyber threats and demonstrate adherence to applicable security compliance frameworks.
How to Create a Smart Water Security Monitoring Dashboard
You don’t need to build your report from scratch; just start with a ready-to-use dashboard template from Mokkup. Add in your data and export it however you like. Here’s how to do it:
1. Create or Log in to Your Mokkup Account
Start by signing up on Mokkup.ai using your email. If you already have an account, just log in, and you'll be good to go.
2. Choose and Customize Your Dashboard Template
Find the Smart Water Security Monitoring Dashboard template in the Templates section. Use the drag and drop editor to adjust KPIs, edit filters, or add elements based on your data.
3. Export to Your BI Tool
Once your dashboard wireframe is ready, use the BI Tool Export feature to send it directly to Power BI or Tableau for further analysis and enhancements. You can also download the dashboard as a PDF, PNG, or JPEG, embed it on a platform, or invite your team to collaborate.
Note: This is a Pro template. You'll need a Pro subscription on Mokkup to use and customize this dashboard wireframe. Upgrade anytime to unlock full access.
Smart Water Security Monitoring Dashboard Example
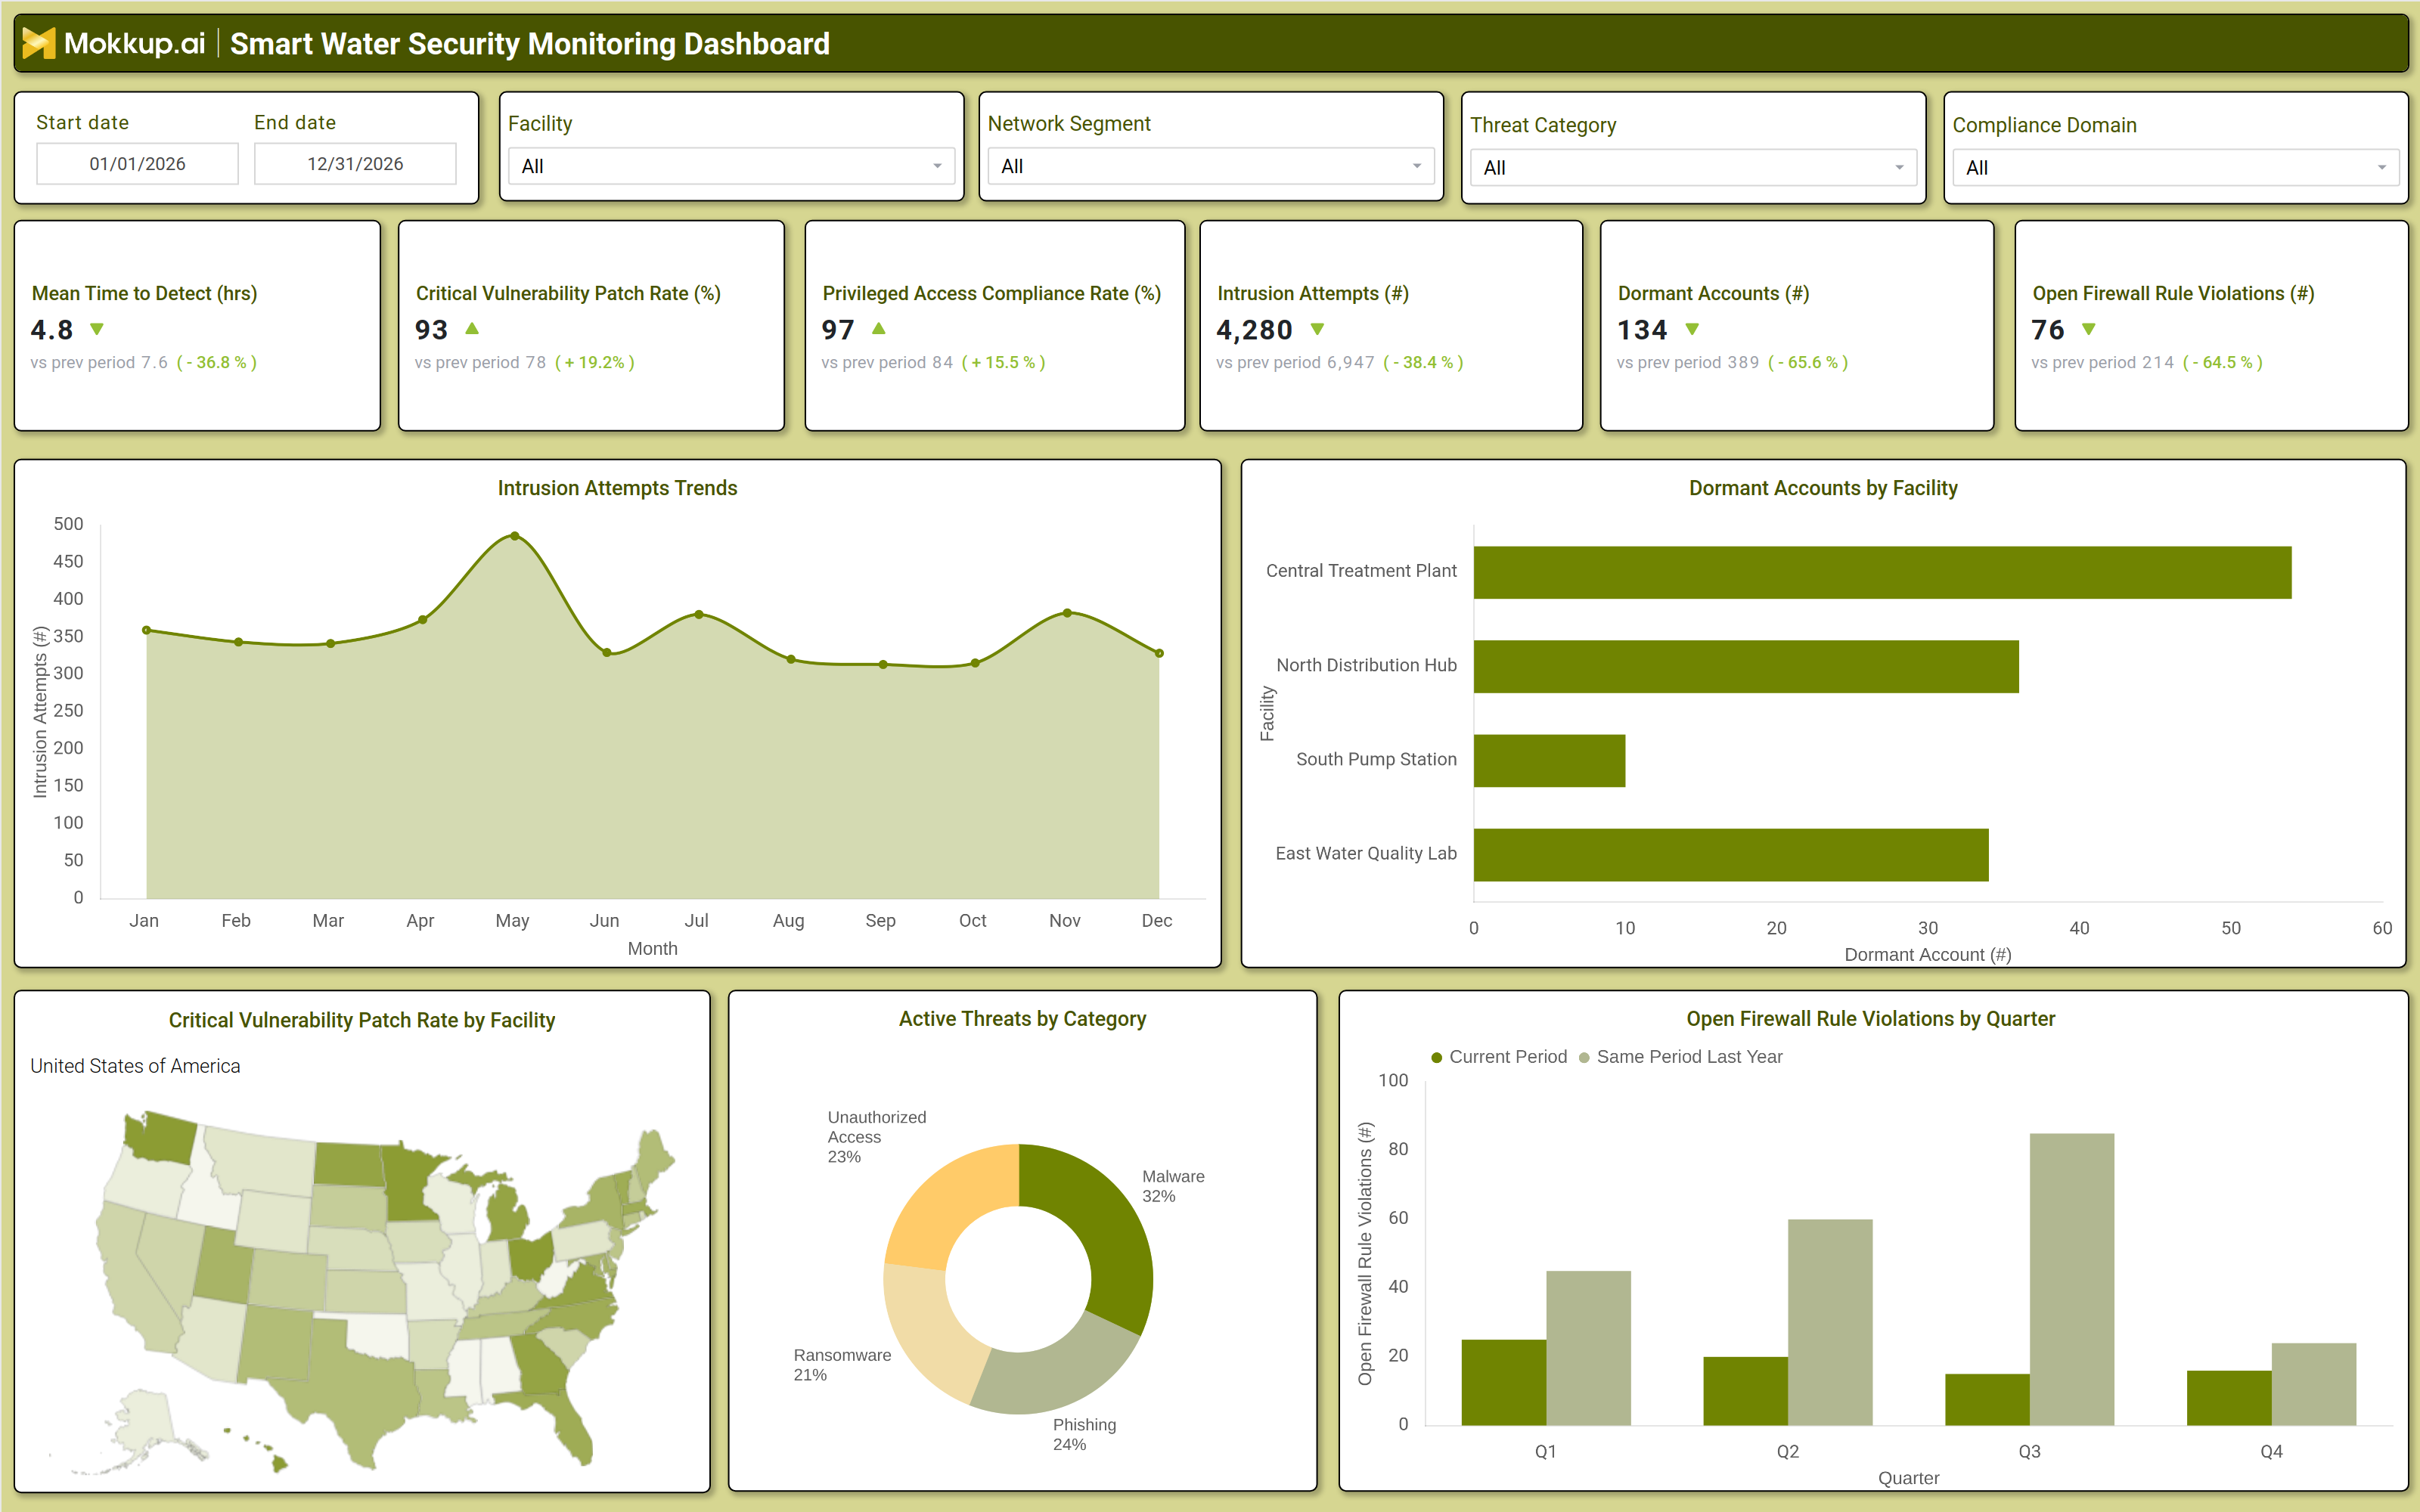
When a security operations analyst opens this dashboard at the start of a shift, the first checkpoint is the KPI row, verifying whether intrusion attempts have spiked, whether the mean time to detect has worsened, and whether privileged access compliance is holding within acceptable thresholds. If attack volumes have increased relative to the prior period, the analyst filters by Network Segment and Threat Category to determine whether the activity is concentrated in a specific part of the infrastructure and whether water utility cyber threat detection workflows are being triggered for the highest risk event types. For vulnerability management teams, the critical vulnerability patch rate water facility view is a key operational reference. Filtering by Facility reveals which treatment plants and distribution hubs are lagging in patch coverage and whether the gap is driven by access constraints, change control delays, or the breadth of the patch backlog.
Teams can pair this with the dormant account breakdown by facility to assess whether identity hygiene issues are compounding the vulnerability surface at underperforming sites, enabling a coordinated response that addresses both patching and access hygiene simultaneously. Compliance and audit teams use the quarterly firewall violations trend to assess whether misconfigured network rules are being remediated faster than they are introduced a direct indicator of whether network hardening initiatives are taking hold across the portfolio. Security leadership reviews the active threat category distribution to understand how current threats are split across malware, phishing, ransomware, and unauthorized access and whether team resource allocation reflects the evolving threat mix.
Together, these perspectives give operations and security leadership a comprehensive picture of where smart water security monitoring is delivering results and where targeted intervention is most urgently needed.
How to Analyze Data in a Smart Water Security Monitoring Dashboard
Here is how you can analyze data from this dashboard:
- Use the Facility filter to focus analysis on individual sites such as Central Treatment Plant, North Distribution Hub, South Pump Station, or East Water Quality Lab and compare security posture across locations.
- Review the Mean Time to Detect (hrs) KPI to assess whether the security operations team is identifying threats faster than the prior period and where detection workflows may need to be accelerated.
- Monitor the Intrusion Attempts Trends chart to identify months where attack volumes peaked and investigate whether specific network segments or threat categories were responsible.
- Analyze the Critical Vulnerability Patch Rate by Facility map to identify which sites have the lowest patch coverage as part of critical vulnerability patch rate water infrastructure risk prioritization.
- Review the Dormant Accounts by Facility chart to identify which facilities have the highest concentration of unused accounts and prioritize account deactivation to reduce credential based attack surface.
- Compare the Open Firewall Rule Violations by Quarter chart across Current Period and Same Period Last Year to evaluate whether network hardening initiatives are reducing misconfiguration rates quarter over quarter.
- Filter by Threat Category to isolate specific threat types such as Malware, Phishing, Ransomware, or Unauthorized Access and assess whether response protocols are calibrated for the highest volume categories.
- Track the Privileged Access Compliance Rate (%) KPI over time to measure whether identity governance controls are consistently enforced across all facilities and network segments.
Benefits of a Smart Water Security Monitoring Dashboard
The following are the benefits of using this dashboard:
- Centralizes intrusion detection, vulnerability patching, access compliance, and network hygiene metrics across all water facilities in one structured security template.
- Supports water utility cyber threat detection by tracking intrusion attempt trends alongside active threat category breakdowns for proactive response prioritization.
- Reduces manual data compilation for security compliance reporting with prebuilt KPI tiles and quarterly firewall violation comparison chart layouts.
- Enables facility-level analysis of intrusion attempts on water infrastructure exposure to identify which sites are under the greatest threat pressure across the reporting period.
- Provides a donut chart breakdown of active threats by category for security resource allocation planning and incident response prioritization.
- Helps security teams measure open firewall rule violations, tracking improvement over time without rebuilding network compliance reports from scratch each quarter.
- Gives IT/OT security teams and compliance leadership a shared geographic view of critical vulnerability patch coverage across facilities using an integrated U.S. map visualization.
KPIs to Track in a Smart Water Security Monitoring Dashboard
The following key KPIs can be tracked by using this dashboard:
- Mean Time to Detect (hrs): A foundational metric for smart water security monitoring measures how quickly the security operations team identifies active threats, with lower values indicating faster detection and reduced attacker dwell time.
- Critical Vulnerability Patch Rate (%): Tracks the proportion of critical vulnerabilities patched within required timeframes essential for water utility cyber threat detection readiness and demonstrating compliance with applicable cybersecurity frameworks.
- Privileged Access Compliance Rate (%): Measures adherence to access control policies for privileged accounts across facilities. The privileged access compliance water utility benchmark ensures that only authorized personnel can access sensitive OT and IT systems.
- Intrusion Attempts (#): Quantifies the total number of detected intrusion attempts in the period. The intrusion attempts water infrastructure indicator that measures how actively the network is being targeted and whether perimeter defenses are holding.
- Dormant Accounts (#): Tracks the number of inactive user accounts that remain enabled across facilities, a key indicator of identity hygiene and privileged access compliance water utility governance effectiveness.
- Open Firewall Rule Violations (#): Measures the number of active firewall rules conflicting with network security policy supporting open firewall rule violations tracking across facilities and quarters to assess network hardening progress.
Frequently Asked Questions
1. What teams use a Smart Water Security Monitoring Dashboard?
IT/OT security analysts, vulnerability management teams, compliance officers, and security operations leadership at water utilities and municipal treatment facilities typically rely on this dashboard to manage cyber risk and maintain regulatory compliance.
2. How does this dashboard improve cyber threat response for water utilities?
By combining the Intrusion Attempts Trends chart, the Threat Category filter, and the Mean Time to Detect KPI, security teams can identify when attack volumes surge, isolate which threat types are most active, and evaluate whether detection is fast enough to limit exposure before damage occurs.
3. Can this dashboard track firewall compliance trends over time?
Yes. The Open Firewall Rule Violations by Quarter grouped bar chart compares current period violations against the same period last year, making it straightforward to assess whether network hardening efforts are reducing misconfiguration rates or whether the gap is widening.