
What is an EPA & Drinking Water Compliance Dashboard?
An EPA & Drinking Water Compliance Dashboard is a centralized data analytics platform designed to help water utilities monitor, track, and report compliance with the Safe Drinking Water Act (SDWA) and EPA regulations. This dashboard consolidates key metrics such as Maximum Contaminant Level (MCL) violations, sampling exceedances, public notification deadlines, and lead & copper rule compliance into a single, interactive interface.
By providing water utility compliance monitoring software, it enables utilities to detect violations early, streamline reporting, and ensure adherence to EPA water quality standards. The dashboard also helps utilities identify trends in drinking water violations, assess resolution times, and improve operational efficiency in maintaining safe drinking water systems.
How to Create an EPA & Drinking Water Compliance Dashboard
You don’t need to build your report from scratch, just start with a ready to use EPA & Drinking Water Compliance dashboard template from Mokkup. Add in your data and export it however you like. Here’s how to do it:
1. Create or Log in to Your Mokkup Account
Start by signing up on Mokkup.ai using your email. If you already have an account, just log in, and you’ll be good to go.
2. Choose and Customize Your Dashboard Template
Find the EPA & Drinking Water Compliance Dashboard template in the Templates section. Use the drag and drop editor to adjust KPIs, edit filters, or add elements based on your data.
3. Export to Your BI Tool
Once your dashboard wireframe is ready, use the BI Tool Export feature to send it directly to Power BI or Tableau for further analysis and enhancements. You can also download the dashboard as a PDF, PNG, or JPEG, embed it on a platform, or invite your team to collaborate.
Note: This is a Pro template. You’ll need a Pro subscription on Mokkup to use and customize this dashboard wireframe. Upgrade anytime to unlock full access.
EPA & Drinking Water Compliance Dashboard Example
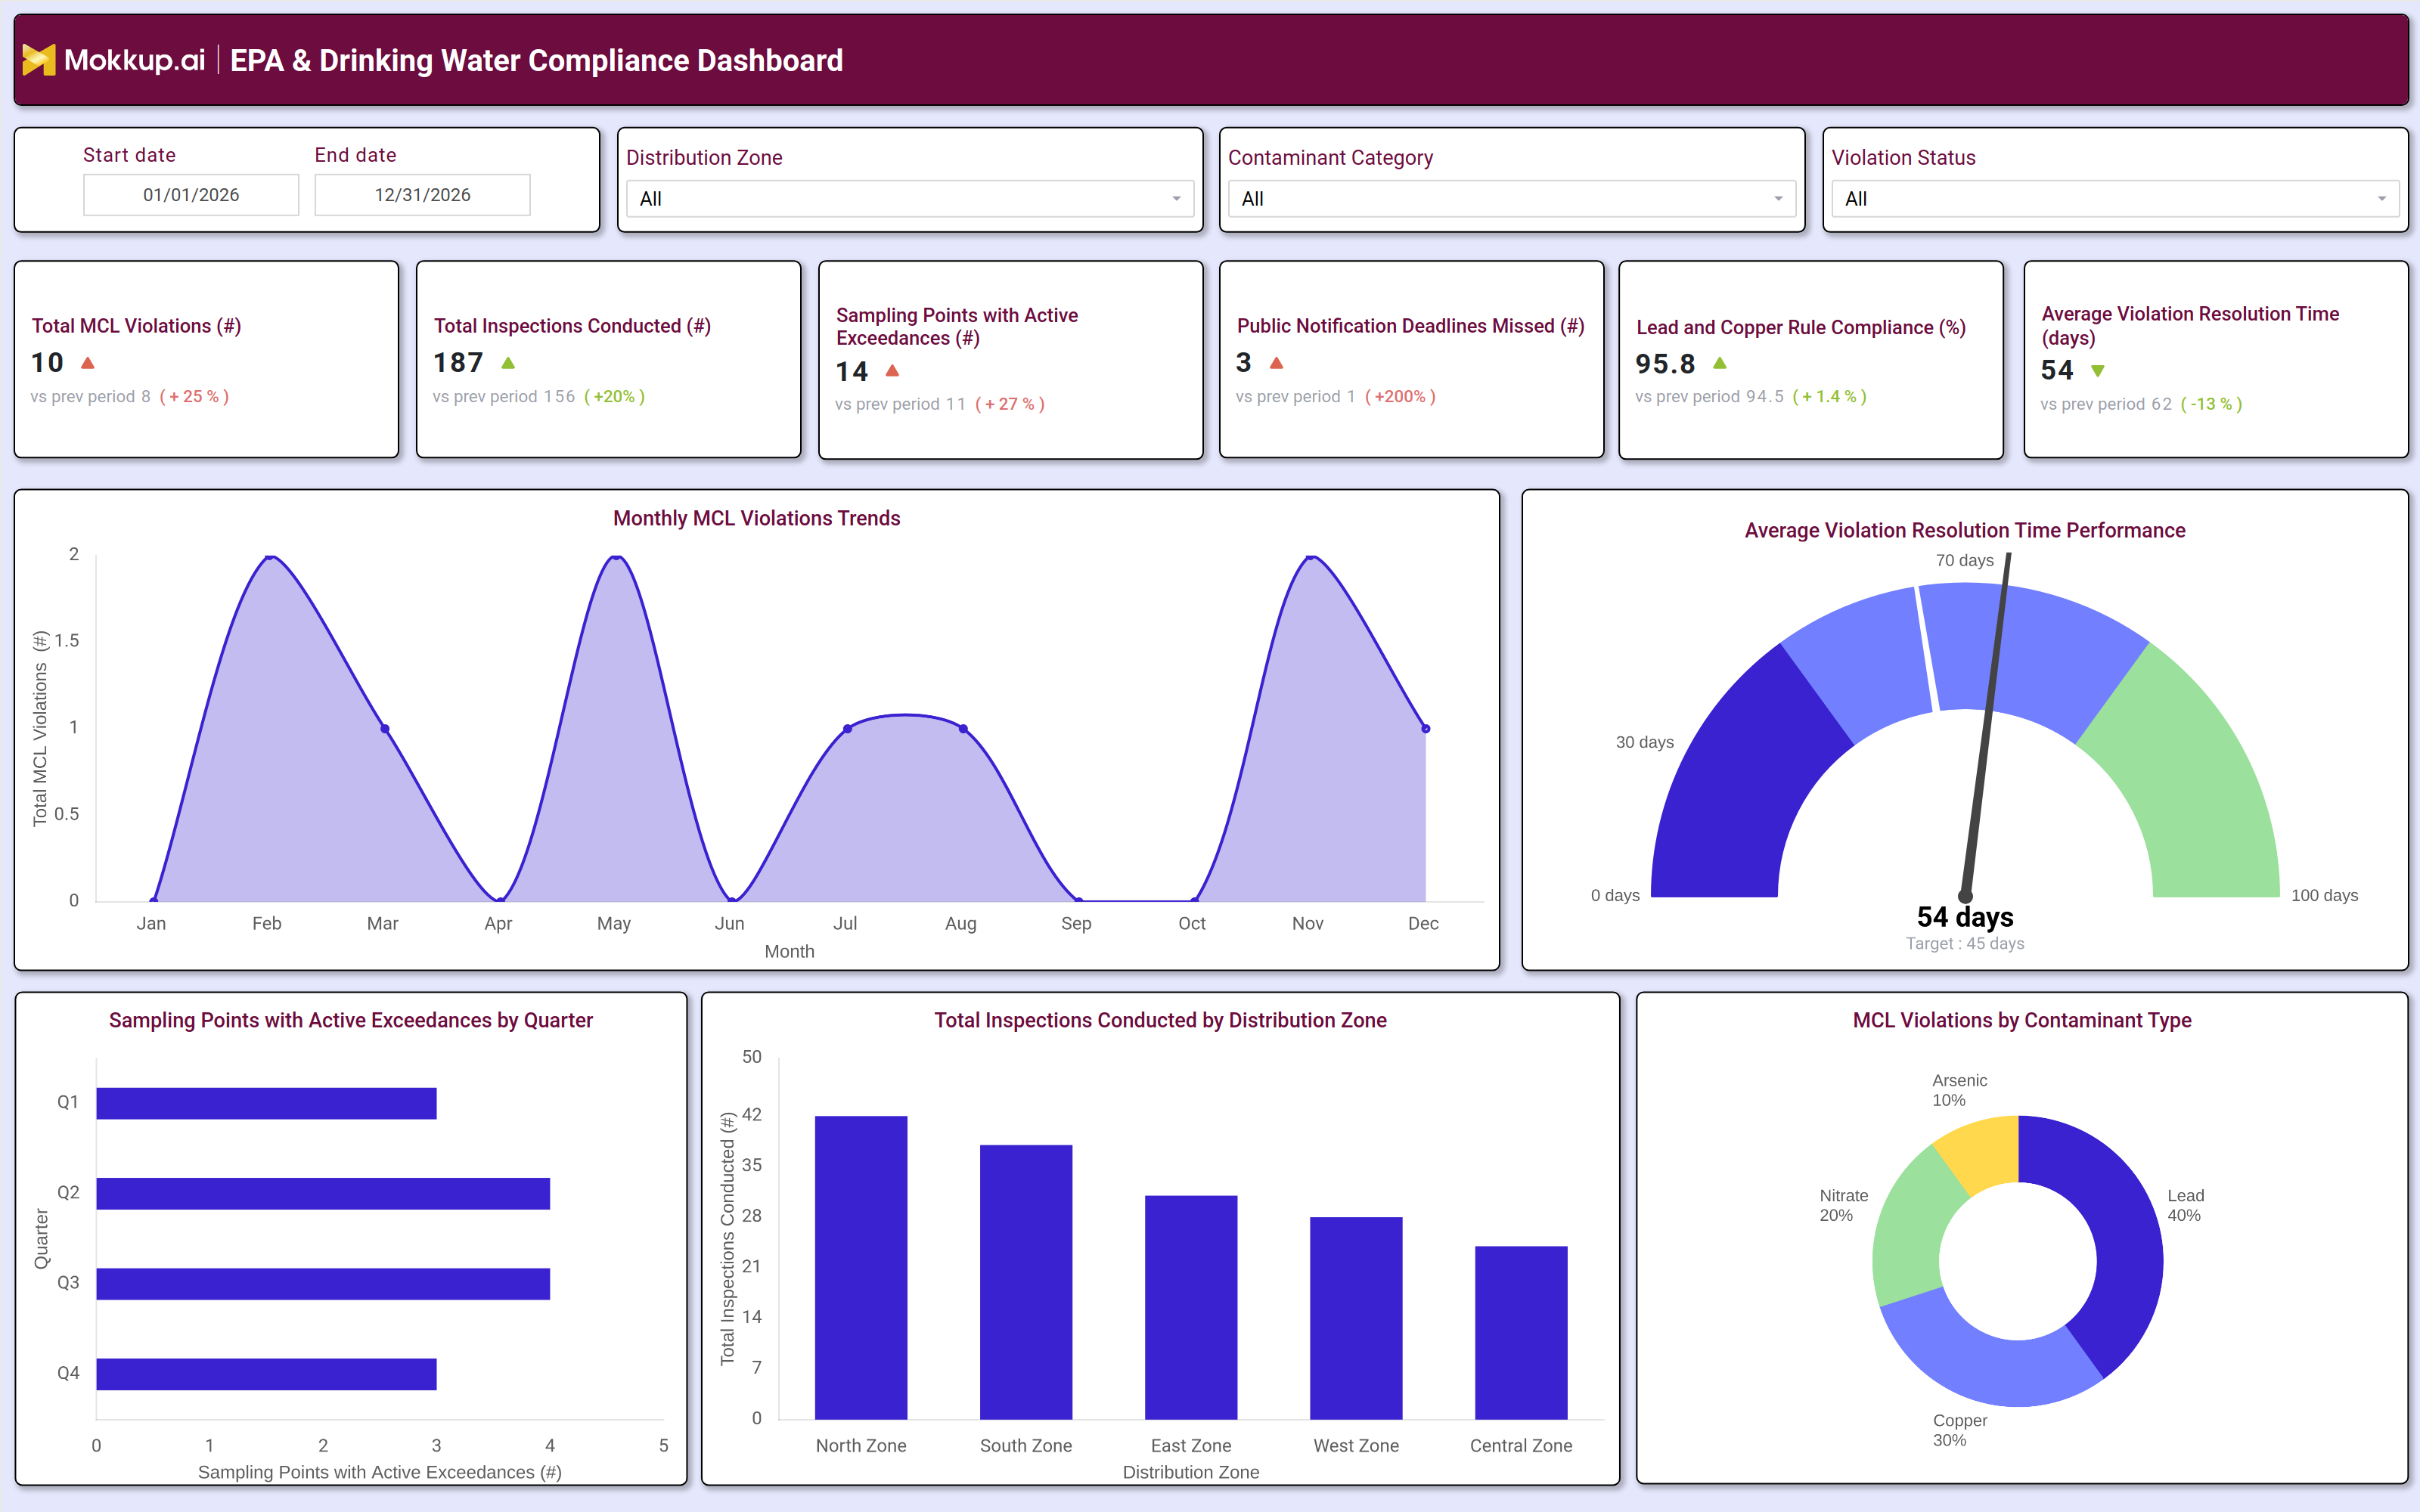
A typical EPA drinking water compliance tracking dashboard includes interactive filters for date range, distribution zone, contaminant category, and violation status, allowing users to drill down into specific compliance issues. Key performance tiles display total MCL violations, inspections conducted, sampling points with active exceedances, missed public notification deadlines, lead & copper rule compliance percentages, and average violation resolution time. Trend charts show monthly MCL violation trends, helping utilities identify seasonal or recurring compliance challenges.
A gauge chart tracks average violation resolution time against target benchmarks, while a pie chart breaks down MCL violations by contaminant type (e.g., lead, arsenic, nitrate, copper). Additionally, a quarterly bar chart highlights sampling points with active exceedances, and a distribution zone comparison shows total inspections conducted across different service areas. Together, these components form a dashboard for tracking drinking water violations that provides actionable insights for regulatory compliance and operational improvements.
How to Analyze Data in an EPA & Drinking Water Compliance Dashboard
Here is how you can analyze data from this dashboard:
- Compliance Performance Review: Review total MCL violations to assess overall compliance and compare with previous periods.
- High-Risk Area Identification: Monitor sampling points with active exceedances to identify areas requiring immediate action.
- Notification Compliance Tracking: Track public notification deadlines missed to ensure timely communication with affected communities.
- Regulatory Compliance Monitoring: Evaluate lead & copper rule compliance percentages to maintain adherence to standards.
- Resolution Efficiency Analysis: Analyze average violation resolution time to improve response speed and reduce risks.
- Contaminant Trend Analysis: Compare MCL violations by contaminant type to prioritize mitigation efforts.
- Inspection Coverage Assessment: Assess total inspections by distribution zone to ensure consistent monitoring.
- Seasonal Trend Detection: Use trend charts to identify seasonal patterns in violations and adjust strategies.
Benefits of an EPA & Drinking Water Compliance Dashboard
The following are the benefits of using this drinking water quality compliance dashboard:
- Regulatory Compliance Assurance: Ensures adherence to water quality standards and reporting requirements.
- Risk Reduction: Enables early detection of violations and exceedances.
- Improved Public Safety: Supports timely communication and corrective actions.
- Automated Reporting: Streamlines compliance reporting through centralized data.
- Operational Efficiency: Helps optimize inspections and resource allocation.
- Data-Driven Decisions: Supports better compliance monitoring and planning.
- Faster Issue Resolution: Reduces resolution time and associated regulatory risks.
KPIs to Track in an EPA & Drinking Water Compliance Dashboard
The following key KPIs can be tracked by using this drinking water regulatory dashboard:
- Total MCL Violations: Measures the number of Maximum Contaminant Level (MCL) violations detected in the water system.
- Total Inspections Conducted: Tracks the number of compliance inspections performed across distribution zones.
- Sampling Points with Active Exceedances: Identifies locations where contaminant levels exceed EPA limits.
- Public Notification Deadlines Missed: Monitors missed deadlines for notifying the public about violations.
- Lead & Copper Rule Compliance (%): Measures adherence to EPA’s lead and copper rule standards.
- Average Violation Resolution Time (days): Tracks how quickly violations are resolved to ensure compliance.
Frequently Asked Questions
Q1. What is a federal water regulation dashboard used for?
It helps water utilities monitor EPA water quality standards, track drinking water violations, and ensure SDWA compliance through data-driven insights
Q2. What data sources feed into this EPA enforcement tracking dashboard?
Data comes from water quality testing reports, EPA compliance databases, public notification logs, and utility inspection records.
Q3. How does this water utility compliance monitoring dashboard improve regulatory reporting?
It automates EPA Safe Drinking Water Act reporting tools, reducing manual errors and ensuring timely submissions.