
What Is a Smart Water ROI & Cost Dashboard?
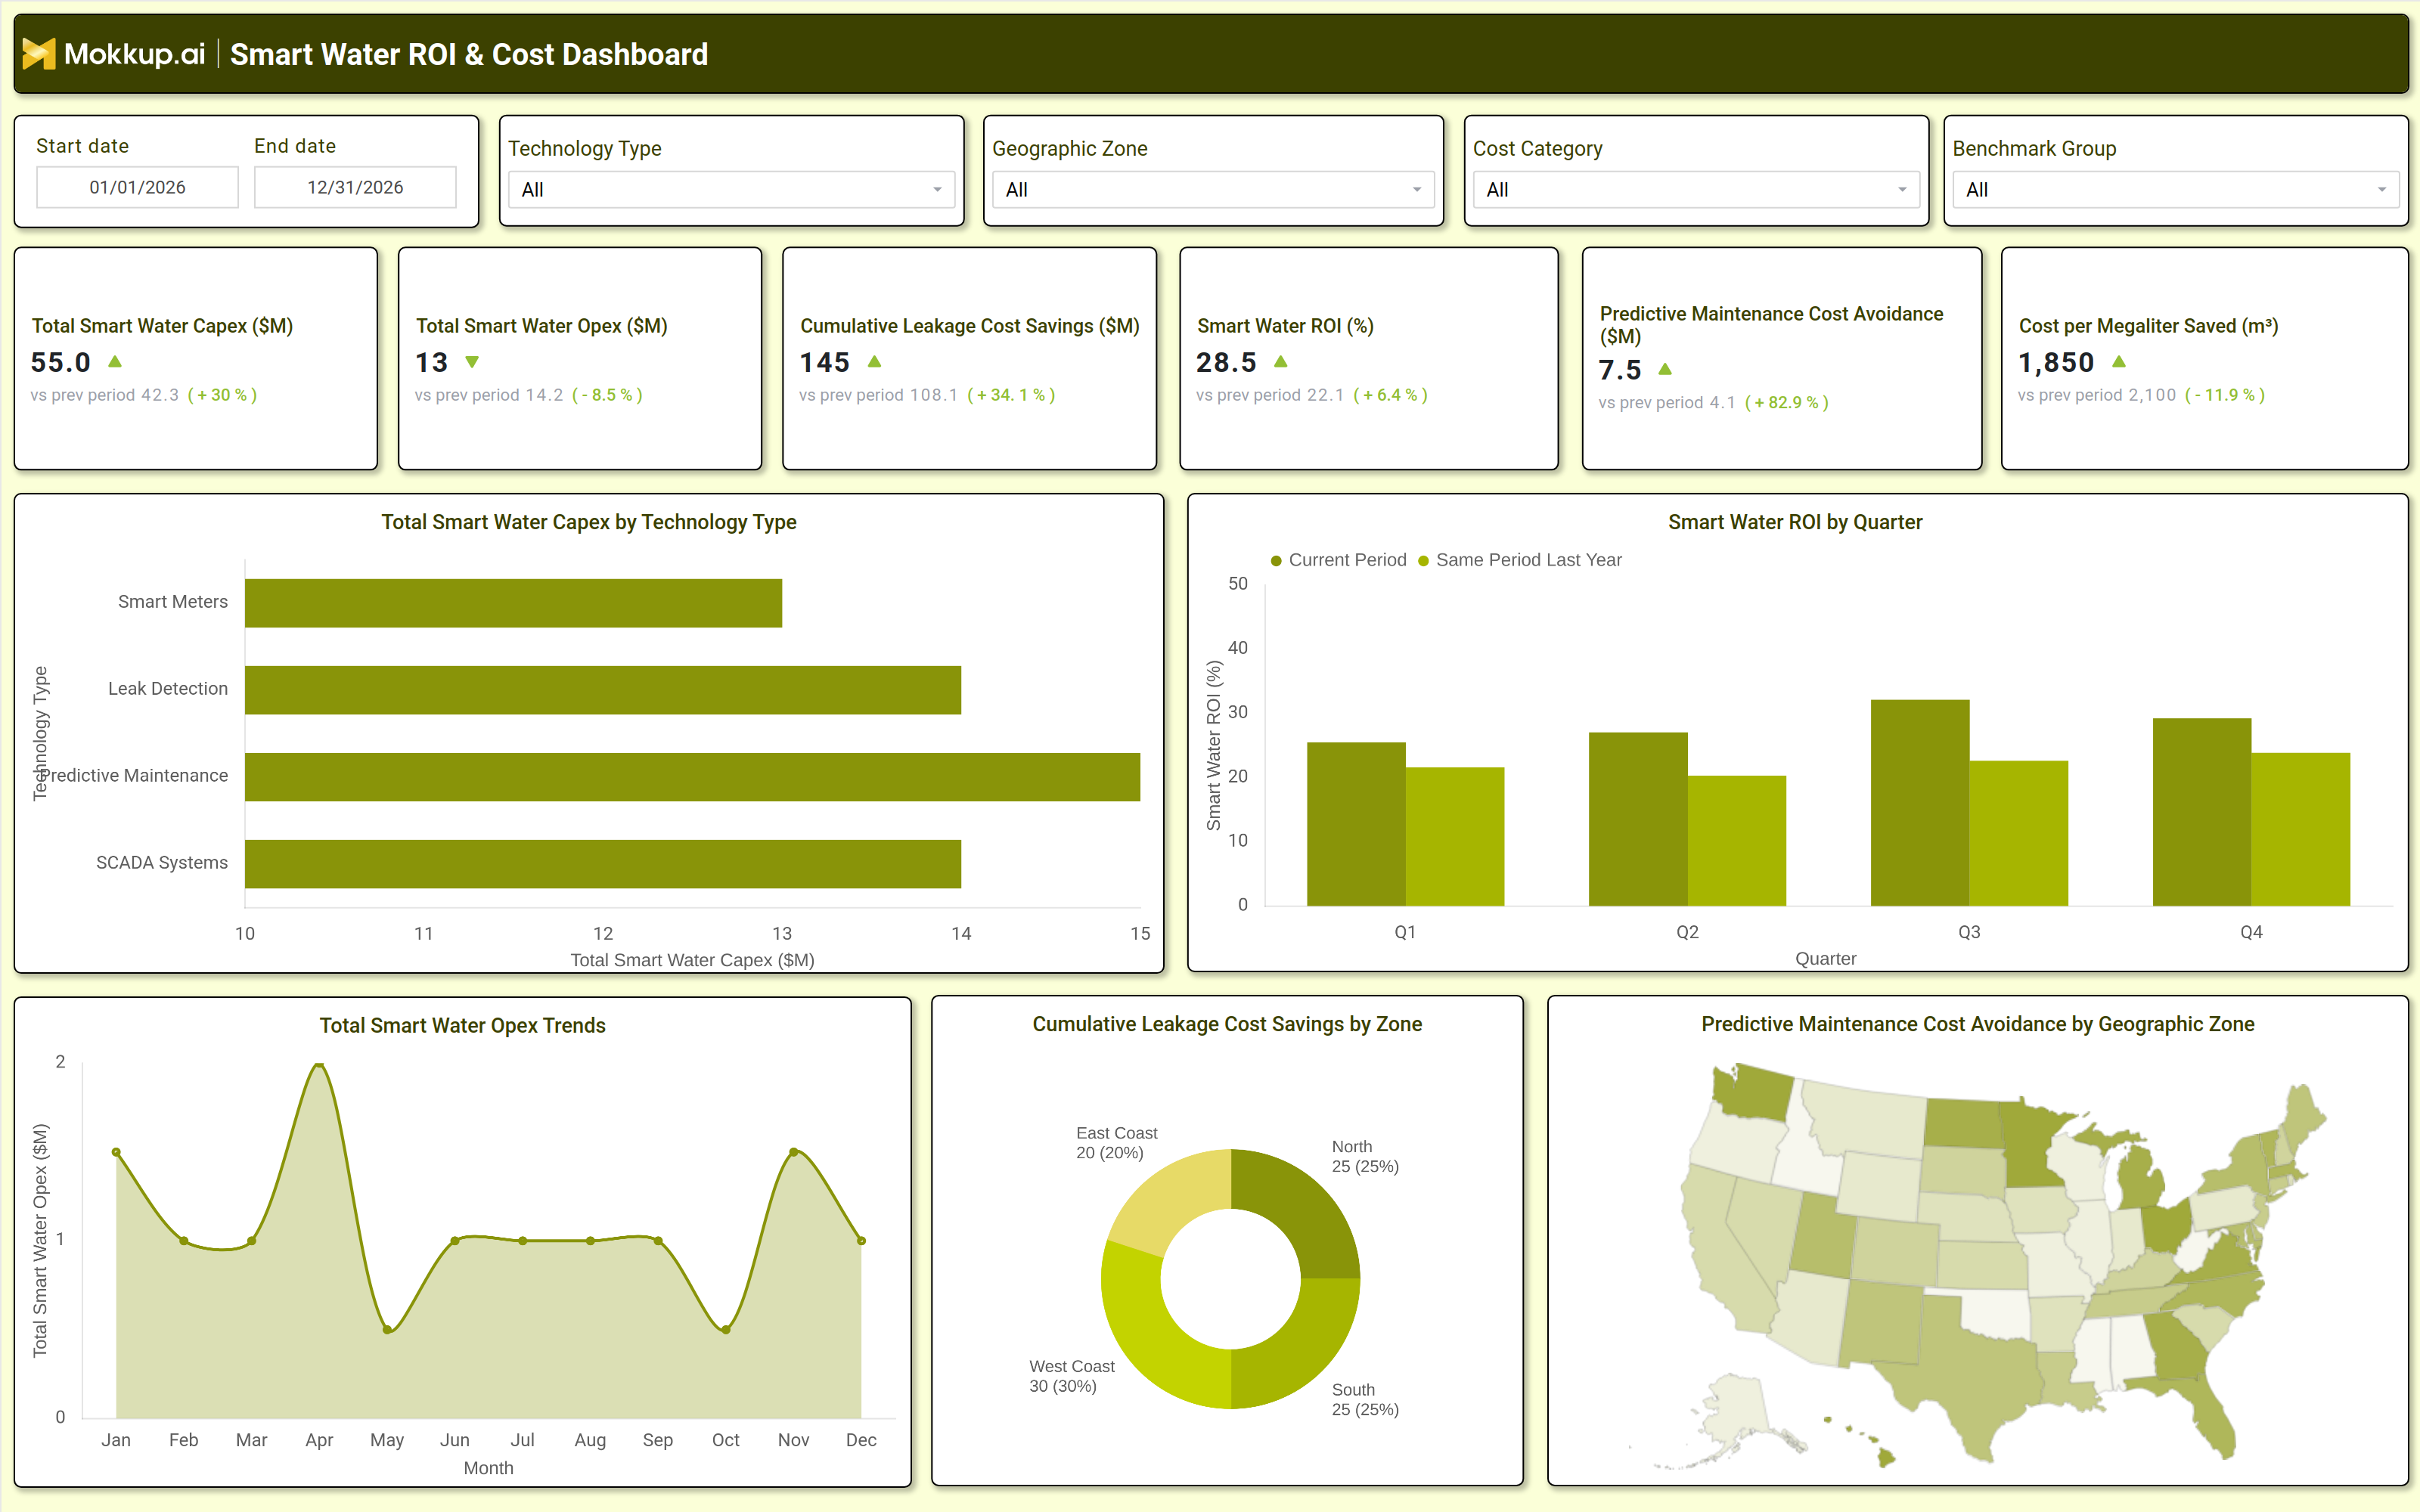
A Smart Water ROI & Cost Dashboard is a data-driven analytics tool designed to help water and wastewater utilities measure the financial impact of smart water technologies. It consolidates capital expenditures (CapEx), operational expenses (OpEx), leakage cost savings, predictive maintenance benefits, and return on investment (ROI) into a single, actionable view. By tracking key performance indicators (KPIs) like cost per megalitre saved, cumulative leakage reductions, and technology-specific spending, utilities can assess the efficiency of their smart water infrastructure investments. This dashboard enables decision-makers to identify cost-saving opportunities, optimize resource allocation, and justify technology adoption with clear financial insights.
How to Create a Smart Water ROI & Cost Dashboard
You don’t need to build your report from scratch; just start with a ready-to-use dashboard template from Mokkup. Add in your data and export it however you like. Here’s how to do it:
1. Create or Log in to Your Mokkup Account
Start by signing up on Mokkup.ai using your email. If you already have an account, just log in, and you’ll be good to go.
2. Choose and Customize Your Dashboard Template
Find the Smart Water ROI & Cost Dashboard template in the Templates section. Use the drag and drop editor to adjust KPIs, edit filters, or add elements based on your data.
3. Export to Your BI Tool
Once your dashboard wireframe is ready, use the BI Tool Export feature to send it directly to Power BI or Tableau for further analysis and enhancements. You can also download the dashboard as a PDF, PNG, or JPEG, embed it on a platform, or invite your team to collaborate.
Note: This is a Pro template. You’ll need a Pro subscription on Mokkup to use and customize this dashboard wireframe. Upgrade anytime to unlock full access.
Smart Water ROI & Cost Dashboard Example
A well-structured Smart Water ROI & Cost Dashboard includes interactive filters for date ranges, technology types (e.g., smart meters, leak detection, SCADA systems), geographic zones, and cost categories. Key metrics displayed in performance tiles include total smart water CapEx, OpEx trends, cumulative leakage cost savings, ROI percentages, predictive maintenance cost avoidance, and cost per megaliter saved. Visualizations such as bar charts break down CapEx by technology type, while line graphs show OpEx trends over time. A geographic heatmap highlights leakage cost savings by region, and a quarterly ROI comparison chart tracks performance against previous periods. Together, these components provide utilities with a comprehensive view of financial efficiency, helping them refine strategies for long-term cost optimization.
How to Analyze Data in an Smart Water ROI & Cost Dashboard
Here is how you can analyze data from this water utility productivity monitoring dashboard:
- Review total smart water CapEx vs. OpEx to assess spending trends and identify cost imbalances.
- Track cumulative leakage cost savings to measure the financial impact of leak detection technologies.
- Compare smart water ROI percentages against previous periods to evaluate technology performance.
- Analyze predictive maintenance cost avoidance to quantify savings from proactive repairs.
- Monitor cost per megaliter saved to determine efficiency improvements in water conservation.
- Break down CapEx by technology type (e.g., smart meters, SCADA, leak detection) to prioritize investments.
- Use geographic zone filters to identify highperforming and underperforming regions.
- Compare current OpEx trends with historical data to detect cost fluctuations.
Benefits of a Smart Water ROI & Cost Dashboard
The following are the benefits of using this predictive maintenance cost dashboard:
- Maximizes financial transparency by tracking smart water technology investments and savings.
- Optimizes utility spending by identifying costsaving opportunities in CapEx and OpEx.
- Justifies smart water infrastructure investments with measurable ROI data.
- Reduces water loss costs by monitoring leakage savings and efficiency gains.
- Enhances predictive maintenance strategies by quantifying avoided repair expenses.
- Supports data-driven decision-making for budget allocation and technology adoption.
- Improves regulatory compliance by demonstrating cost efficiency in water management.
- Enables benchmarking against industry standards for continuous improvement.
KPIs to Track in a Smart Water ROI & Cost Dashboard
The following key KPIs can be tracked by using this leakage reduction financial dashboard:
- Total Smart Water CapEx ($M): Measures total capital investment in smart water technologies.
- Total Smart Water OpEx ($M): Tracks operational expenses related to smart water systems.
- Cumulative Leakage Cost Savings ($M): Quantifies financial savings from reduced water loss.
- Smart Water ROI (%): Calculates the return on investment from smart water technologies.
- Predictive Maintenance Cost Avoidance ($M): Estimates savings from proactive maintenance.
- Cost per Megaliter Saved ($/m³): Evaluates efficiency in water conservation efforts.
Frequently Asked Questions
1. How does a smart water CapEx OpEx dashboard help utilities?
It provides financial insights into smart water investments, helping utilities optimize spending, reduce leakage costs, and improve ROI.
2. Who should use a water utility cost savings dashboard?
Utility managers, financial analysts, operations teams, and policymakers involved in water infrastructure planning.
3. Can this smart water ROI dashboard integrate with existing utility software?
Yes, it can connect with ERP systems, asset management platforms, and IoT based water monitoring tools.