
What is a Natural Gas Distribution SCADA, AMI & Digital Metering Dashboard
A Natural Gas Distribution SCADA, AMI & Digital Metering Dashboard is an advanced visualization platform designed to monitor, analyze, and optimize the performance of natural gas distribution networks through the integration of Supervisory Control and Data Acquisition (SCADA) systems, Advanced Metering Infrastructure (AMI), and digital metering technologies. It consolidates critical operational and cybersecurity metrics, including SCADA uptime, smart meter read success rates, critical alarms, cyber incidents, meter read times, and mean time to detect anomalies into a unified, real-time interface.
By integrating gas distribution SCADA monitoring, AMI gas metering analytics, digital metering infrastructure management, and OT cybersecurity incident tracking, this dashboard enables grid operators, metering specialists, cybersecurity analysts, and utility leadership to ensure reliable gas delivery, optimize network performance, reduce non-revenue gas, enhance customer service, and protect critical infrastructure from cyber threats. It serves as a central command center for modern, secure, data-driven gas distribution operations.
How to Create a Natural Gas Distribution SCADA, AMI & Digital Metering Dashboard
Mokkup.ai provides a ready-to-use Natural Gas Distribution SCADA, AMI & Digital Metering Dashboard template that you can customize to fit your operational needs.
1. Create or Log in to Your Mokkup Account
Start by signing up on Mokkup.ai using your email. If you already have an account, just log in, and you'll be good to go.
2. Choose and Customize Your Dashboard Template
Find the Natural Gas Distribution SCADA, AMI & Digital Metering Dashboard template in the Templates section. Use the drag-and-drop editor to adjust KPIs, edit filters, or add elements based on your data.
3. Export to Your BI Tool
Once your dashboard wireframe is ready, use the BI Tool Export feature to send it directly to Power BI or Tableau for further analysis and enhancements. You can also download the dashboard as a PDF, PNG, or JPEG, embed it on a platform, or invite your team to collaborate.
Note: This is a Pro template. You'll need a Pro subscription on Mokkup to use and customize this dashboard wireframe. Upgrade anytime to unlock full access.
Natural Gas Distribution SCADA, AMI & Digital Metering Dashboard Example
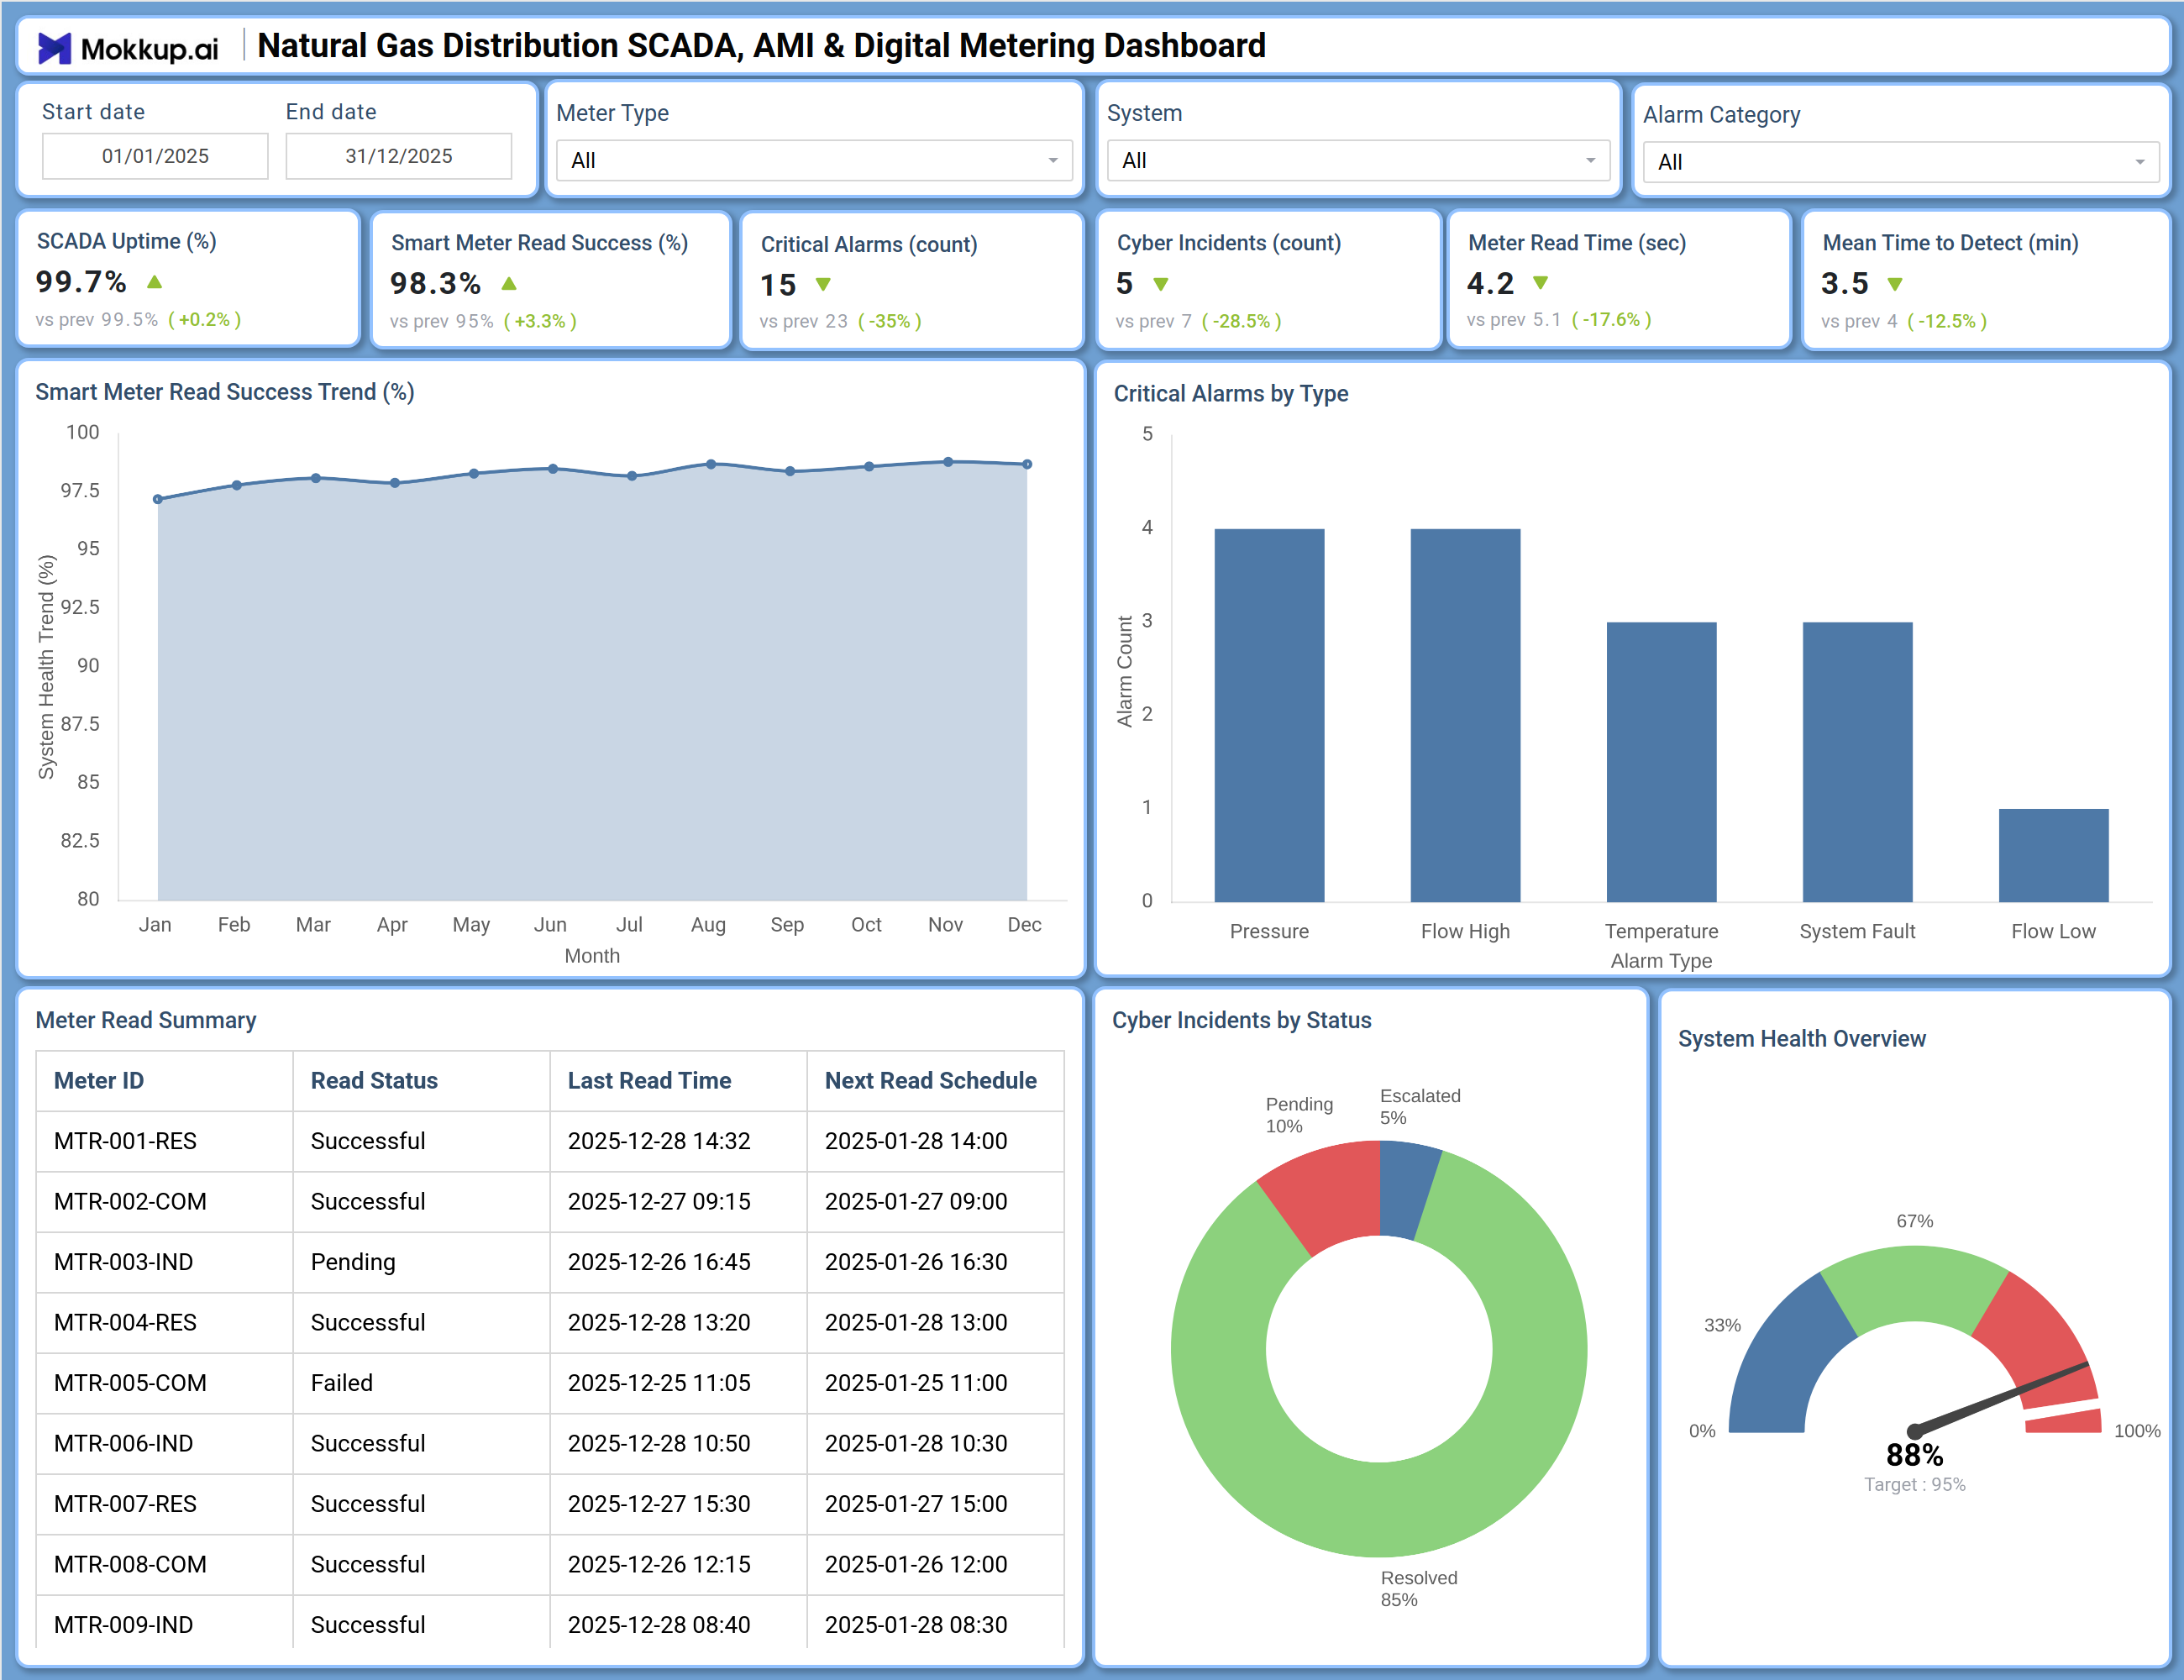
This dashboard delivers a comprehensive view of natural gas distribution network performance, metering intelligence, and cybersecurity posture. The Overview screen prominently displays six critical operational and security KPIs: SCADA Uptime at 99.7% (improved from 99.5%), Smart Meter Read Success Rate at 98.3% (up 3.3%), Critical Alarms reduced to 15 (35% decrease), Cyber Incidents at 2 (33.3% reduction), Meter Read Time improved to 4.2 seconds (17.6% faster), and Mean Time to Detect anomalies at 3.5 minutes (12.5% improvement).
The Smart Meter Read Success Trend chart tracks monthly read success rates, revealing patterns and identifying periods requiring attention. Critical Alarms by Type provides a detailed breakdown of alarm categories including Pressure Alarms, Flow High, Temperature Alarm, System Fault, and Flow Low, enabling targeted response. The Meter Read Summary table lists individual meters with read status, last read time, and next scheduled read, allowing field teams to prioritize failed or pending reads. Cyber Incidents by Status pie chart shows the distribution of incidents across Pending (10%), Escalated (5%), and Resolved (85%) categories, providing visibility into cybersecurity response effectiveness. The System Health Overview bar chart tracks current system health against the 95% target. Together, these components enable gas distribution network optimization, AMI performance monitoring, OT cybersecurity incident tracking, and data-driven operational decision-making.
How to Analyze Data in a Natural Gas Distribution SCADA, AMI & Digital Metering Dashboard
Here is how you can analyze data from this dashboard:
- Monitor SCADA Uptime (%) to ensure communication infrastructure remains reliable and identify degradation trends requiring attention.
- Track Smart Meter Read Success Rate (%) over time to detect metering communication issues and prioritize field service visits for failed reads.
- Review Critical Alarms (count) by type to identify recurring issues such as pressure anomalies or flow fluctuations requiring engineering assessment.
- Analyze Cyber Incidents (count) and their status distribution to evaluate cybersecurity posture and incident response effectiveness.
- Examine Meter Read Time (sec) to assess AMI network performance and identify opportunities for latency reduction.
- Evaluate Mean Time to Detect (min) anomalies to measure the effectiveness of monitoring systems and alerting mechanisms.
- Use the Smart Meter Read Success Trend chart to correlate read success with seasonal patterns or network changes.
- Drill into Critical Alarms by Type to allocate resources to the most frequent or severe alarm categories.
- Review the Meter Read Summary table to identify meters with "Failed" or "Pending" status for immediate follow-up.
- Assess Cyber Incidents by Status to ensure incidents are being resolved in a timely manner and escalated appropriately.
- Monitor System Health Overview against target to maintain overall network performance within acceptable parameters.
Benefits of a Natural Gas Distribution SCADA, AMI & Digital Metering Dashboard
The following are the benefits of using this dashboard:
- Provides centralized, real-time visibility into gas distribution network performance, metering operations, and cybersecurity posture.
- Enables proactive problem detection through alerting on critical alarms, meter read failures, and cyber incidents.
- Improves network reliability by monitoring SCADA uptime and detecting communication issues before they impact operations.
- Reduces non-revenue gas through enhanced detection of metering inaccuracies and failed reads requiring investigation.
- Optimizes field service operations by prioritizing visits based on meter read status and alarm severity.
- Enhances cybersecurity through real-time incident tracking and visibility into response effectiveness.
- Supports regulatory compliance with monitoring and reporting of system health and security metrics.
- Facilitates data-driven capital planning with visibility into metering enterprise performance trends.
KPIs to Track in a Natural Gas Distribution SCADA, AMI & Digital Metering Dashboard
The following key KPIs can be tracked by using this dashboard:
- SCADA Uptime (%): Percentage of time SCADA systems maintain communication with field devices.
- Smart Meter Read Success Rate (%): Percentage of successful automated meter reads completed within the billing cycle.
- Critical Alarms (count): Number of high-severity alarms requiring immediate attention (pressure, flow, temperature, system faults).
- Cyber Incidents (count): Number of confirmed or suspected cybersecurity incidents affecting OT or IT systems.
- Meter Read Time (sec): Average time to complete a remote meter read transaction.
- Mean Time to Detect (minutes): Average time from anomaly occurrence to detection by monitoring systems.
- System Health Trend (%): Monthly composite measure of overall system performance against target.
- Alarms by Type: Breakdown of critical alarms by category (Pressure, Flow High, Temperature, System Fault, Flow Low).
- Meter Read Status Distribution: Count of meters by read status (Successful, Failed, Pending).
- Cyber Incident Resolution Status: Percentage of incidents by status (Pending, Escalated, Resolved).
- System Health vs. Target: Current system health percentage compared to established target.
Frequently Asked Questions
1. What is the purpose of this Natural Gas Distribution SCADA, AMI & Digital Metering Dashboard?
This dashboard provides a centralized view of gas distribution network performance, metering infrastructure health, and cybersecurity incidents. It helps operators monitor SCADA uptime, track smart meter read success rates, manage critical alarms, and oversee cyber incident response—all in one unified interface.
2. How does this dashboard help improve meter read success rates?
By tracking monthly read success trends and providing a detailed Meter Read Summary table with individual meter status, the dashboard enables field teams to quickly identify failed or pending reads and prioritize them for investigation or repair, ultimately improving billing accuracy and reducing non-revenue gas.
3. What types of critical alarms can be monitored?
The dashboard tracks multiple alarm categories including Pressure Alarms, Flow High Alarms, Temperature Alarms, System Faults, and Flow Low Alarms. This breakdown helps operators identify recurring issues and allocate resources to the most critical or frequent alarm types.
4. Can this dashboard help reduce meter read time?
Yes. By tracking average meter read time as a KPI, the dashboard enables performance benchmarking over time. If read times increase, operators can investigate potential causes such as network congestion, communication failures, or meter battery issues and take corrective action.
5. Who typically uses this dashboard?
Gas distribution system operators, SCADA engineers, metering specialists, cybersecurity analysts, field service supervisors, network planners, and utility leadership use this dashboard to oversee operations, manage incidents, and drive performance improvement.