What is a Coal Power Plant CapEx Performance Dashboard?
A Coal Power Plant CapEx Performance Dashboard is a strategic tool designed for leadership, including plant managers, finance directors, and project controllers, to monitor and analyze capital expenditure performance across coal power plants. It provides a clear view of approved budgets, actual spending, budget utilization, cost variance, project completion rates, and projected return on investment. Unlike traditional spreadsheets, this dashboard serves as a centralized CapEx performance tracking dashboard for coal power plants, helping stakeholders track financial discipline, project progress, and investment outcomes in one place.
How to Create a Coal Power Plant CapEx Performance Dashboard
You don’t need to start from scratch—simply use a pre-built Coal Power Plant CapEx Performance Dashboard template from Mokkup. Customize it with your data and export it with ease. Here’s how:
1. Create or Log in to Your Mokkup Account
Sign up on Mokkup.ai using your email address. Existing users can log in directly.
2. Choose and Customize Your Dashboard Template
Navigate to the Templates section and select the Coal Power Plant CapEx Performance Dashboard. Use the drag-and-drop editor to modify KPIs, adjust filters, or add new elements based on your project data.
3. Export to Your BI Tool
Once your dashboard wireframe is ready, export it directly to Power BI or Tableau using the BI Tool Export feature. You can also download it as a PDF, PNG, or JPEG, embed it in presentations, or invite team members to collaborate.
Note: This is a Pro template. A Mokkup Pro subscription is required to customize and use this dashboard wireframe. Upgrade anytime to access all features.
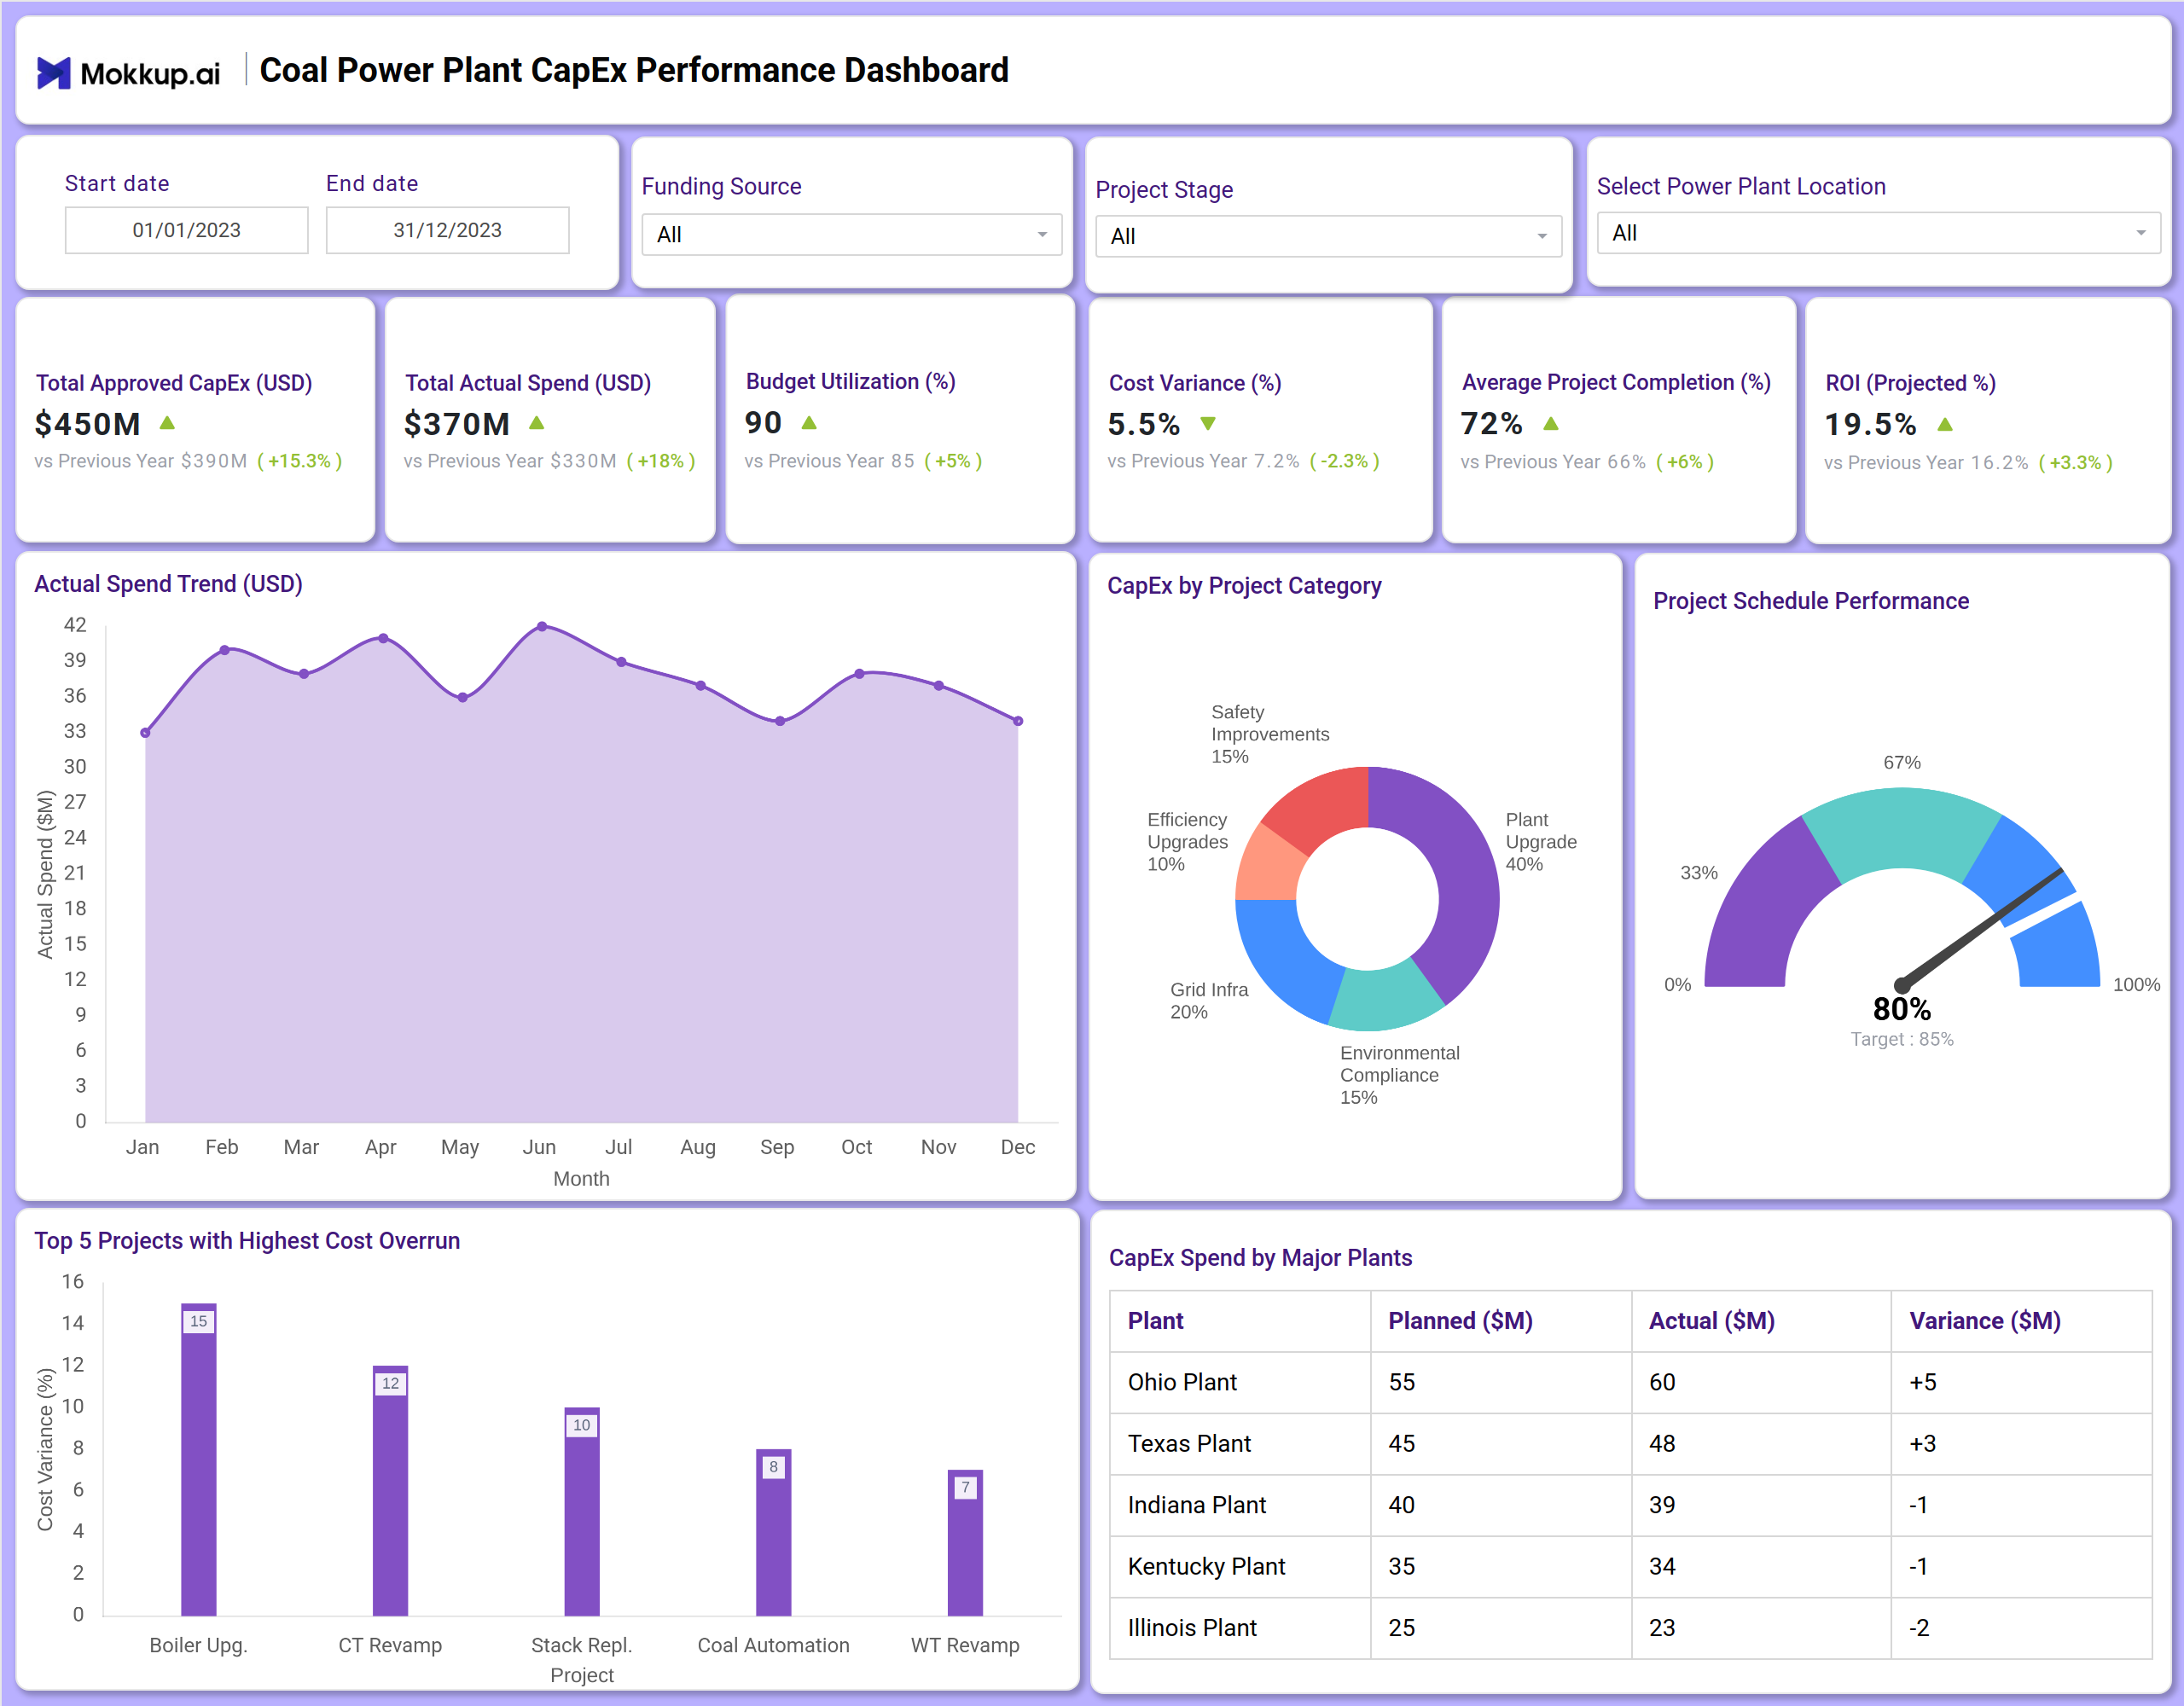
Coal Power Plant CapEx Performance Dashboard Example
A Coal Power Plant CapEx Performance Dashboard typically includes a mix of KPI tiles and visualizations. At the top, KPI cards display key financial and project metrics, including total approved CapEx, actual spend, budget utilization, cost variance, average project completion time, and projected ROI. Below, charts illustrate monthly actual spend trends, CapEx distribution by project category, project schedule performance, and a detailed breakdown of spend by major plants. A table and bar chart highlight plants and projects with the highest cost overruns. Together, this dashboard serves as a key tool for tracking CapEx performance in energy efficiency, providing leadership with a clear view of both financial and operational performance.
How to Analyze Data in Coal Power Generation CapEx Dashboards
Here’s how power generation leaders can leverage the Coal Power Plant CapEx Performance Dashboard:
- Monitor budget adherence: Compare total approved CapEx vs. actual spend to track financial discipline.
- Track spending efficiency: Analyze budget utilization rates to ensure funds are used effectively.
- Assess cost control: Review cost variance percentages to identify deviations from planned budgets.
- Evaluate project progress: Use average project completion rates to gauge timely execution.
- Forecast investment returns: Examine projected ROI to understand the financial benefits of CapEx projects.
- Identify overspending plants: Check the CapEx spend table to see which plants are over or under budget.
- Pinpoint high-overrun projects: Use the top projects chart to focus on initiatives with the highest cost overruns.
Benefits of Coal Power Plant CapEx Performance Dashboards
- Financial visibility: Clear insight into approved budgets, actual spend, and budget utilization.
- Project tracking: Monitor completion rates and schedule performance across projects.
- Cost management: Identify variances and overruns to improve budget control.
- ROI forecasting: Understand the projected financial return on capital investments.
- Informed decision-making: Use data to prioritize projects and allocate resources efficiently.
- Compliance and Reporting: Serve as a CapEx compliance dashboard for coal power plants, supporting audits and governance.
Together, these elements help plant managers and financial leaders maintain control over capital projects, improve accountability, and align spending with strategic goals—making it the best CapEx performance dashboard for coal power plants.
KPIs to Track in Coal Power Plant CapEx Dashboards
- Total Approved CapEx (USD): Total budget allocated for capital projects.
- Total Actual Spend (USD): Total amount spent against the approved budget.
- Budget Utilization (%): Percentage of approved budget actually used.
- Cost Variance (%): Difference between planned and actual costs as a percentage.
- Average Project Completion (%): Average progress of all projects toward completion.
- ROI (Projected %): Expected return on investment from CapEx projects.
- CapEx by Project Category: Breakdown of spending by type (e.g., Safety, Efficiency, Environmental).
- Project Schedule Performance: On-time vs. delayed project status.
- CapEx Spend by Major Plants: Planned vs. actual spend per plant with variance.
- Top Projects with Highest Cost Overrun: Initiatives exceeding budget targets.
Frequently Asked Questions
1. Who should use a Coal Power Plant CapEx Performance Dashboard?
Plant managers, finance teams, project controllers, and senior leadership are involved in capital project oversight.
2. How does it support project management?
It provides visibility into project completion rates and schedule performance, helping keep projects on track.
3. Is this dashboard useful for financial reporting?
Absolutely. It serves as a capital expenditure (CapEx) reporting dashboard for coal power plants, supporting both internal and external reporting needs.