
What is a Smart Water System Resilience Dashboard?
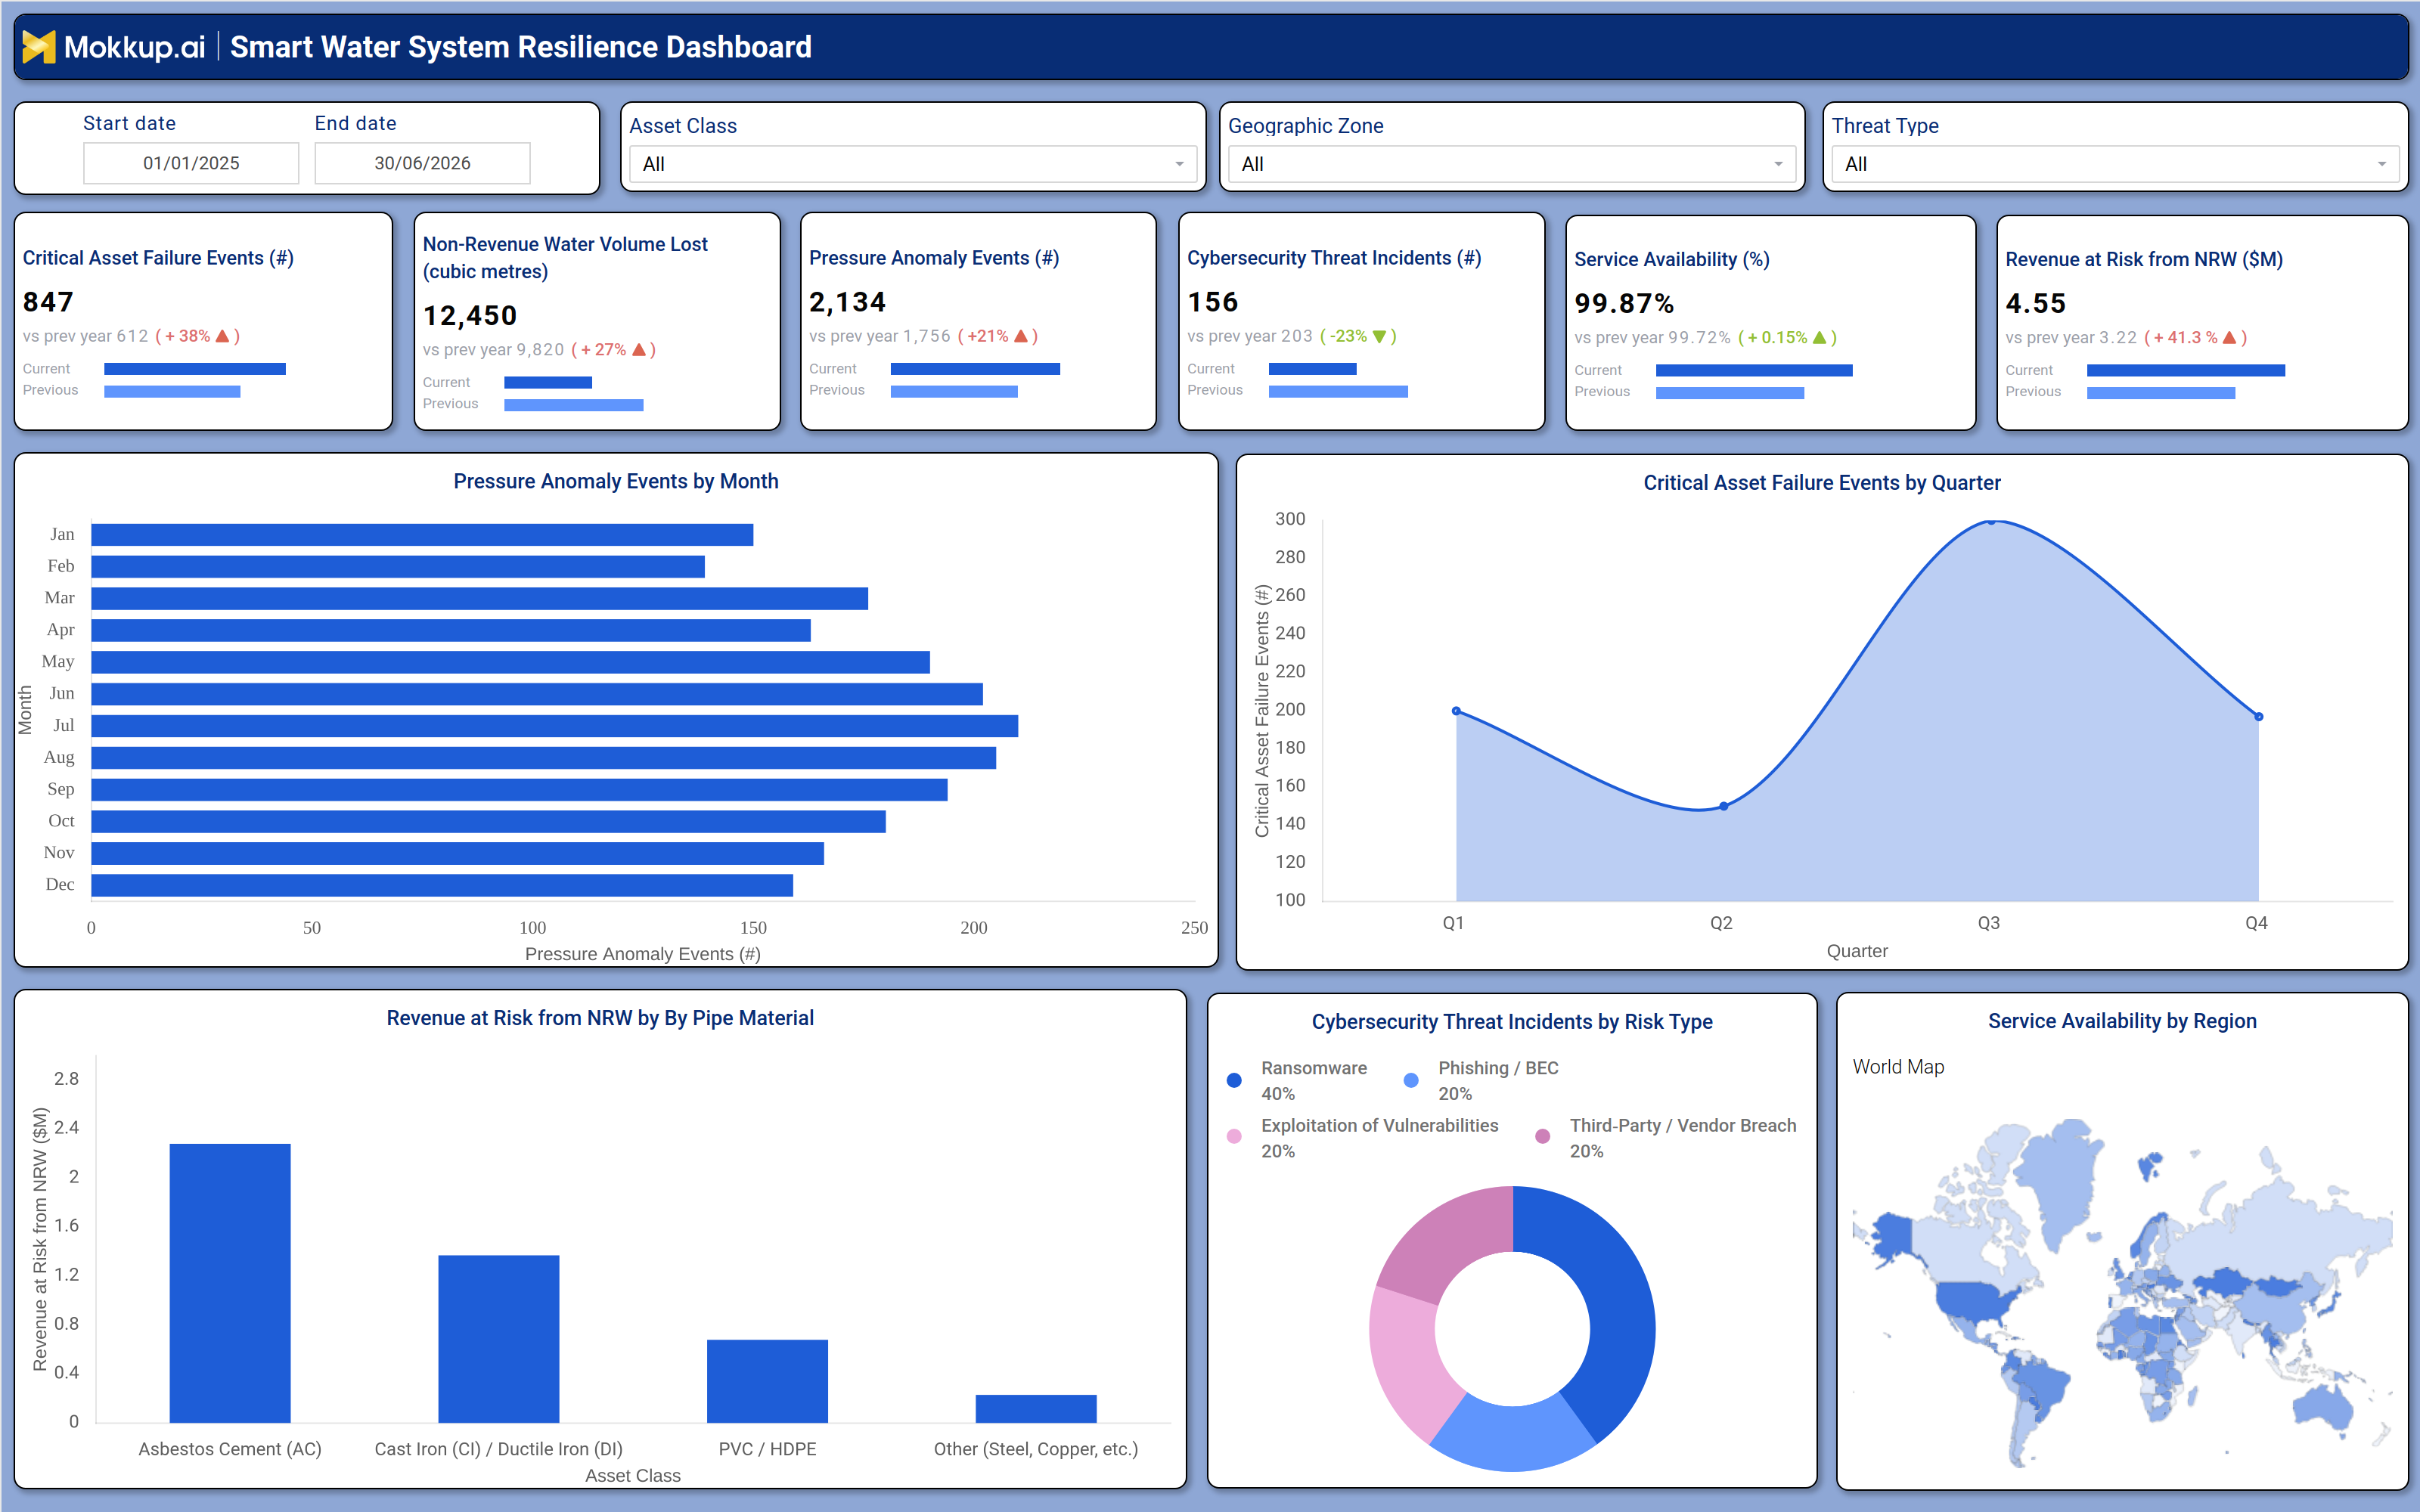
A Smart Water System Resilience Dashboard is a centralized analytics tool that helps water utilities monitor the operational integrity, security posture, and financial performance of their distribution networks. Water operations teams use it to track critical asset failure events, pressure anomaly patterns, non-revenue water (NRW) losses, cybersecurity threat incidents, and service availability across geographic zones, all in one place. By bringing these metrics together, the dashboard gives infrastructure managers a single source of truth for assessing water network resilience. Utilities dealing with aging pipe infrastructure or rising cybersecurity threats use smart water infrastructure monitoring to stay ahead of failures before they cascade into service outages or regulatory violations. The dashboard supports date range filtering, asset class segmentation, and zone-level breakdowns, making it adaptable to both daily operational reviews and quarterly strategic reporting.
How to Create a Smart Water System Resilience Dashboard
You don’t need to build your report from scratch; just start with a ready-to-use dashboard template from Mokkup. Add in your data and export it however you like. Here’s how to do it:
1. Create or Log in to Your Mokkup Account
Start by signing up on Mokkup.ai using your email. If you already have an account, just log in, and you'll be good to go.
2. Choose and Customize Your Dashboard Template
Find the Smart Water System Resilience Dashboard template in the Templates section. Use the drag-and-drop editor to adjust KPIs, edit filters, or add elements based on your data.
3. Export to Your BI Tool
Once your dashboard wireframe is ready, use the BI Tool Export feature to send it directly to Power BI or Tableau for further analysis and enhancements. You can also download the dashboard as a PDF, PNG, or JPEG, embed it on a platform, or invite your team to collaborate.
Note: This is a Pro template. You'll need a Pro subscription on Mokkup to use and customize this dashboard wireframe. Upgrade anytime to unlock full access.
Smart Water System Resilience Dashboard Example
A regional water authority opens the dashboard at the start of each month and applies filters for the relevant asset class and geographic zone. The operations team reviews Critical Asset Failure Events and Pressure Anomaly Events to identify which parts of the network showed stress in the previous period. When pressure anomaly tracking for water utilities reveals a spike in a specific month, particularly during seasonal peak demand, engineers schedule targeted field inspections rather than relying on reactive maintenance calls. The finance team then turns to the Non-Revenue Water Volume Lost and Revenue at Risk from NRW metrics. By examining the Revenue at Risk from NRW by Pipe Material chart, procurement managers prioritize pipe replacement budgets toward Asbestos Cement and Cast Iron segments, where financial exposure is highest. This process of water loss reduction through NRW data analysis lets utilities shift spending from emergency repairs to planned capital upgrades, improving cost predictability.
The cybersecurity team reviews the Cybersecurity Threat Incidents by Risk Type donut chart, which breaks down incidents across Ransomware, Phishing/BEC, Exploitation of Vulnerabilities, and Third-Party/Vendor Breach categories. With water utility cybersecurity threat management becoming a compliance requirement in many jurisdictions, the team uses this view to assess where security investments need to be directed and to prepare incident response summaries for regulatory reporting. Finally, leadership checks the Service Availability by Region map to ensure that operational uptime remains at target levels across all zones. A drop in availability in a particular region triggers an escalation workflow, and the Critical Asset Failure Events by Quarter trend chart helps leadership assess whether the decline is an isolated event or part of a broader deterioration pattern. This end-to-end review cycle, from field assets to cyber threats to financial exposure, is what makes the dashboard indispensable for utilities that manage distributed water infrastructure resilience.
How to Analyze Data in a Smart Water System Resilience Dashboard
Here is how you can analyze data from this dashboard:
- Filter by Start and End date to scope analysis to a specific reporting period
- Use Asset Class and Geographic Zone filters to isolate performance by network segment
- Compare Pressure Anomaly Events by Month to identify seasonal demand-driven stress points
- Track Critical Asset Failure Events by Quarter to detect deterioration trends across the year
- Use the Revenue at Risk from NRW by Pipe Material chart to rank pipe types by financial exposure
- Review Cybersecurity Threat Incidents by Risk Type to understand the threat distribution across attack vectors
- Monitor the Service Availability by Region map to flag underperforming zones
- Cross reference KPI cards with Threat Type filters to assess whether specific threat categories correlate with service disruptions
Benefits of a Smart Water System Resilience Dashboard
The following are the benefits of using this Smart Water Infrastructure Monitoring dashboard:
- Consolidates asset, financial, and cybersecurity metrics into a single operational view
- Supports proactive water network resilience management by surfacing anomaly patterns early
- Reduces NRW-related revenue loss through data-driven pipe material prioritization
- Improves pressure anomaly tracking for water utilities with monthly granularity
- Strengthens water utility cybersecurity threat management with attack-type breakdown visibility
- Enables service availability benchmarking across geographic zones
- Accelerates regulatory reporting with structured KPI summaries
- Supports both operational teams and executive leadership with a shared dashboard view
KPIs to Track in a Smart Water System Resilience Dashboard
The following key water network resilience management KPIs can be tracked by using this dashboard:
- Critical Asset Failure Events (#): Count of failures recorded on critical infrastructure assets within the selected period; used to assess distributed water infrastructure resilience
- Non-Revenue Water Volume Lost (cubic metres): Total volume of treated water that does not generate revenue due to leaks, theft, or metering errors; central to water loss reduction through NRW data analysis
- Pressure Anomaly Events (#): Number of pressure deviations detected across the network; supports pressure anomaly tracking for water utilities to preempt pipe bursts
- Cybersecurity Threat Incidents (#): Total security incidents recorded across all threat categories; key metric in water utility cybersecurity threat management
- Service Availability (%): Percentage of time the water supply system operates without interruption; reflects overall smart water infrastructure monitoring performance
- Revenue at Risk from NRW ($M): Estimated financial exposure from non-revenue water loss; links water network resilience management directly to financial impact
Frequently Asked Questions
1. What types of threats does the Cybersecurity Threat Incidents by Risk Type chart cover?
The chart breaks down incidents into four categories: Ransomware, Phishing/BEC, Exploitation of Vulnerabilities, and Third Party/Vendor Breach. This breakdown supports water utility cybersecurity threat management by showing which attack vectors demand the most attention.
2. How does the dashboard support non-revenue water reduction efforts?
The Revenue at Risk from NRW by Pipe Material chart identifies which asset types contribute most to financial losses from water loss, enabling targeted capital investment. Teams use this alongside the NRW Volume Lost KPI to build the case for pipe rehabilitation programs.
3. Can the dashboard be filtered by geographic zone and asset class simultaneously?
Yes the dashboard includes independent filters for Asset Class, Geographic Zone, and Threat Type that can be applied together. This lets regional managers run focused smart water infrastructure monitoring reviews without being distracted by data from other zones.