
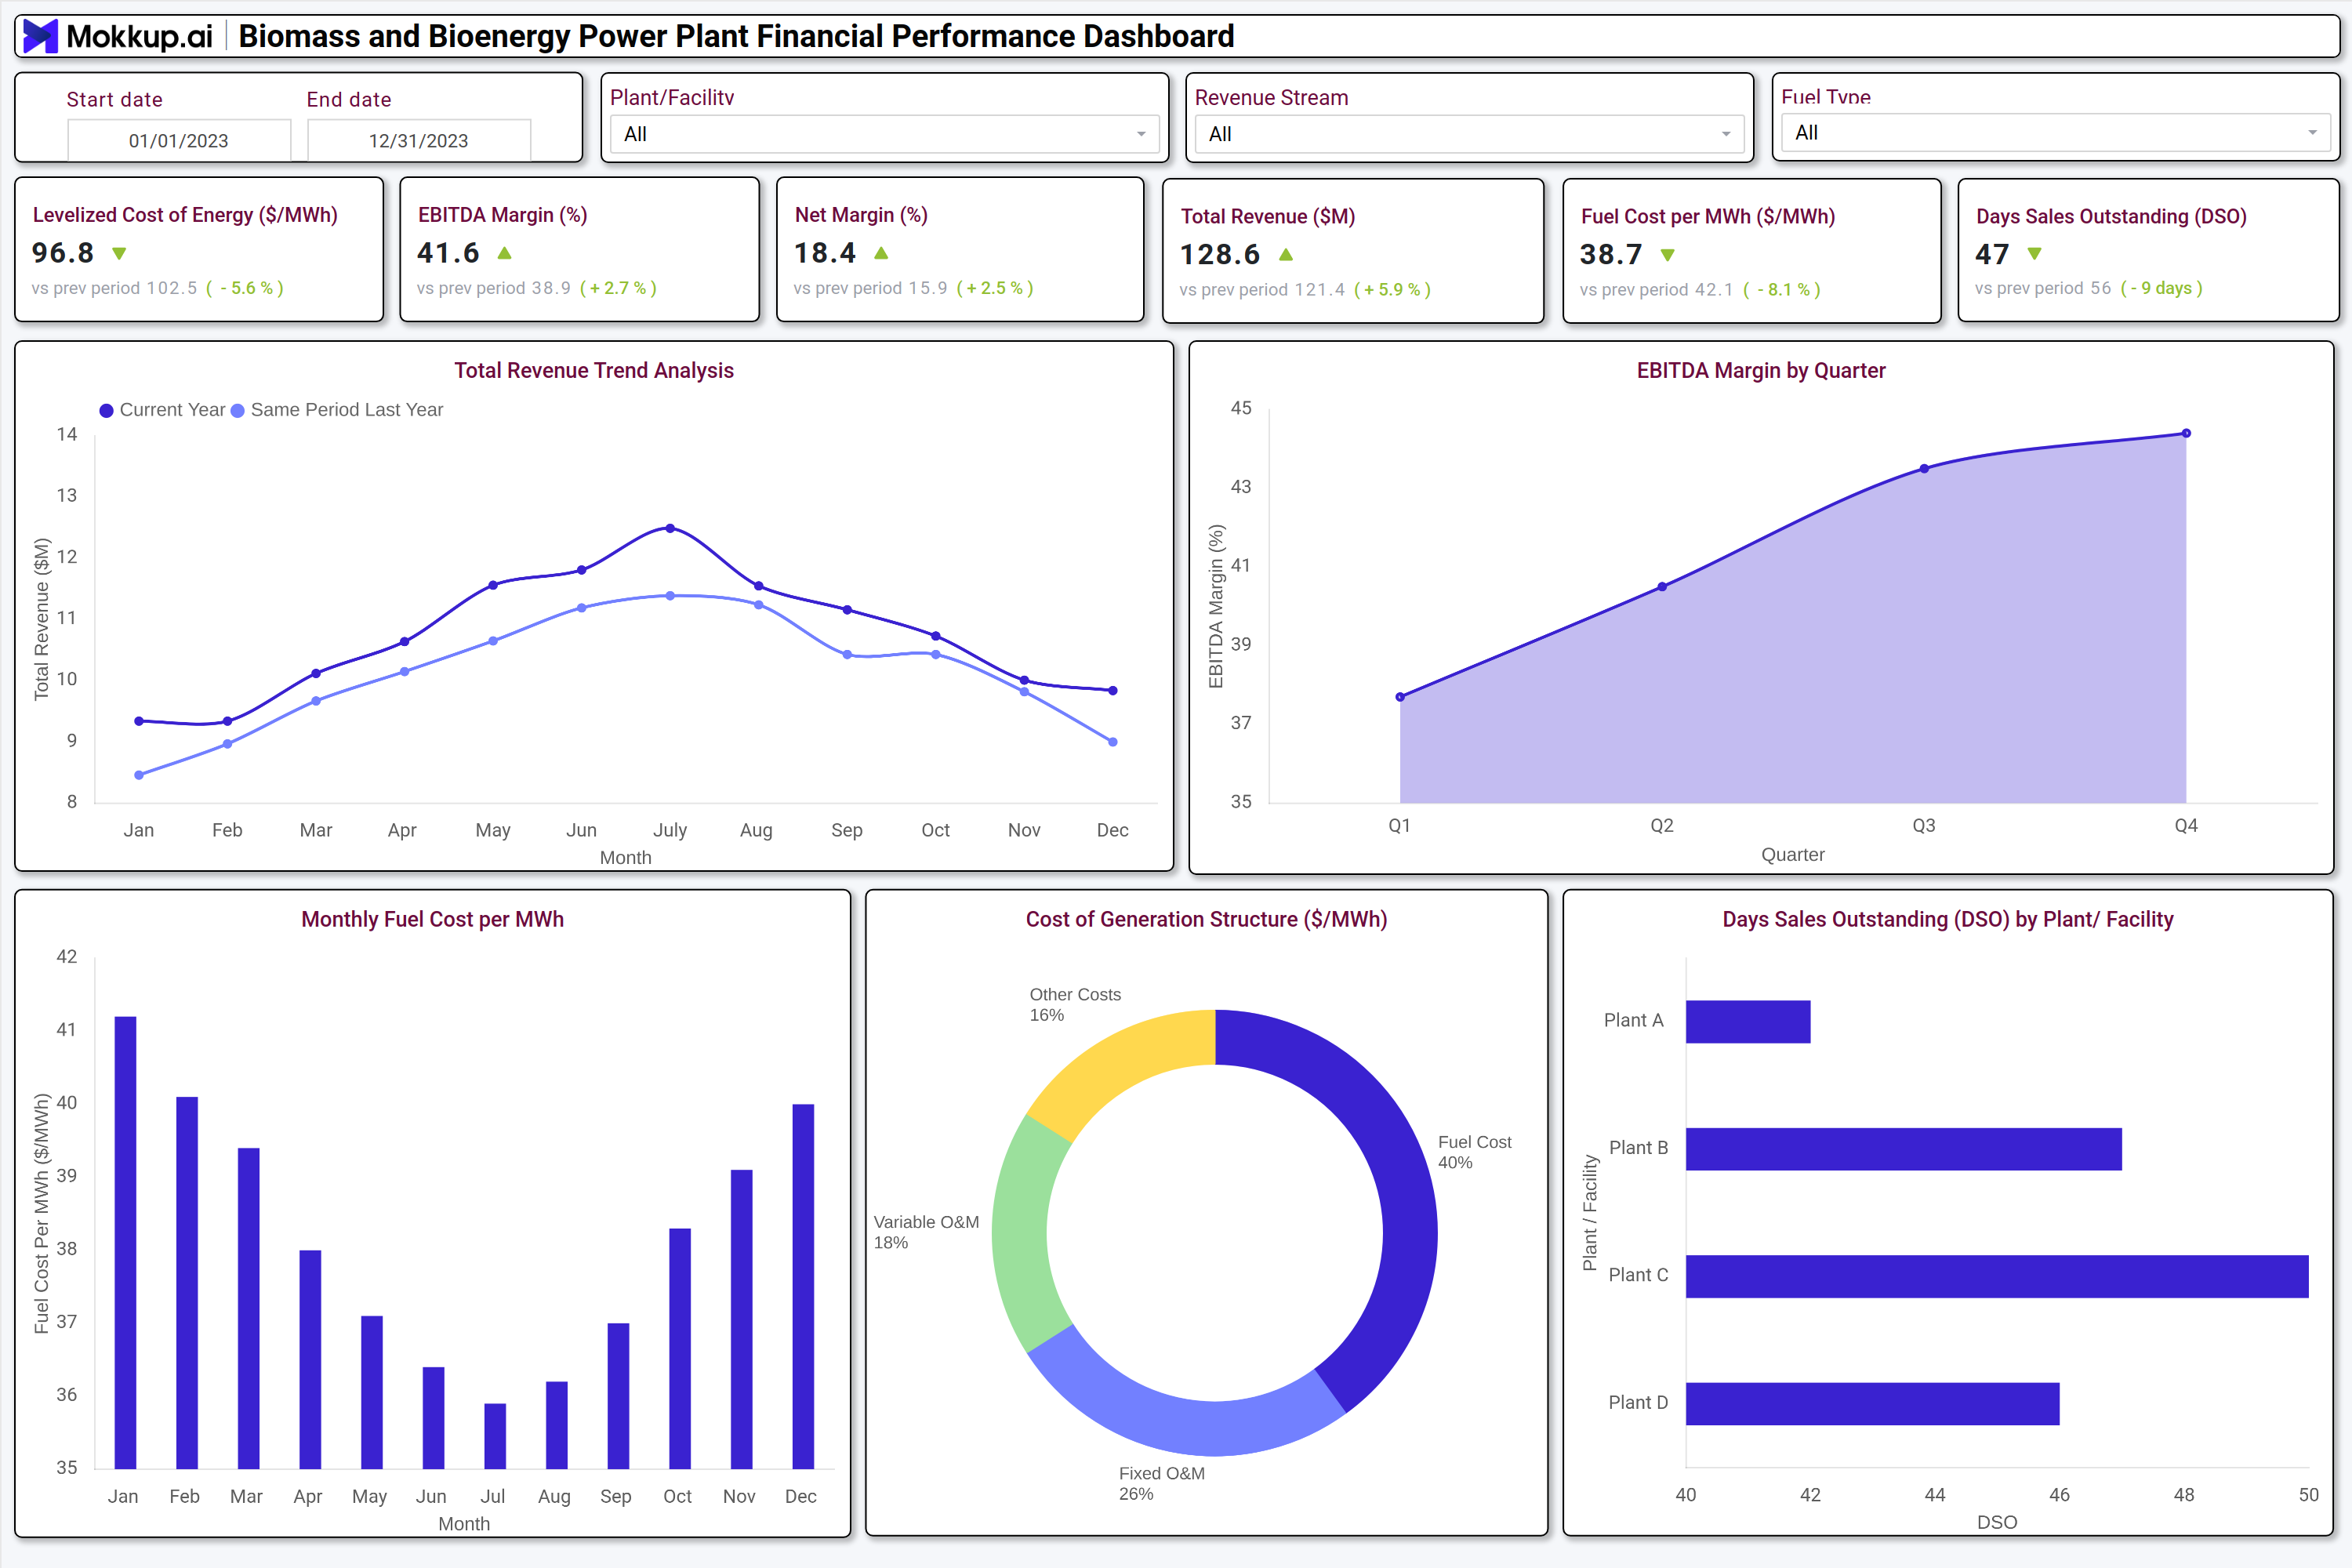
What is a Biomass and Bioenergy Power Plant Financial Performance Dashboard ?
A Biomass and Bioenergy Power Plant Financial Performance Dashboard is a finance-focused analytics platform used by electric power utilities to monitor financial performance across biomass and bioenergy assets. It consolidates revenue metrics, cost of generation components, fuel expenses, and profitability indicators into a single view. The dashboard enables finance leaders to track EBITDA margins, net margins, levelized cost of energy, and operating costs per MWh while maintaining visibility into working capital metrics such as Days Sales Outstanding. By integrating plant-level, fuel-type, and revenue-stream data, the dashboard supports accurate financial reporting, margin analysis, and cost optimization for biomass power generation operations.
How to Create a Biomass and Bioenergy Power Plant Financial Performance Dashboard
You don’t need to build your report from scratch, just start with a ready to use dashboard template from Mokkup. Add in your data and export it however you like. Here’s how to do it:
1. Create or Log in to Your Mokkup Account
Start by signing up on Mokkup.ai using your email. If you already have an account, just log in, and you’ll be good to go.
2. Choose and Customize Your Dashboard Template
Find the Biomass and Bioenergy Power Plant Financial Performance Dashboard template in the Templates section. Use the drag-and-drop editor to adjust KPIs, edit filters, or add elements based on your data.
3. Export to Your BI Tool
Once your dashboard wireframe is ready, use the BI Tool Export feature to send it directly to Power BI or Tableau for further analysis and enhancements. You can also download the dashboard as a PDF, PNG, or JPEG, embed it on a platform, or invite your team to collaborate.
Note: This is a Pro template. You’ll need a Pro subscription on Mokkup to use and customize this dashboard wireframe. Upgrade anytime to unlock full access.
Biomass and Bioenergy Power Plant Financial Performance Dashboard Example
A typical biomass power plant revenue analysis dashboard presents high-level KPIs at the top, including total revenue, EBITDA margin, net margin, fuel cost per MWh, and levelized cost of energy, forming the foundation for bioenergy power plant cost of generation analytics. Time-based filters allow finance teams to analyze performance across months, quarters, or fiscal years, while plant and fuel-type filters support asset-level comparisons. Revenue trend charts highlight seasonal generation and pricing impacts, while EBITDA margin by quarter reveals profitability progression. Cost visualization breaks down fixed O&M, variable O&M, fuel cost, and other generation expenses to expose key cost drivers. Supporting charts such as monthly fuel cost per MWh and Days Sales Outstanding by plant help utilities assess cost volatility, cash collection efficiency, and overall cost of generation performance across biomass and bioenergy facilities.
How to Analyze Data in a Biomass and Bioenergy Power Plant Financial Performance Dashboard
Here is how you can analyze data from this bioenergy power generation financial performance dashboard:
- Compare total revenue trends against prior periods to identify seasonality, dispatch changes, or tariff impacts.
- Track EBITDA margin and net margin movement to assess operational efficiency and cost discipline.
- Analyze fuel cost per MWh trends to understand biomass feedstock price volatility and sourcing efficiency.
- Review the levelized cost of energy to benchmark generation competitiveness across plants.
- Examine the cost of the generation structure to identify high-impact cost components such as fuel or variable O&M.
- Monitor Days Sales Outstanding to evaluate billing efficiency and working capital exposure.
- Use plant-level and fuel-type filters to isolate underperforming assets and margin leakage.
Benefits of a Biomass and Bioenergy Power Plant Financial Performance Dashboard
The following are the benefits of using this bioenergy power plant margin and EBITDA tracking dashboard:
- Improves financial visibility across biomass and bioenergy power generation assets.
- Enables early identification of rising fuel and operating costs.
- Supports EBITDA margin optimization through cost-driver analysis.
- Enhances capital allocation and budgeting decisions for utility finance teams.
- Strengthens working capital management through DSO monitoring.
- Provides a single source of truth for revenue and profitability reporting.
- Aligns finance, operations, and leadership teams on financial performance metrics.
KPIs to Track in a Biomass and Bioenergy Power Plant Financial Performance Dashboard
The following key KPIs can be tracked by using this biomass power plant profitability monitoring dashboard:
- Total Revenue ($M): Measures income generated from biomass and bioenergy power sales.
- EBITDA Margin: Indicates operational profitability before financing and depreciation impacts.
- Net Margin: Reflects overall profitability after all expenses.
- Levelized Cost of Energy ($/MWh): Shows average generation cost over the plant lifecycle.
- Fuel Cost per MWh ($/MWh): Tracks biomass feedstock cost efficiency.
- Days Sales Outstanding (DSO): Assesses revenue collection speed and cash flow health.
Frequently Asked Questions
1. How does this dashboard help improve profitability?
By identifying cost drivers, monitoring EBITDA margins, and highlighting inefficiencies in fuel and operations.
2. Who typically uses this bioenergy power generation financial reporting dashboard in a utility organization?
VPs of Finance, CFOs, FP&A teams, and senior leaders.
3. Can this dashboard support multi-plant analysis?
Yes, it enables plant-level comparisons across facilities, fuel types, and revenue streams.