
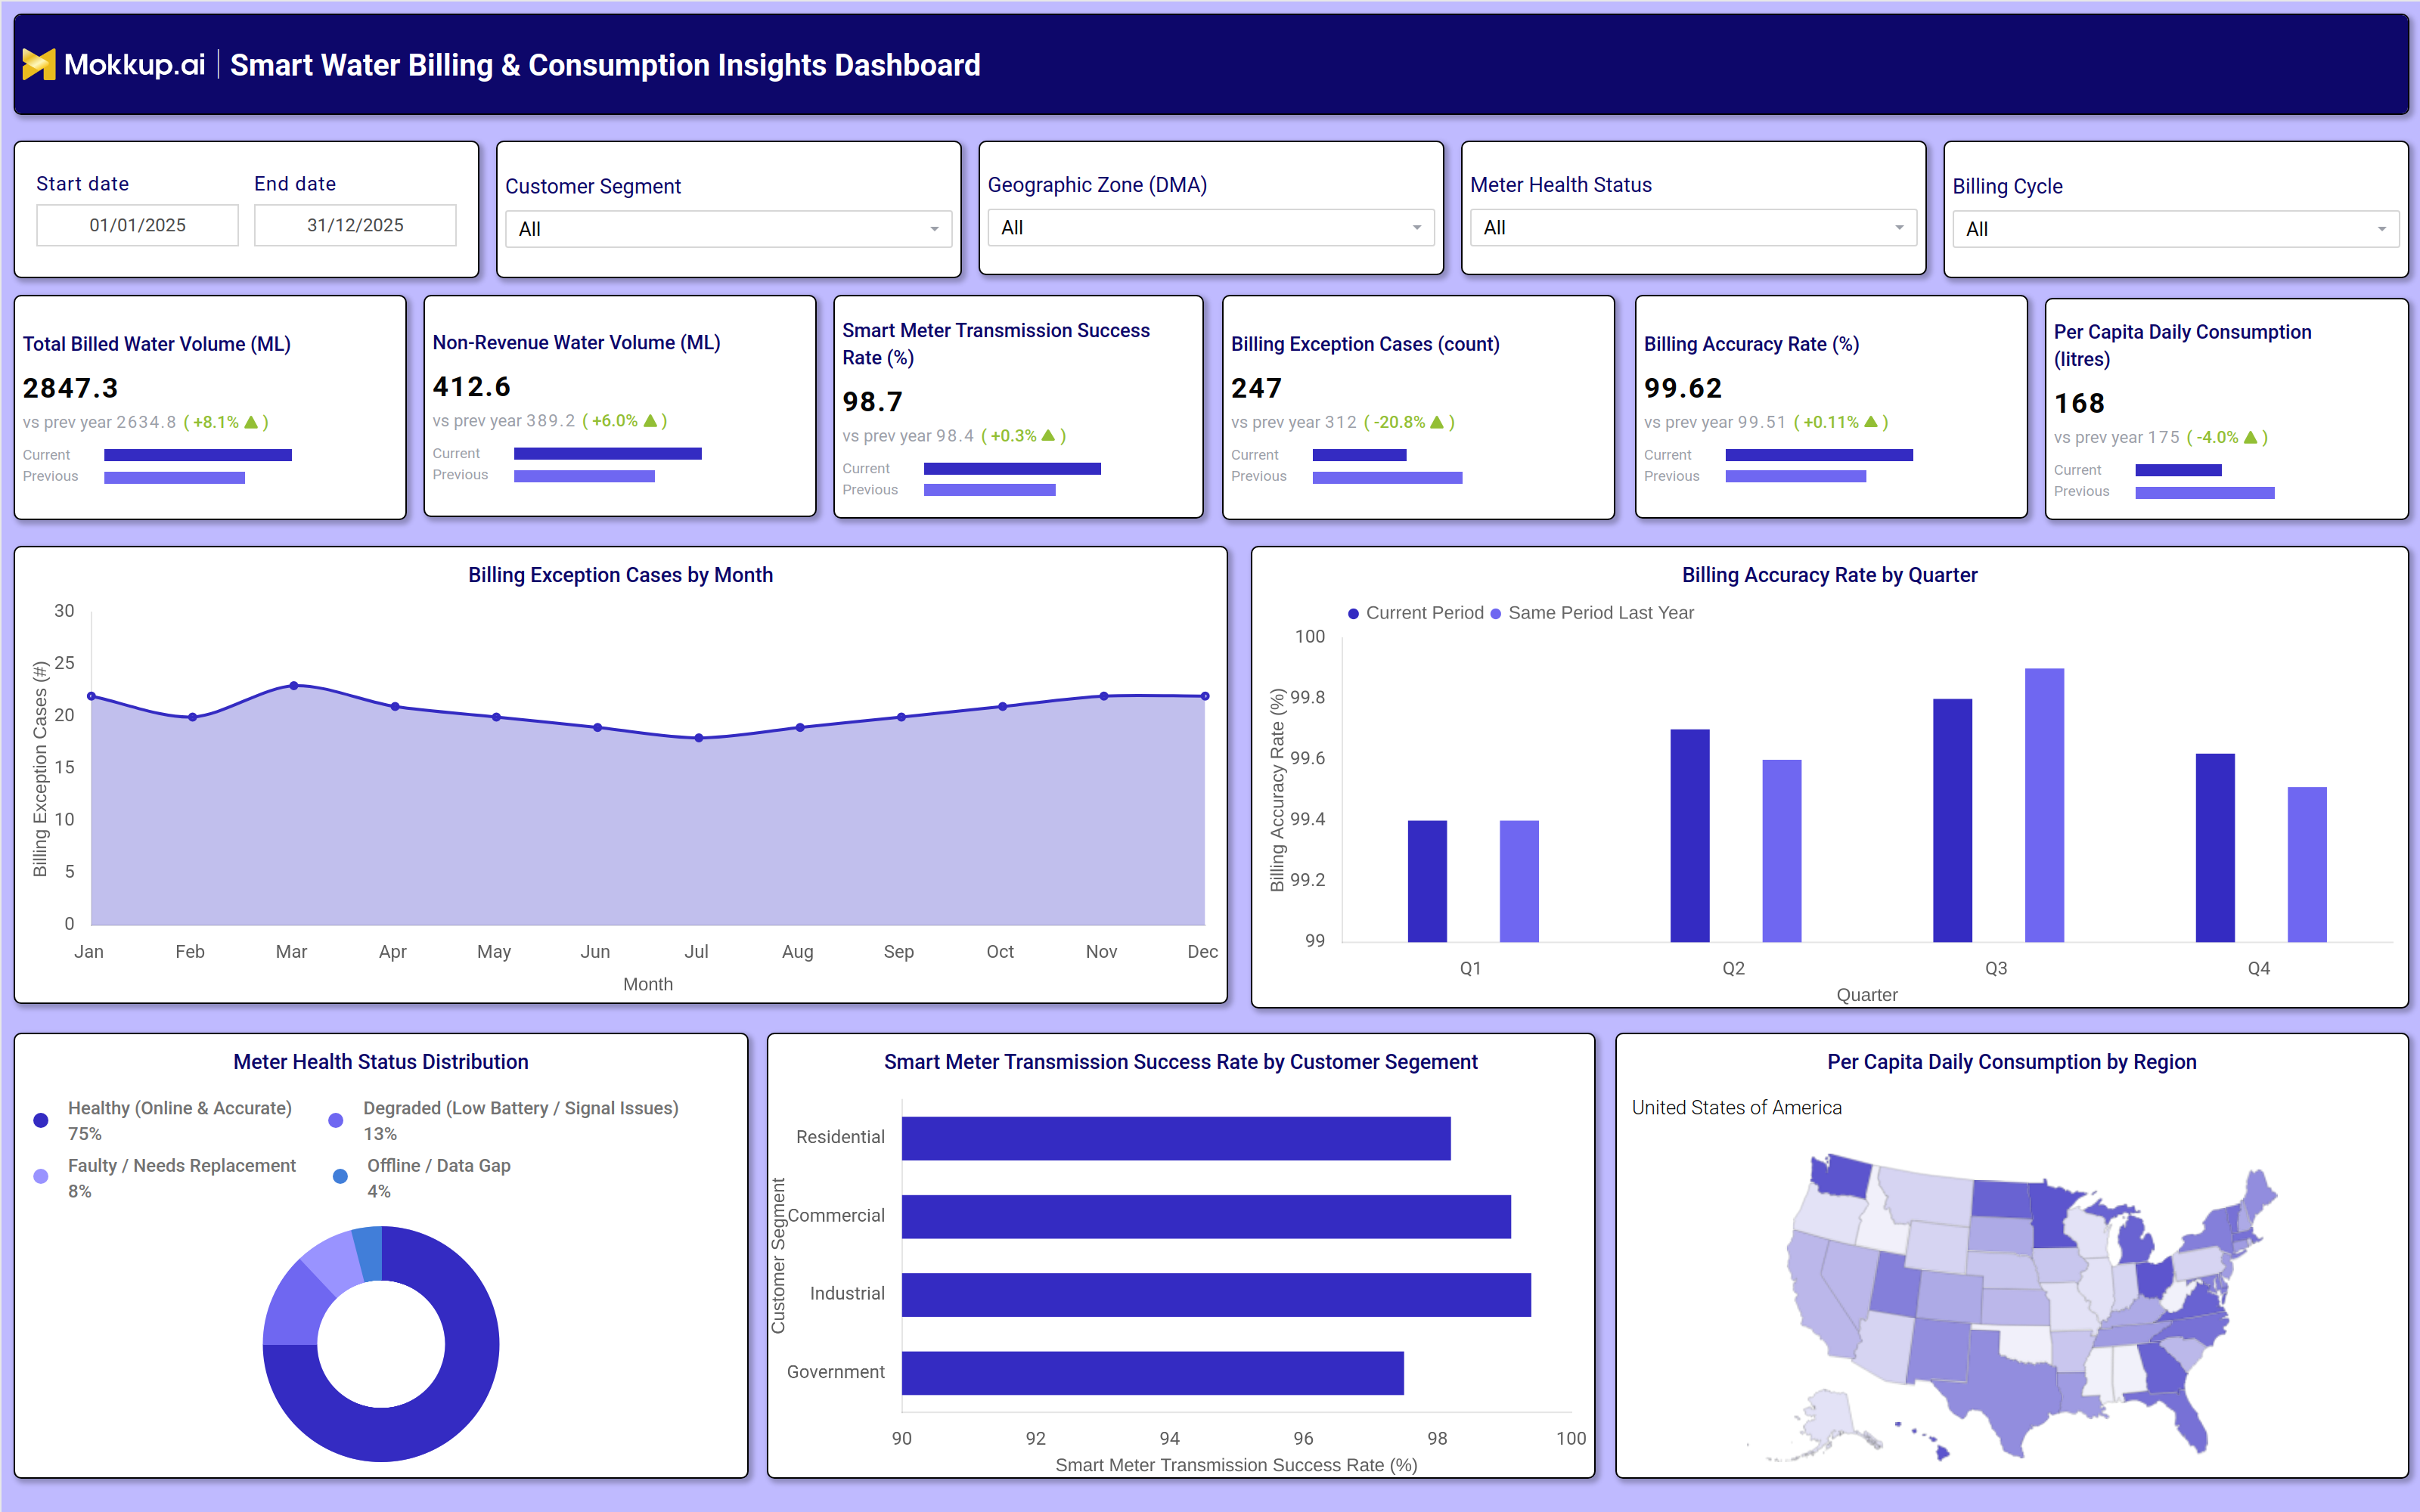
What is a Smart Water Billing & Consumption Insights Dashboard?
The Smart Water Billing & Consumption Insights Dashboard is a smart water billing dashboard template built for utility finance and operations teams who need a single view of metering, billing, and consumption performance. It brings together billed water volume, non-revenue water, and smart meter transmission health, so billing managers do not have to pull data from multiple systems.
Because the layout ties billing exceptions, accuracy rates, and consumption patterns to customer segment and geographic zone, it works as a practical non-revenue water tracking dashboard for utilities managing large metered networks. Filters for date range, customer segment, geographic zone (DMA), meter health status, and billing cycle let teams narrow the view to the exact slice of the customer base or region they are reviewing, whether that is a full-year audit or a single billing cycle.
How to Create a Smart Water Billing & Consumption Insights Dashboard
You don't need to build your dashboard from scratch; just start with a ready-to-use Dashboard template from Mokkup. Customize it with your data and export it with ease. Here's how:
1. Create or Log in to Your Mokkup Account
Start by signing up on Mokkup.ai using your email. If you already have an account, just log in, and you'll be good to go.
2. Choose and Customize Your Dashboard Template
Find the Smart Water Billing & Consumption Insights Dashboard template in the Templates section. Use the drag-and-drop editor to adjust KPIs, edit filters, or add elements based on your data.
3. Export to Your BI Tool
Once your dashboard wireframe is ready, use the BI Tool Export feature to send it directly to Power BI or Tableau for further analysis and enhancements. You can also download the dashboard as a PDF, PNG, or JPEG, embed it on a platform, or invite your team to collaborate.
Note: This is a Pro template. You'll need a Pro subscription on Mokkup to use and customize this dashboard wireframe. Upgrade anytime to unlock full access.
Smart Water Billing & Consumption Insights Dashboard Example
A billing operations manager at a water utility opens this dashboard at the start of a billing cycle to check whether metering and billing are tracking cleanly before invoices go out. The first question is usually whether smart meter transmission success rate monitoring shows any segment or zone falling behind, since a drop in transmission reliability often signals meters that need a truck roll before the billing run closes. From there, the manager reviews how billing exception cases are trending month over month to catch whether a spike is isolated or a persistent issue tied to a particular meter health status.
Analysts can compare billing accuracy rate across quarters to confirm the utility is holding its target consistently rather than drifting downward, and they can apply smart meter transmission success rate monitoring by customer segment to see if residential, commercial, industrial, or government accounts need different servicing priorities. When per capita consumption in a region moves outside its normal range, planners can run a per capita water consumption analysis to trace it back to specific zones on the map view and decide whether it reflects seasonal demand, a leak, or a metering gap. Used this way, the dashboard helps utility teams close billing cycles with fewer disputes, catch meter health problems before they affect revenue, and keep water utility billing exception tracking proactive rather than reactive.
How to Analyze Data in a Smart Water Billing & Consumption Insights Dashboard
Here is how you can analyze data from this dashboard:
- Use this smart water billing dashboard template to filter by date range and billing cycle to isolate a specific invoicing period before reviewing exceptions.
- Segment by customer segment to compare billing performance across residential, commercial, industrial, and government accounts.
- Narrow by geographic zone (DMA) to identify regions driving non-revenue water losses.
- Filter by meter health status to isolate degraded, faulty, or offline meters before they affect billing accuracy.
- Track the Billing Exception Cases by Month trend to spot seasonal spikes or recurring issues.
- Compare Billing Accuracy Rate by Quarter against the same period last year to confirm improvement.
- Review the Meter Health Status Distribution donut chart to gauge what share of the meter fleet needs replacement or servicing.
- Cross-check Smart Meter Transmission Success Rate by Customer Segment to prioritize field maintenance.
- Use the Per Capita Daily Consumption by Region map to flag zones with abnormal usage patterns.
Benefits of a Smart Water Billing & Consumption Insights Dashboard
The following are the benefits of using this dashboard:
- Centralizes billed volume, non-revenue water, and meter health metrics in one billing accuracy rate tracking utility view.
- Functions as a non-revenue water tracking dashboard that flags degraded or offline meters early, before they distort billing accuracy.
- Reduces time spent reconciling billing exceptions across spreadsheets and legacy systems.
- Supports segment-level analysis so field teams can prioritize maintenance by customer type.
- Gives finance and operations a shared view of consumption trends ahead of rate reviews.
- Speeds up audit prep with filters for billing cycle, date range, and geographic zone.
- Improves customer trust by lowering unresolved billing exception counts.
KPIs to Track in a Smart Water Billing & Consumption Insights Dashboard
The following key KPIs can be tracked by using this dashboard:
- Total Billed Water Volume (ML): the total metered water volume billed to customers over the selected period.
- Non-Revenue Water Volume (ML): water that is produced but not billed, due to leaks, theft, or metering inaccuracies.
- Smart Meter Transmission Success Rate (%): the share of smart meters successfully transmitting readings on schedule.
- Billing Exception Cases (count): the count of invoices flagged for review due to unusual readings, disputes, or system errors.
- Billing Accuracy Rate (%): the core metric for billing accuracy rate tracking utility performance, measuring how closely invoiced amounts match actual metered consumption.
- Per Capita Daily Consumption (litres): supports per capita water consumption analysis by tracking average daily usage per resident.
Frequently Asked Questions
1. What does the Smart Water Billing & Consumption Insights Dashboard track?
It tracks billed water volume, non-revenue water, smart meter transmission performance, billing accuracy, exception cases, and per capita consumption. Filters let you view these metrics by customer segment, geographic zone, meter health status, and billing cycle.
2. How does this dashboard help reduce non-revenue water?
By breaking down non-revenue water volume alongside meter health status and geographic zone, it helps utilities pinpoint where losses are concentrated. Teams can then prioritize meter replacement or leak investigation in the zones driving the highest losses.
3. Can I customize this template for water utility billing exception tracking?
Yes, the template is fully editable in Mokkup.ai's drag-and-drop editor, so you can adjust KPIs, filters, and chart layouts to match your own water utility billing exception tracking workflow. Once customized, it can be exported to Power BI, Tableau, or downloaded as PDF, PNG, or JPEG.