
What is a Stormwater Utility Customer Complaints & Requests Dashboard?
The Stormwater Utility Customer Complaints & Requests Dashboard is a structured reporting tool designed for stormwater utility operations teams to monitor, manage, and resolve customer-reported issues efficiently. It consolidates complaint intake data, resolution performance, SLA compliance, and service district metrics into a single, unified view. Utility managers who rely on stormwater utility customer complaint tracking dashboard tools can quickly assess whether complaint volumes are trending upward, which complaint categories are generating the most workload, and whether their teams are meeting resolution targets. The dashboard covers complaint types including flooding, drainage blockage, billing disputes, infrastructure damage, and illicit discharge. Filters for complaint category, complaint status, and service district allow teams to isolate specific segments of data without switching between systems. Built for stormwater operations, compliance officers, and customer service leaders, this dashboard provides the operational clarity needed to maintain service standards and identify systemic issues before they escalate.
How to Create a Stormwater Utility Customer Complaints & Requests Dashboard
You don't need to build your report from scratch, just start with a ready-to-use dashboard template from Mokkup. Add in your data and export it however you like. Here's how to do it:
1. Create or Log in to Your Mokkup Account
Start by signing up on Mokkup.ai using your email. If you already have an account, just log in, and you'll be good to go.
2. Choose and Customize Your Dashboard Template
Find the Stormwater Utility Customer Complaints & Requests Dashboard template in the Templates section. Use the drag-and-drop editor to adjust KPIs, edit filters, or add elements based on your data.
3. Export to Your BI Tool
Once your dashboard wireframe is ready, use the BI Tool Export feature to send it directly to Power BI or Tableau for further analysis and enhancements. You can also download the dashboard as a PDF, PNG, or JPEG, embed it on a platform, or invite your team to collaborate.
Note: This is a Pro template. You'll need a Pro subscription on Mokkup to use and customize this dashboard wireframe. Upgrade anytime to unlock full access.
Stormwater Utility Customer Complaints & Requests Dashboard Example
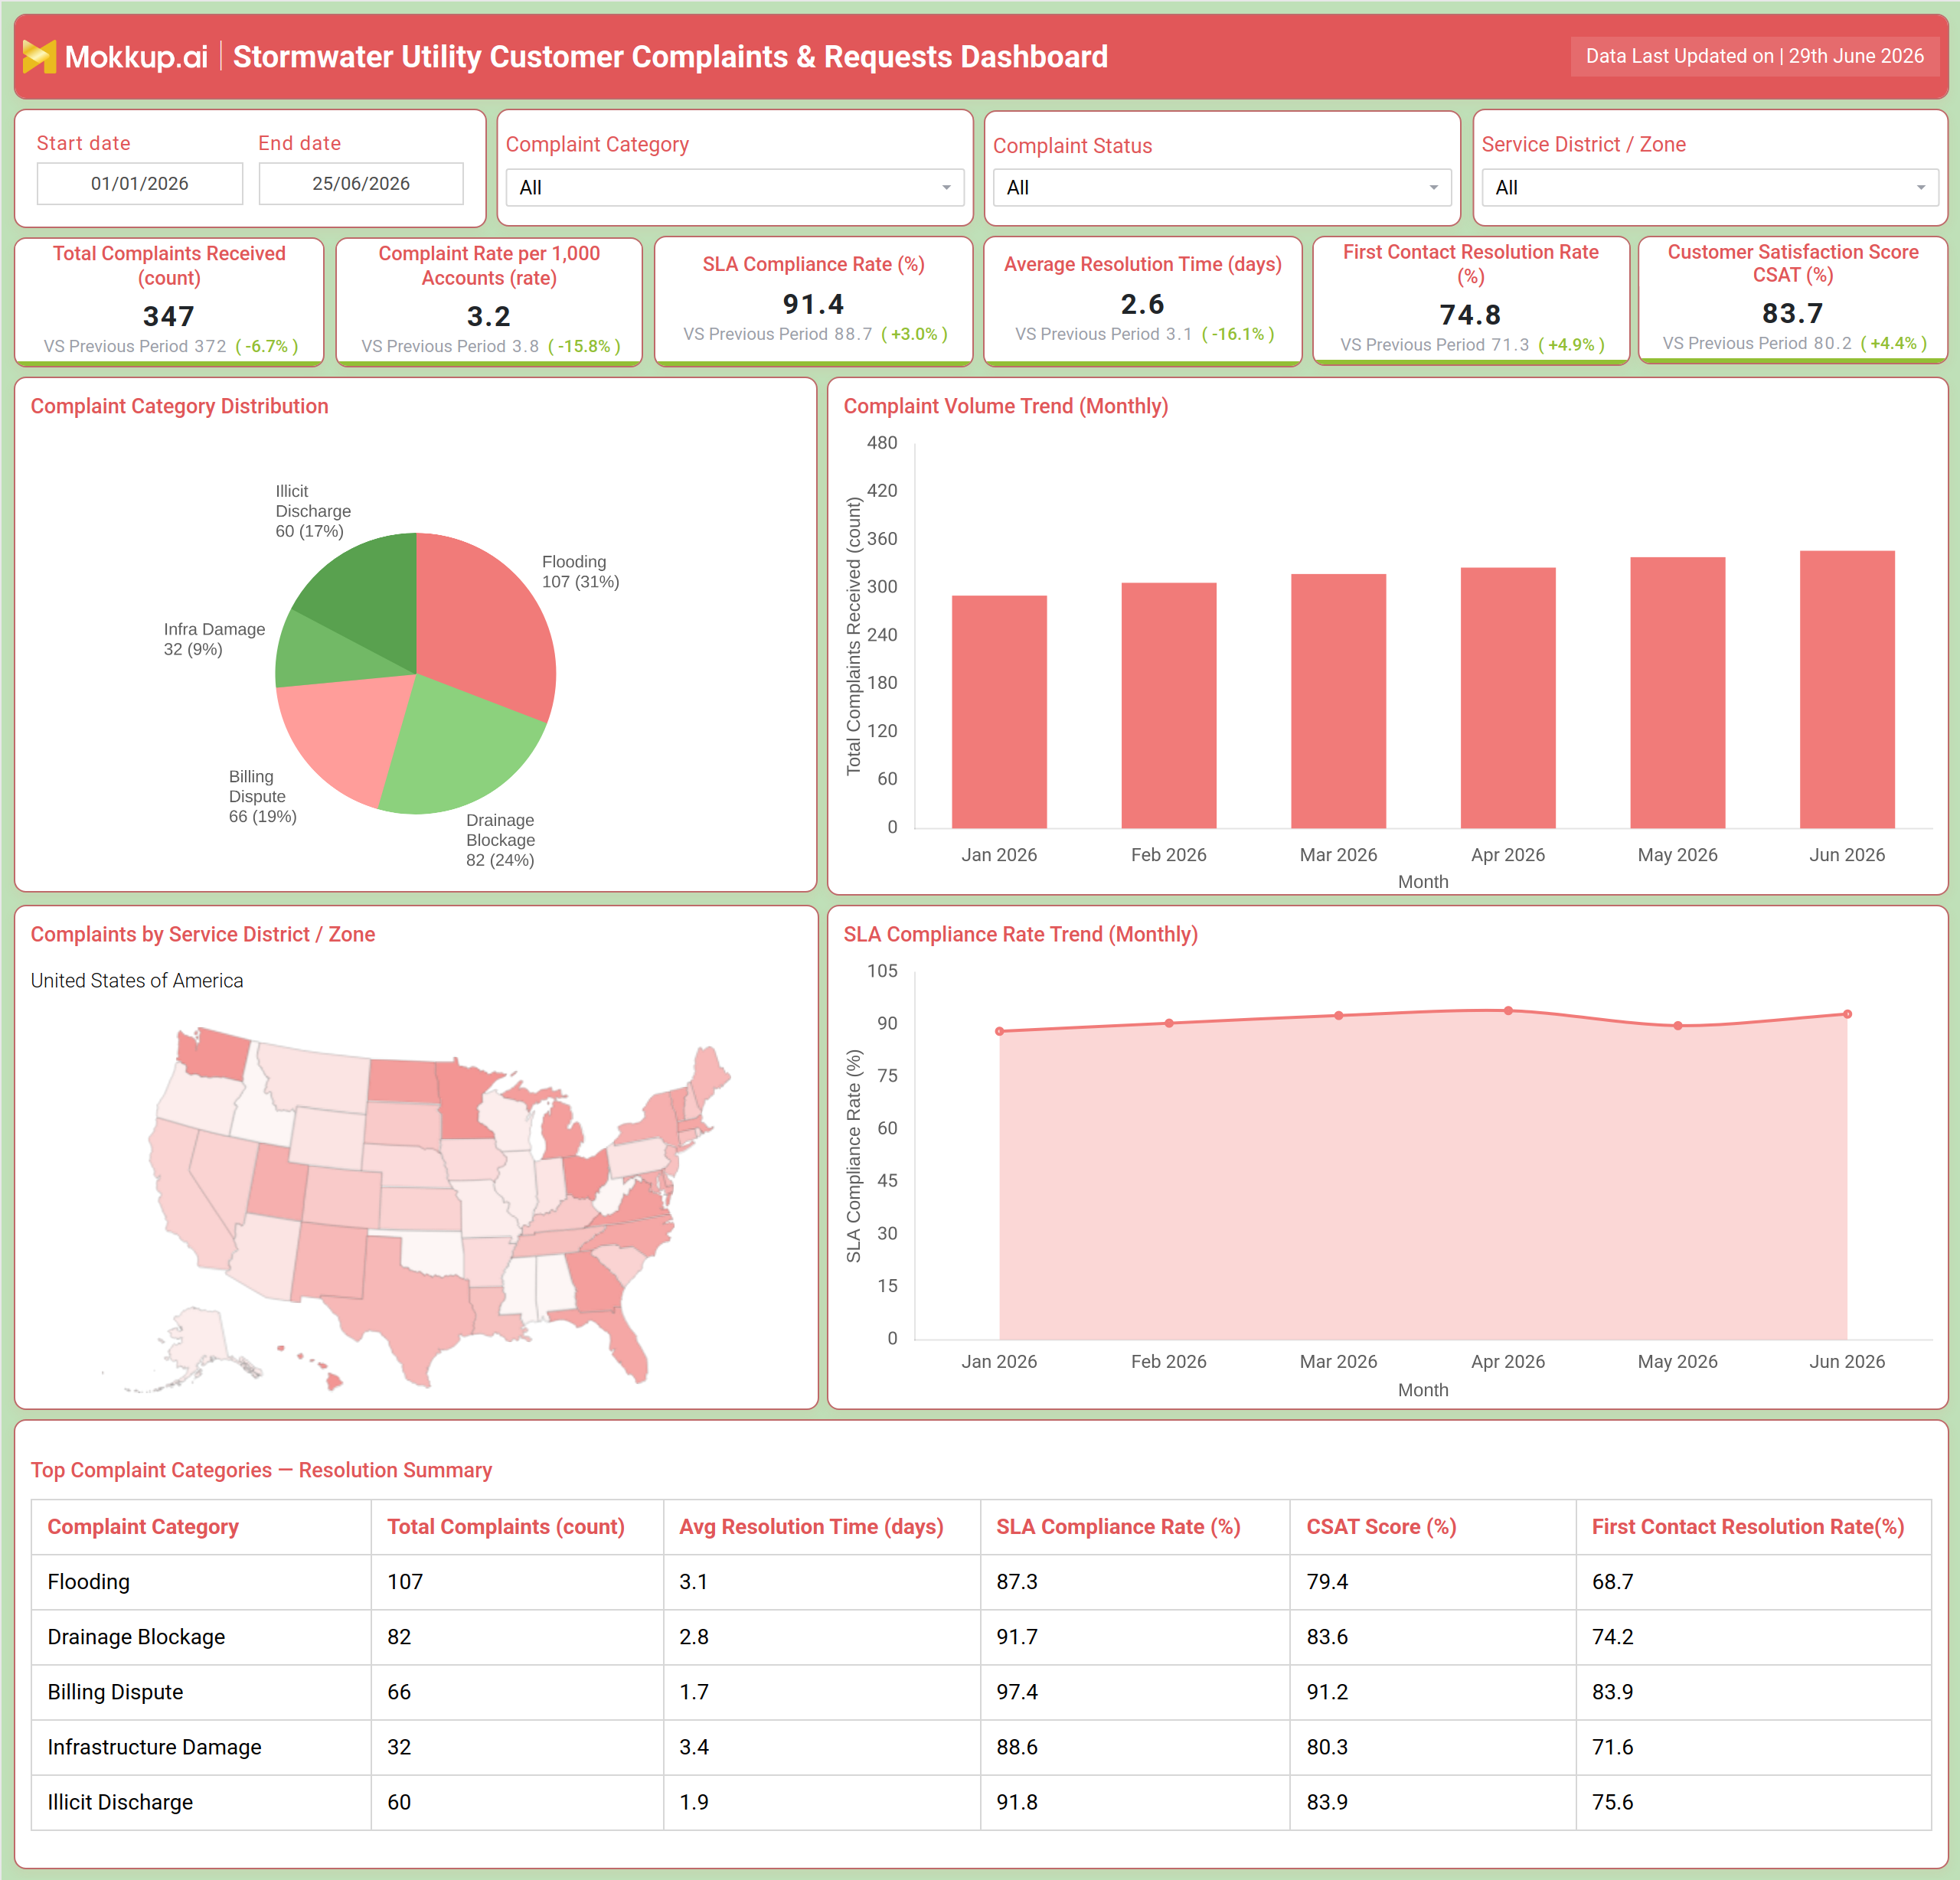
A stormwater operations manager opens this dashboard at the start of a reporting cycle to understand how complaints are distributed across service categories and whether the team's resolution pace is in line with service commitments. Rather than pulling separate reports for flooding calls, drainage issues, and billing disputes, the manager sees the full complaint landscape in one place. The stormwater utility customer complaint tracking dashboard makes it straightforward to spot which complaint category is generating the highest volume and where SLA compliance rate monitoring for water utilities is slipping relative to previous periods. As the manager reviews the data, attention moves to whether response times are within acceptable windows. The complaint volume trend chart makes seasonal patterns visible across months, helping planners anticipate capacity needs before complaint surges hit. The geographic map view reveals which service districts are generating disproportionate complaint volumes, allowing field supervisors to prioritize deployment and resource allocation by zone.
Teams can use complaint resolution time analysis and stormwater management workflows to identify categories where resolution is taking longer than benchmarks allow. In the resolution summary table, the manager compares performance across complaint types, assessing which categories have strong first-contact resolution rates in water utility metrics and which are generating repeat contacts. Categories with lower CSAT scores or higher average resolution times signal where process improvements or staff training are needed most. The SLA compliance rate trend line shows whether the utility's compliance posture is improving or declining month over month, giving leadership the context needed for operational decisions. The overall outcome is a data-informed operation where stormwater teams can track service district complaint volume trend analysis across multiple periods, isolate problem areas, and take corrective action with confidence. Customer satisfaction score tracking for stormwater utilities becomes a continuous discipline rather than a periodic audit.
How to Analyze Data in a Stormwater Utility Customer Complaints & Requests Dashboard
Here is how you can analyze data from this dashboard:
- Filter by Complaint Category to isolate flooding, drainage blockage, billing dispute, infrastructure damage, or illicit discharge complaints
- Use the Start Date and End Date filters to compare current performance against prior reporting periods
- Review the Complaint Volume Trend bar chart to identify monthly patterns and seasonal complaint spikes
- Analyze the Complaint Category Distribution pie chart to understand which issue types dominate the complaint mix
- Use the Service District / Zone map to pinpoint geographic areas with concentrated complaint activity
- Monitor the SLA Compliance Rate Trend line chart to track whether compliance is improving or declining over time
- Cross-reference the Resolution Summary table to compare resolution times, CSAT scores, and first contact resolution rates across complaint categories
- Apply the Complaint Status filter to separate open, resolved, and escalated cases for workload management
Benefits of a Stormwater Utility Customer Complaints & Requests Dashboard
The following are the benefits of using this dashboard:
- Centralizes complaint data from multiple categories into one structured view, reducing manual report compilation
- Enables service district-level accountability by mapping complaint volumes geographically
- Supports SLA compliance monitoring with monthly trend visibility and period-over-period comparisons
- Helps teams prioritize complaint categories with the highest resolution time or lowest customer satisfaction scores
- Improves first contact resolution performance by revealing which issue types generate repeat contacts
- Reduces escalations by identifying complaint volume spikes early through monthly trend charts
- Provides leadership with a clear operational picture without requiring access to multiple source systems
- Supports data-driven staffing and resource allocation decisions by service zone
KPIs to Track in a Stormwater Utility Customer Complaints & Requests Dashboard
The following key KPIs can be tracked by using this first contact resolution rate water utility dashboard:
- Total Complaints Received (Count): Measures total complaint intake volume within a defined period, indicating overall service demand
- Complaint Rate per 1,000 Accounts (Rate): Tracks the frequency of complaints relative to the customer base, useful for benchmarking across service areas
- SLA Compliance Rate (%): Measures the percentage of complaints resolved within defined service level agreement timelines
- Average Resolution Time (Days): Tracks how long it takes on average to close a complaint from intake to resolution
- First Contact Resolution Rate (%): Measures the share of complaints resolved in a single interaction without requiring follow-up contact
- Customer Satisfaction Score — CSAT (%): Captures customer feedback on their complaint resolution experience, reflecting perceived service quality
Frequently Asked Questions
1. What types of complaints does this dashboard cover?
The dashboard tracks five complaint categories: flooding, drainage blockage, billing dispute, infrastructure damage, and illicit discharge. Each category is analyzed separately across resolution time, SLA compliance, CSAT, and first contact resolution metrics.
2. Can I filter the dashboard by service district or geographic zone?
Yes. The Service District / Zone filter lets you isolate complaint data for specific regions. The geographic map visualization also shows complaint concentration by zone, supporting field-level analysis.
3. How does this dashboard support SLA compliance management?
The SLA Compliance Rate KPI tile shows the current compliance percentage, while the SLA Compliance Rate Trend chart tracks performance month over month. Together, they provide both a current status and directional trend for compliance monitoring.