What is a Compressed Natural Gas Distribution Financial Performance Dashboard?
A Compressed Natural Gas Distribution Financial Performance Dashboard is a business intelligence solution that monitors the financial health of CNG distribution operations. It consolidates revenue, operating expenses, procurement costs, pricing trends, EBITDA, and profitability metrics into a single analytical view. This dashboard helps CNG distributors, fuel station operators, and utility companies track financial performance across regions, stations, customer segments, and contract types. The dashboard supports strategic financial planning by providing visibility into cost drivers, revenue growth patterns, and margin performance. A compressed natural gas distribution financial performance dashboard also helps organizations identify operational inefficiencies, monitor procurement price fluctuations, and improve cost optimization strategies. Companies use this dashboard to evaluate station-level profitability, monitor regional cost efficiency, and improve decision-making using financial analytics. With integrated visualizations such as revenue trends, procurement cost analysis, operating cost breakdowns, and regional performance mapping, this dashboard becomes an important tool for improving financial sustainability in CNG distribution networks.
How to Create a Compressed Natural Gas Distribution Financial Performance Dashboard
You don't need to build your report from scratch, just start with a ready-to-use dashboard template from Mokkup. Add in your data and export it however you like. Here's how to do it:
1. Create or Log in to Your Mokkup Account
Start by signing up on Mokkup.ai using your email. If you already have an account, just log in, and you'll be good to go.
2. Choose and Customize Your Dashboard Template
Find the Compressed Natural Gas Distribution Financial Performance Dashboard template in the Templates section. Use the drag-and-drop editor to adjust KPIs, edit filters, or add elements based on your data.
3. Export to Your BI Tool
Once your dashboard wireframe is ready, use the BI Tool Export feature to send it directly to Power BI or Tableau for further analysis and enhancements. You can also download the dashboard as a PDF, PNG, or JPEG, embed it on a platform, or invite your team to collaborate.
Note: This is a Pro template. You'll need a Pro subscription on Mokkup to use and customize this dashboard wireframe. Upgrade anytime to unlock full access.
Compressed Natural Gas Distribution Financial Performance Dashboard Example
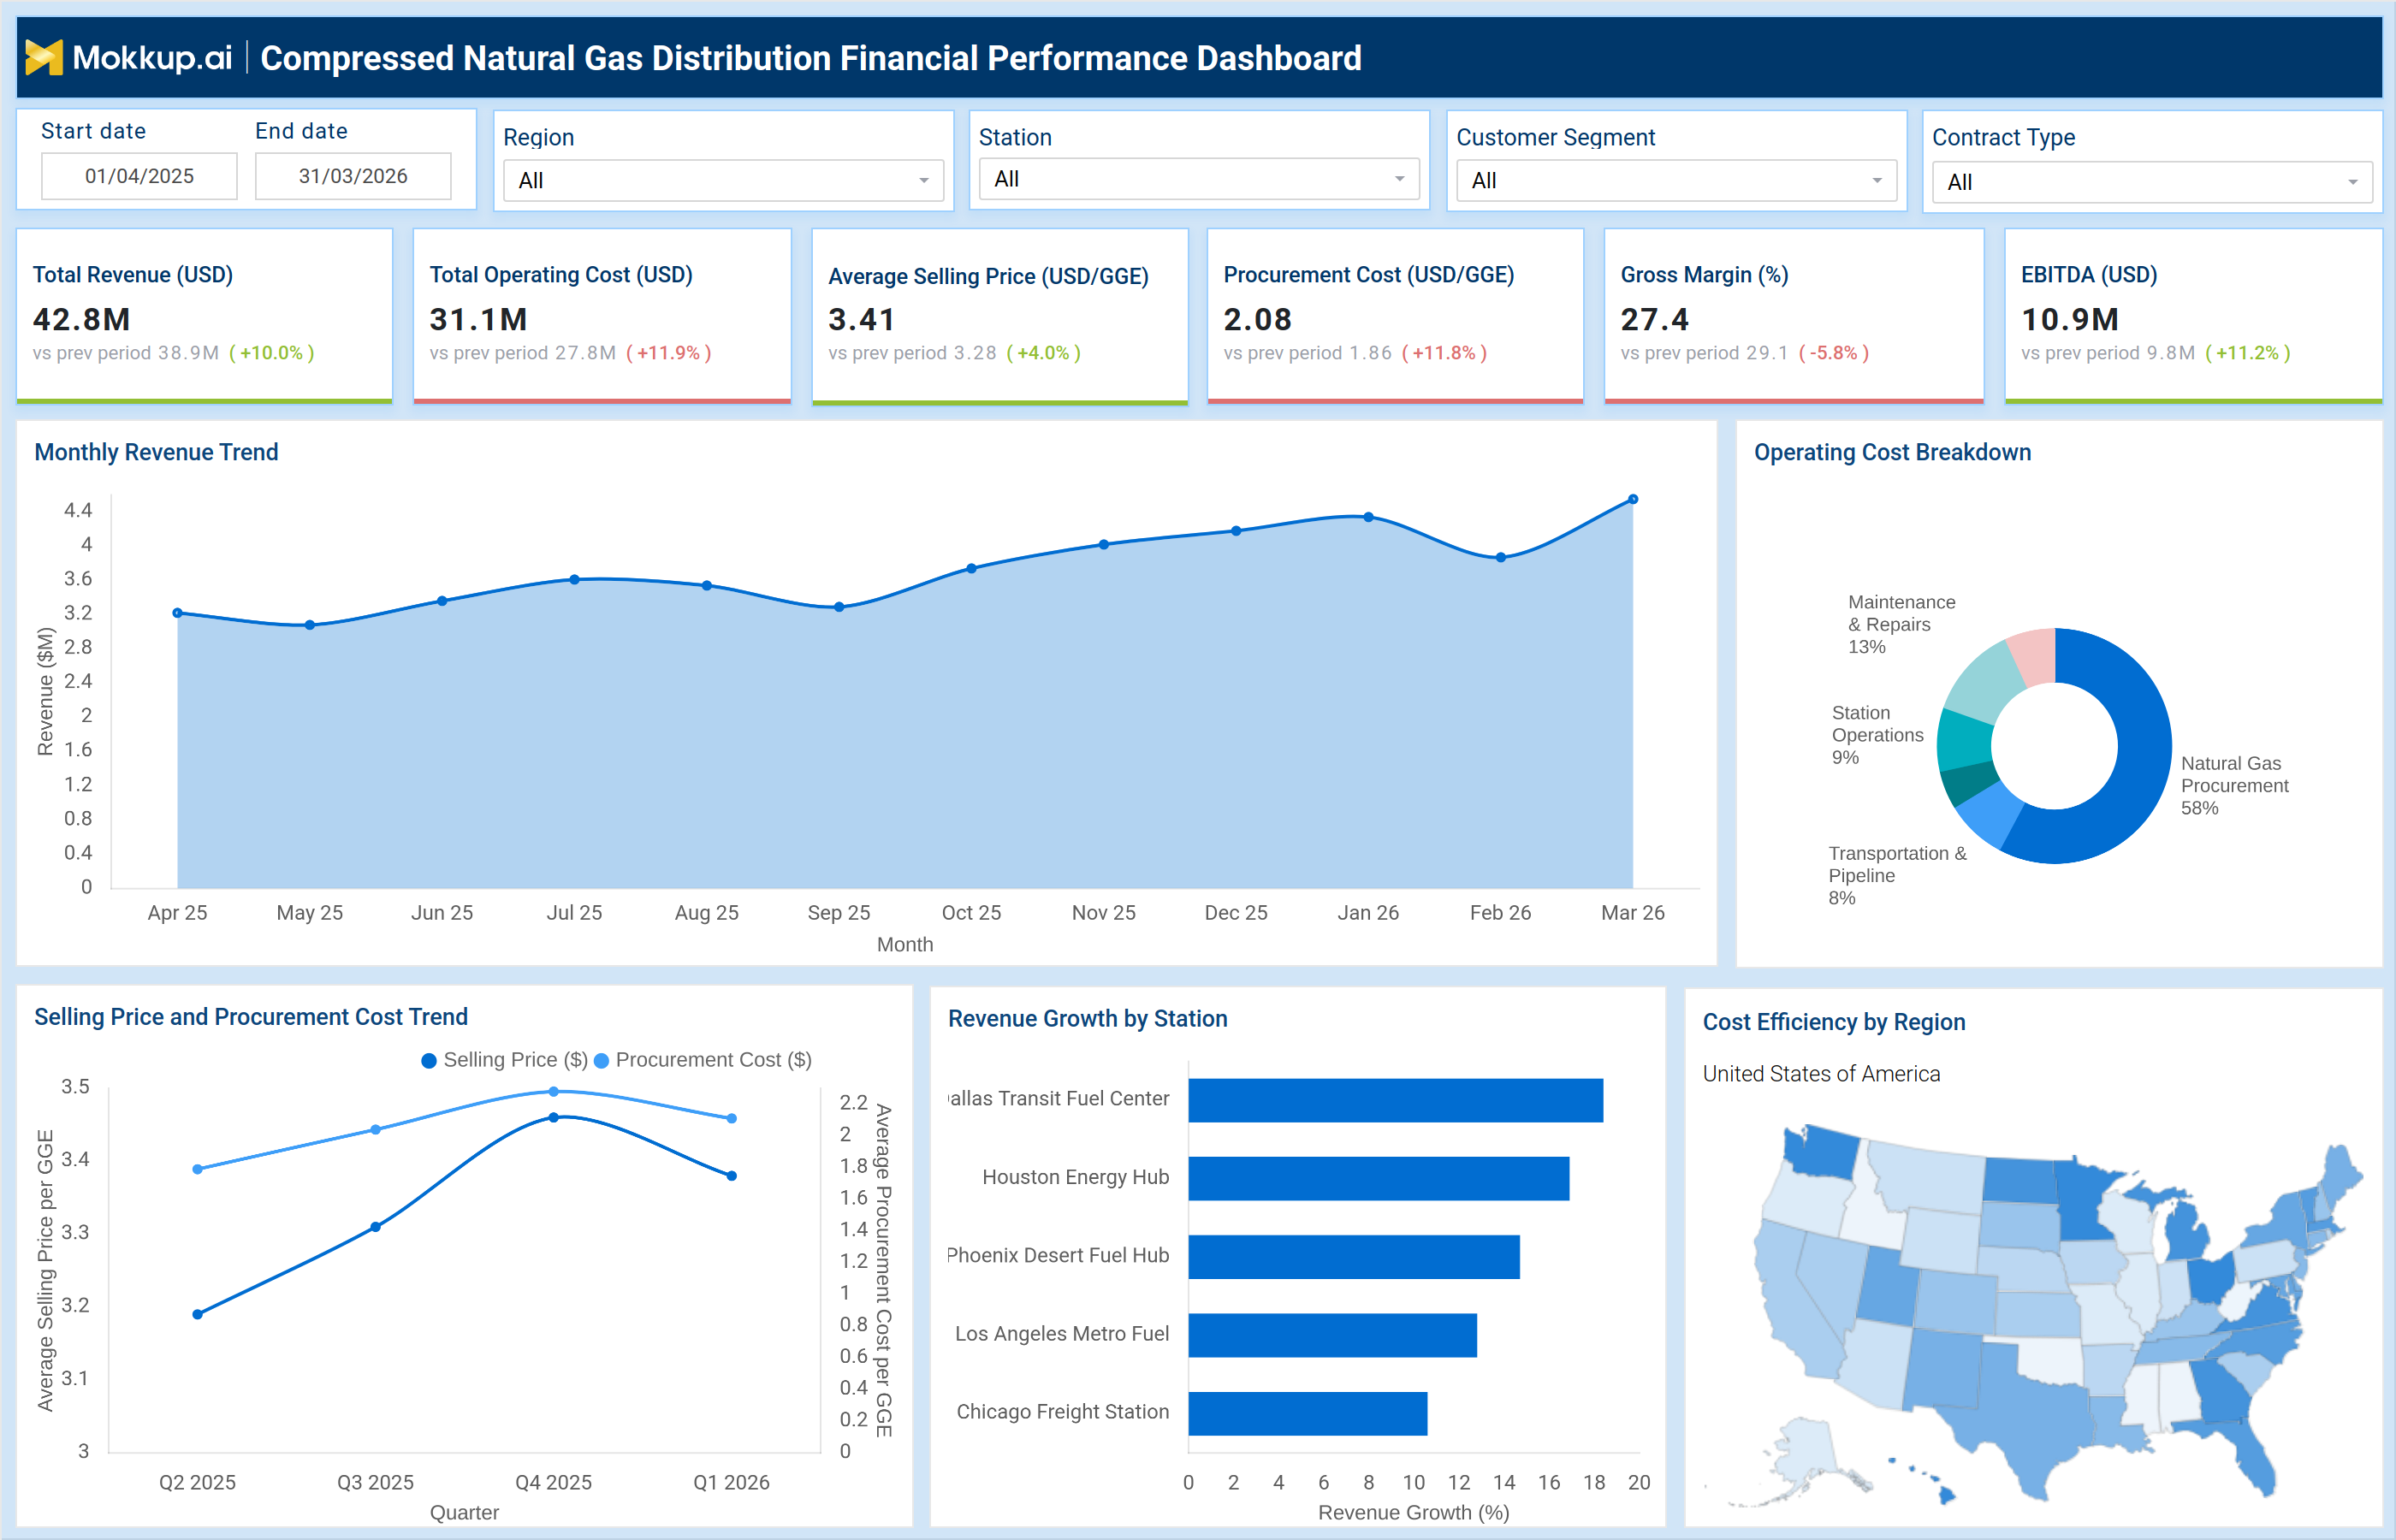
This CNG distribution revenue and cost analytics dashboard provides a complete financial overview of CNG distribution operations. The dashboard displays important KPIs, including Total Revenue, Total Operating Cost, Average Selling Price, Procurement Cost, Gross Margin, and EBITDA. These metrics help financial and operations teams measure profitability and monitor changes against previous reporting periods. The dashboard also includes a monthly revenue trend chart that tracks revenue growth over time and helps identify seasonal demand patterns. A Selling Price and Procurement Cost Trend visual compares procurement expenses against average selling prices to measure pricing efficiency and margin pressure. The operating cost breakdown chart categorizes spending into procurement, transportation, station operations, and maintenance costs, helping organizations identify major cost contributors. Additional analytics include station-wise revenue growth tracking and region-based cost efficiency analysis. This compressed natural gas financial KPI monitoring dashboard enables companies to compare performance across distribution locations and improve financial planning decisions. The dashboard helps CNG operators reduce operational costs, improve pricing strategies, and increase overall profitability.
How to Analyze Data in the Compressed Natural Gas Distribution Financial Performance Dashboard
Here is how you can analyze data from this dashboard:
- Monitor Total Revenue Trends: Compare total revenue against previous periods to identify growth patterns, revenue declines, and overall business performance trends.
- Analyze Total Operating Costs: Track operational expenses to identify cost increases and uncover opportunities for better cost management.
- Compare Average Selling Price with Procurement Cost: Measure pricing efficiency and profitability margins by evaluating the relationship between selling prices and procurement expenses.
- Review Gross Margin Percentage: Regularly assess gross margin performance to evaluate overall financial health and profitability.
- Track EBITDA Trends: Monitor EBITDA performance to measure operational profitability before taxes, interest, and depreciation impacts.
- Analyze Monthly Revenue Trends: Identify seasonal demand fluctuations and consumption patterns through monthly revenue analysis.
- Evaluate Operating Cost Breakdown: Understand which operational categories contribute most to expenses and prioritize cost optimization efforts.
- Monitor Revenue Growth by Station: Compare fuel station performance to identify high-performing locations and areas requiring operational improvements.
- Use Regional Cost Efficiency Analysis: Assess operational efficiency across geographic regions to benchmark performance and optimize resource allocation.
- Compare Procurement Price Changes with Revenue Performance: Analyze supply chain cost variations alongside revenue trends to improve procurement and pricing strategies.
- Analyze Customer Segment Profitability: Evaluate profitability across customer groups to refine pricing models, contracts, and service strategies.
- Use Trend Analysis for Financial Forecasting: Leverage historical and current financial data to support budgeting, forecasting, and long-term planning decisions.
Benefits of Compressed Natural Gas Distribution Financial Performance Dashboard
The following are the benefits of using this dashboard:
- Improves Financial Visibility: Provides clear insights into revenue, costs, and profitability across CNG distribution operations for better financial oversight.
- Optimizes Procurement and Operational Expenses: Helps organizations identify cost-saving opportunities and improve expense management strategies.
- Supports Data-Driven Financial Planning: Enables more accurate forecasting, budgeting, and financial decision-making using real-time analytics.
- Identifies Margin and Cost Risks Early: Detects declining profit margins and rising procurement costs before they significantly impact business performance.
- Enhances Station-Level Profitability Monitoring: Tracks and benchmarks fuel station performance to identify high-performing and underperforming locations.
- Evaluates Pricing Effectiveness: Analyzes pricing strategies across customer segments to improve profitability and competitive positioning.
- Supports Cost Reduction Initiatives: Uses detailed operational expense analysis to uncover inefficiencies and reduce unnecessary spending.
- Enhances Regional Performance Tracking: Compares operational and financial efficiency across regions to support targeted improvements.
- Improves Strategic Decision-Making: Centralizes financial analytics to help leadership make faster and more informed business decisions.
- Monitors EBITDA and Business Sustainability: Tracks EBITDA trends and overall financial stability to assess long-term business performance.
- Increases Cross-Functional Transparency: Improves collaboration between finance, operations, and procurement teams through shared performance visibility.
- Enables Faster Reporting and Evaluation: Streamlines reporting processes with automated dashboards and real-time performance monitoring.
KPIs to Track in Compressed Natural Gas Distribution Financial Performance Dashboard
The following key KPIs can be tracked by using this dashboard:
- Total Revenue (USD): Measures total income generated from CNG distribution operations.
- Total Operating Cost (USD): Tracks overall operational expenses across distribution activities.
- Average Selling Price (USD/GGE): Measures average selling price per gasoline gallon equivalent (GGE).
- Procurement Cost (USD/GGE): Tracks average natural gas procurement cost per GGE.
- Gross Margin (%): Measures profitability after deducting procurement and operational costs.
- EBITDA (USD): Tracks earnings before interest, taxes, depreciation, and amortization.
Frequently Asked Questions
1. What is the purpose of a Compressed Natural Gas Distribution Financial Performance Dashboard?
The dashboard helps CNG distributors monitor revenue, costs, profitability, procurement expenses, and operational efficiency in a centralized analytics platform.
2. Who uses a CNG distribution financial planning and performance dashboard?
Finance teams, operations managers, procurement departments, regional managers, and business executives use this dashboard to monitor and improve financial performance.
3. What are the main metrics tracked in this dashboard?
The dashboard tracks total revenue, operating cost, procurement cost, gross margin, EBITDA, selling price trends, and station-level revenue growth.