
What is a Smart Water Digital Capital Rollout Dashboard?
A smart water digital capital rollout dashboard is a centralized analytics platform designed to monitor, track, and optimize capital investments in water and wastewater utilities. It provides utilities with a data-driven view of infrastructure projects, technology deployments, and financial allocations. By integrating key performance metrics, project timelines, and asset performance, this dashboard helps utilities maximize return on investment (ROI) while ensuring efficient water management. This dashboard aggregates data from IoT sensors, pipeline monitoring systems, and financial records to offer insights into capital expenditure (CapEx), project progress, and operational efficiency. Water utility managers use it to make informed decisions on infrastructure upgrades, technology adoption, and resource allocation.
How to Create a Smart Water Digital Capital Rollout Dashboard
You don’t need to build your report from scratch, just start with a ready-to-use dashboard template from Mokkup. Add in your data and export it however you like. Here’s how to do it:
1. Create or Log in to Your Mokkup Account
Start by signing up on Mokkup.ai using your email. If you already have an account, just log in, and you’ll be good to go.
2. Choose and Customize Your Dashboard Template
Find the Smart Water Digital Capital Rollout Dashboard template in the Templates section. Use the drag and drop editor to adjust KPIs, edit filters, or add elements based on your data.
3. Export to Your BI Tool
Once your dashboard wireframe is ready, use the BI Tool Export feature to send it directly to Power BI or Tableau for further analysis and enhancements. You can also download the dashboard as a PDF, PNG, or JPEG, embed it on a platform, or invite your team to collaborate.=
Note: This is a Pro template. You’ll need a Pro subscription on Mokkup to use and customize this dashboard wireframe. Upgrade anytime to unlock full access.
Smart Water Digital Capital Rollout Dashboard Example
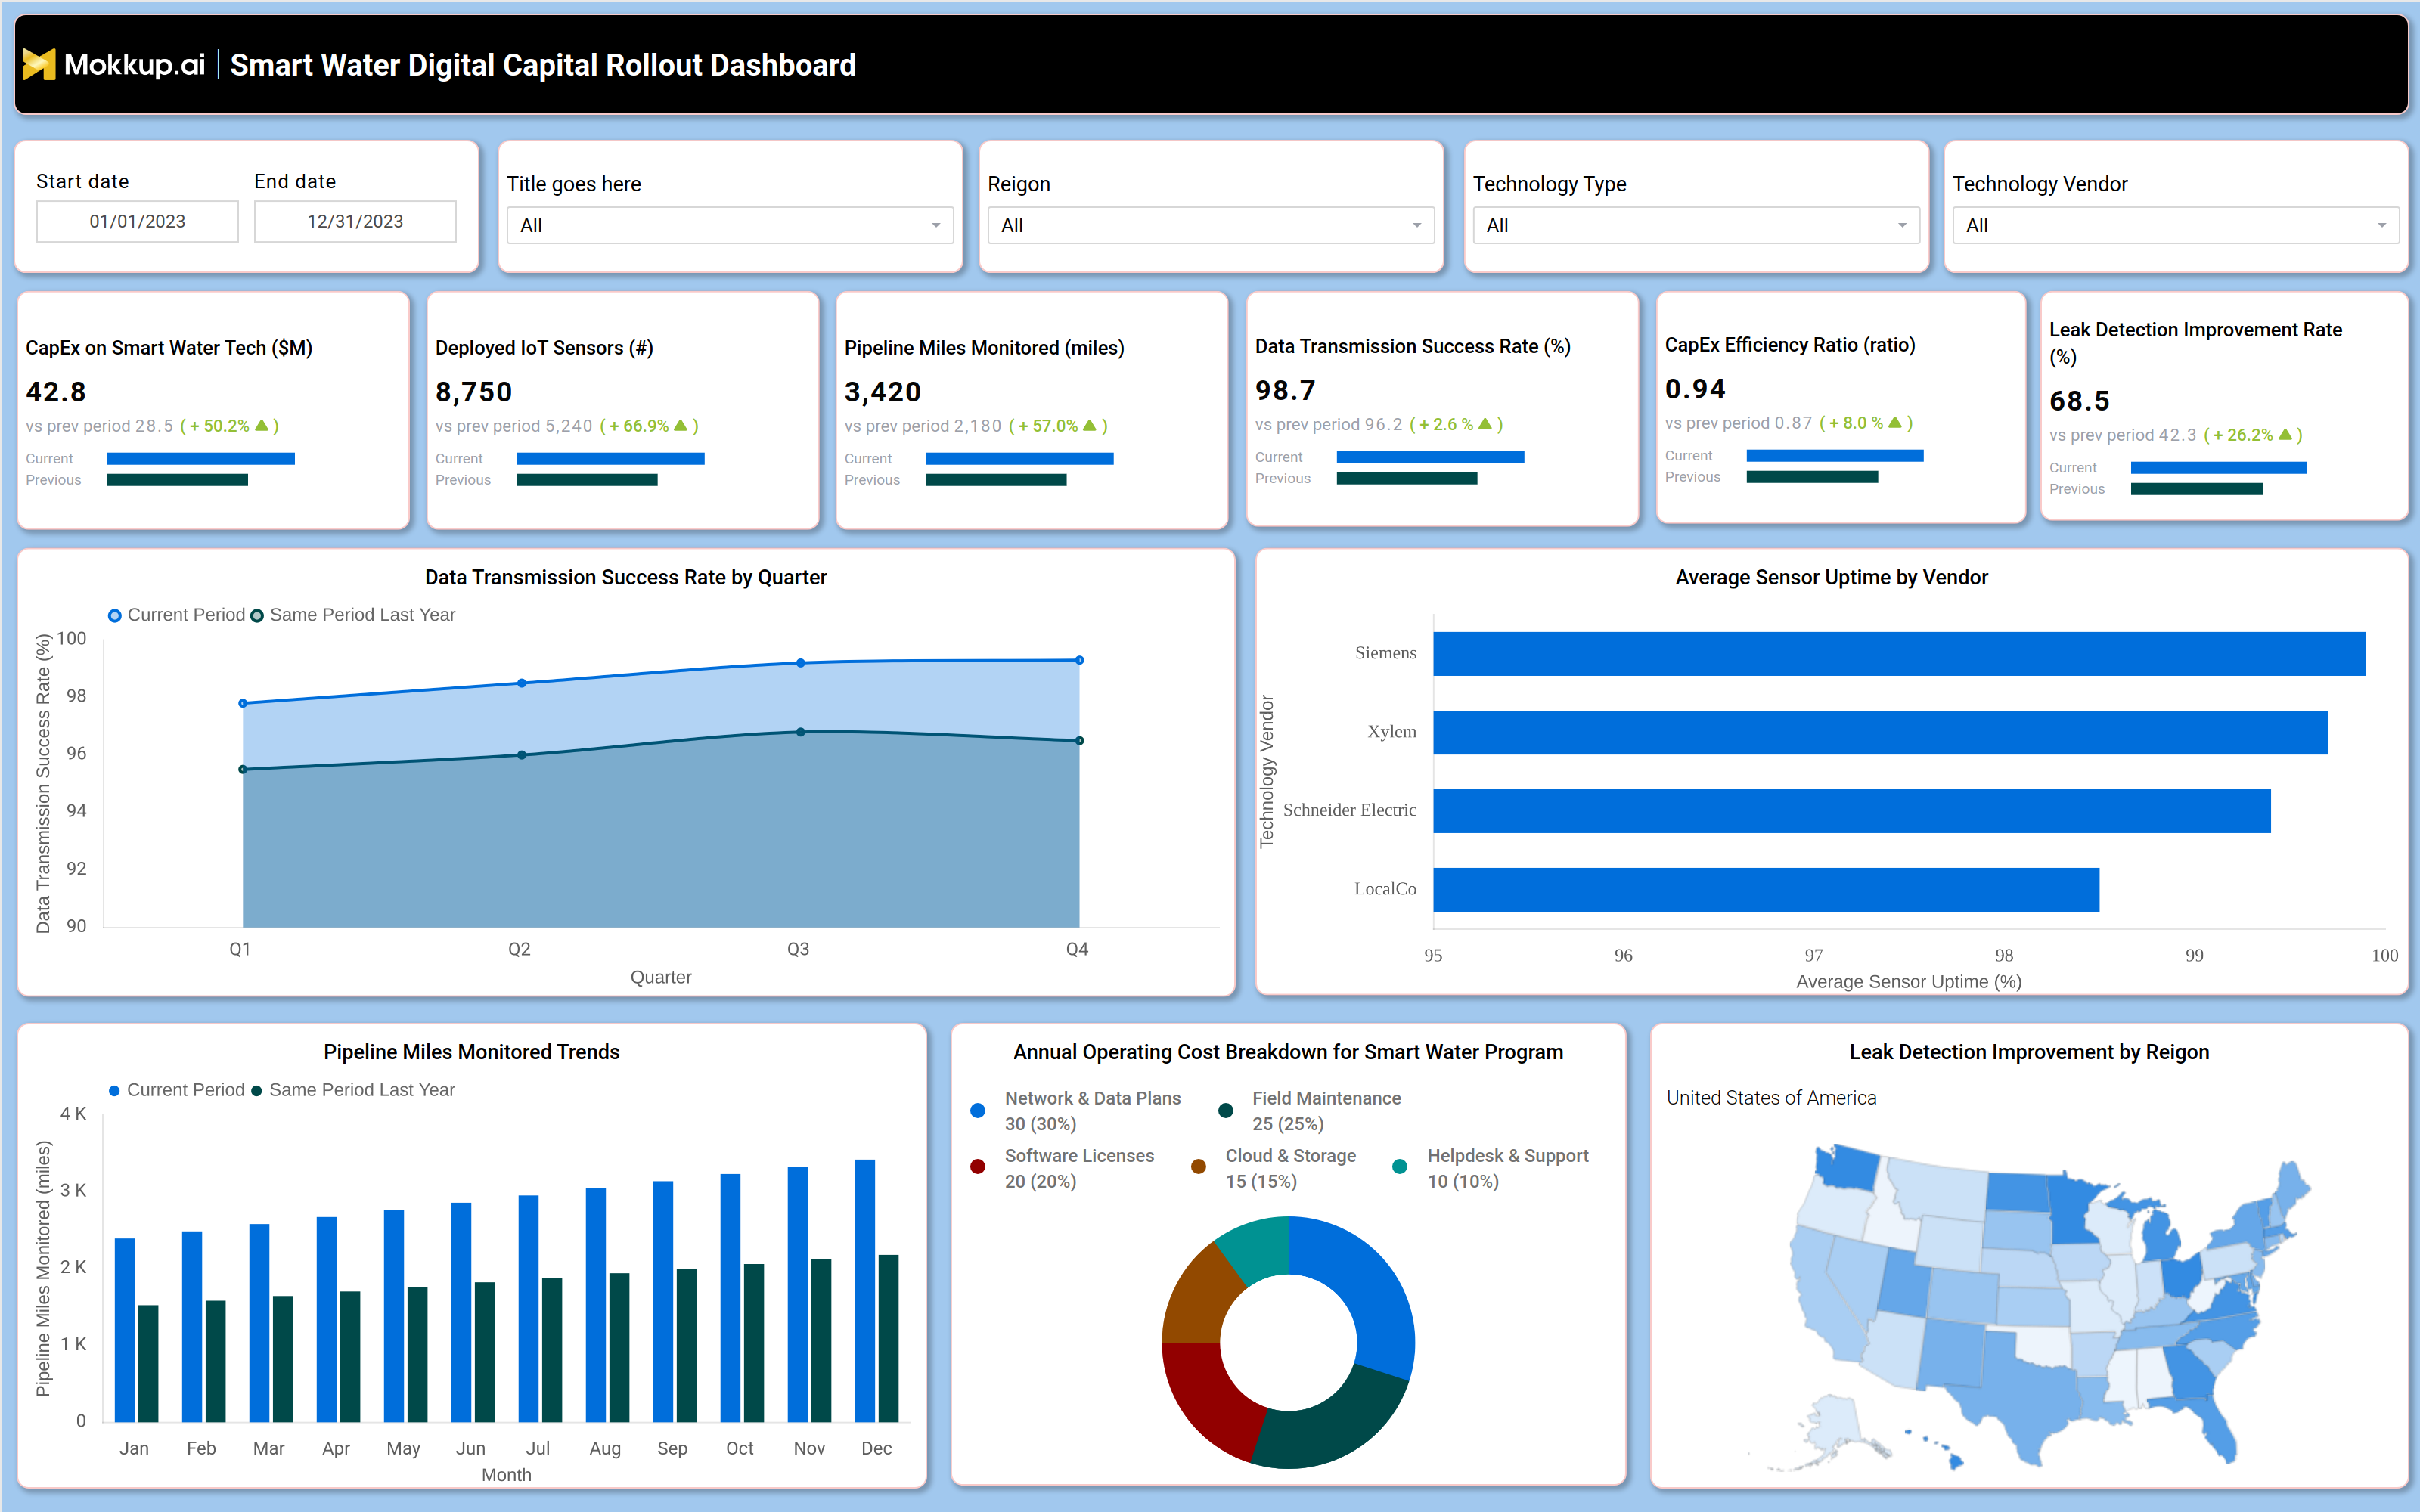
A typical smart water digital capital rollout dashboard includes interactive filters for date ranges, regions, technology types, and vendors. Key performance tiles display metrics such as CapEx on smart water tech, deployed IoT sensors, pipeline miles monitored, data transmission success rate, CapEx efficiency ratio, and leak detection improvement rate. Trend charts compare current performance against previous periods, showing improvements in sensor deployment, pipeline coverage, and data transmission reliability. A geographic heatmap highlights leak detection improvements by region, while a vendor comparison chart tracks average sensor uptime. The annual operating cost breakdown provides insights into spending on network plans, software licenses, field maintenance, and cloud storage.
Together, these components form a digital capital planning dashboard for water management, enabling utilities to track investments, optimize asset performance, and reduce operational costs.
How to Analyze Data in a Smart Water Digital Capital Rollout Dashboard
Here is how you can analyze data from this leak detection improvement dashboard:
- Review CapEx trends to assess investment allocation across smart water technologies.
- Track deployed IoT sensors to measure adoption rates and coverage expansion.
- Monitor pipeline miles monitored to evaluate infrastructure digitization progress.
- Analyze data transmission success rates to ensure reliable sensor connectivity.
- Compare CapEx efficiency ratios to optimize spending on smart water projects.
- Evaluate leak detection improvement rates to measure the impact of sensor deployments.
- Assess vendor performance by tracking average sensor uptime and reliability.
- Break down annual operating costs to identify costsaving opportunities in network, software, and maintenance.
Benefits of a Smart Water Digital Capital Rollout Dashboard
The following are the benefits of using this CapEx efficiency ratio dashboard:
- Enhances visibility into capital investments and project progress.
- Optimizes infrastructure spending by tracking CapEx efficiency.
- Improves asset performance with monitoring of pipelines and sensors.
- Reduces water loss through better leak detection and pipeline management.
- Supports data driven decision making for smart water technology adoption.
- Increases operational efficiency by streamlining project rollouts.
- Enables better vendor management with performance tracking.
- Helps meet regulatory compliance with accurate reporting on infrastructure upgrades.
KPIs to Track in a Smart Water Digital Capital Rollout Dashboard
The following key KPIs can be tracked by using this dashboard:
- CapEx on Smart Water Tech ($M): Total capital expenditure on smart water technologies.
- Deployed IoT Sensors (#): Number of IoT sensors installed for monitoring.
- Pipeline Miles Monitored (miles): Total length of pipelines under digital surveillance.
- Data Transmission Success Rate (%): Percentage of successful sensor data transmissions.
- CapEx Efficiency Ratio (ratio): Measures the return on capital investments.
- Leak Detection Improvement Rate (%): Reduction in water loss due to improved leak detection.
- Average Sensor Uptime (%): Reliability of IoT sensors across different vendors.
- Annual Operating Cost ($M): Measures the total yearly expenditure on operational activities related to smart water systems, including network connectivity, software licensing, field maintenance, cloud storage, and ongoing technical support.
Frequently Asked Questions
1. What is a smart water capital rollout dashboard used for?
It helps water utilities track capital investments, monitor infrastructure projects, and optimize smart water technology deployments.
2. What data sources feed into this IoT sensor deployment tracking dashboard?
IoT sensor networks, pipeline monitoring systems, financial records, and vendor performance reports.
3. Who should use a pipeline monitoring dashboard?
Water utility managers, infrastructure planners, financial analysts, and operations teams.