
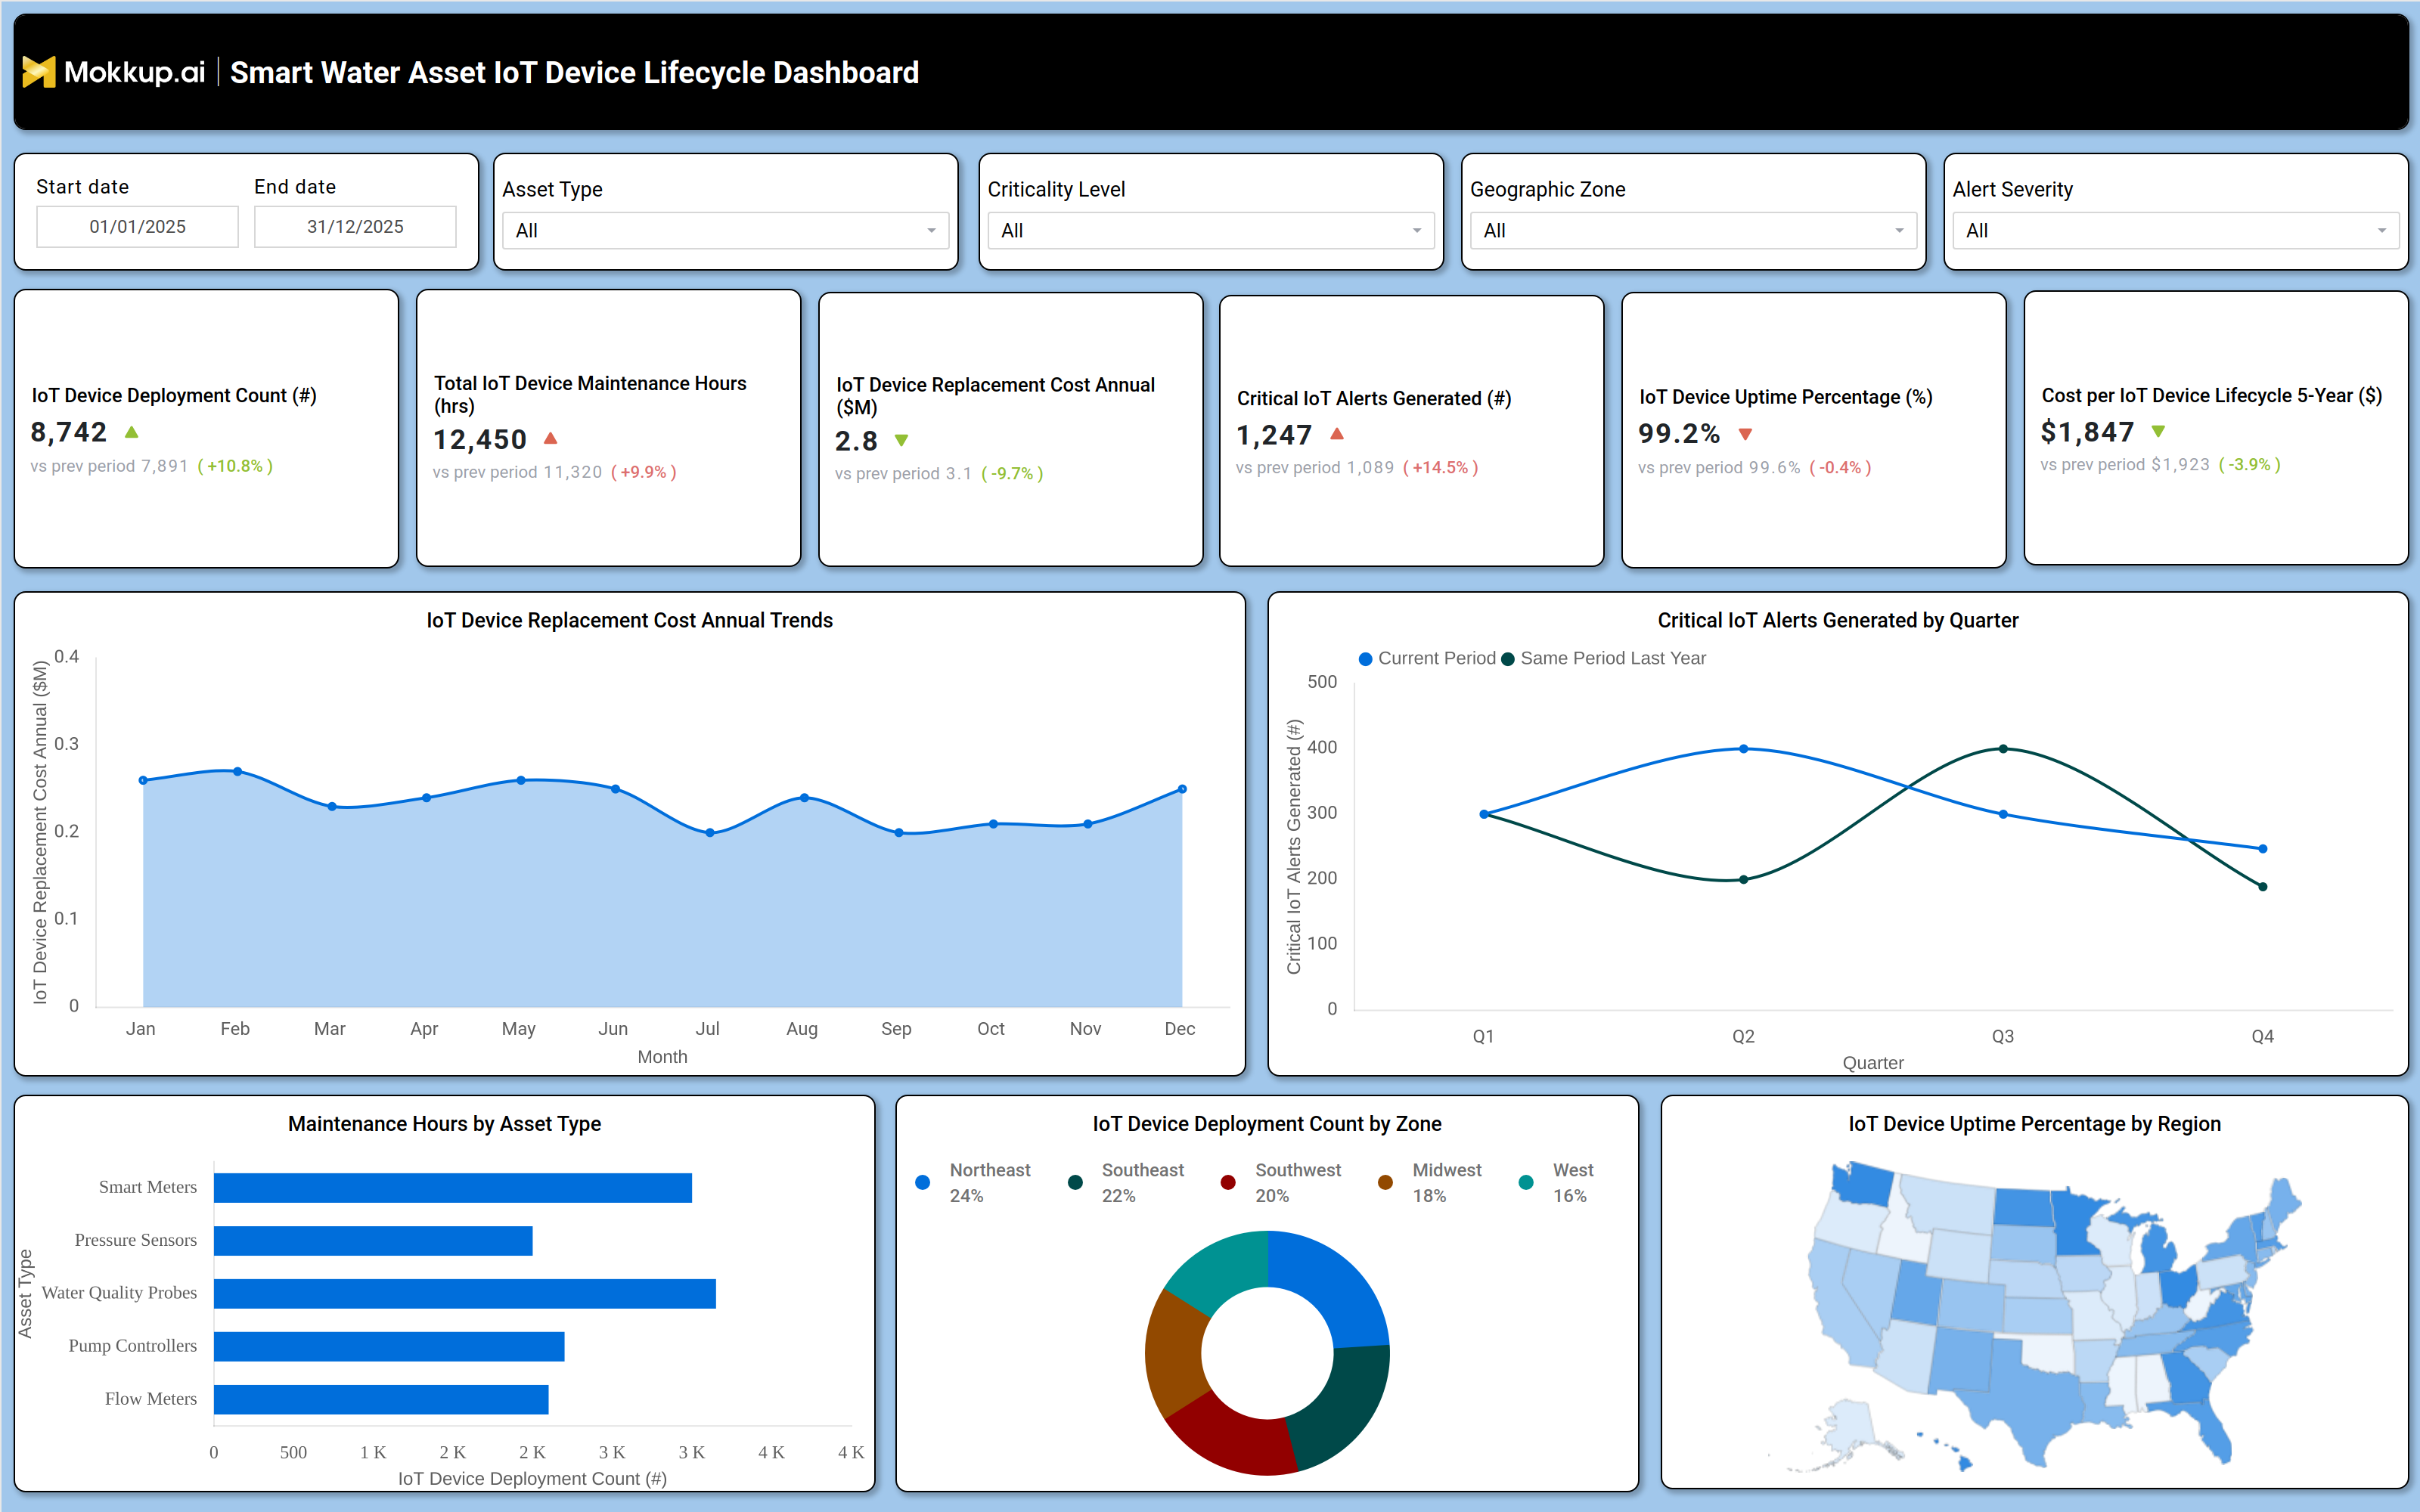
What is a Smart Water Asset IoT Device Lifecycle Dashboard?
The Smart Water Asset IoT Device Lifecycle Dashboard is an IoT device lifecycle management dashboard built for utility teams that oversee smart meters, pressure sensors, water quality probes, pump controllers, and flow meters across a service territory. It consolidates deployment counts, maintenance hours, replacement costs, and uptime performance into a single view so operations and asset management teams do not have to pull data from separate maintenance logs and finance sheets. Functioning as a smart water asset monitoring dashboard, it also doubles as an IoT device replacement cost planning dashboard, giving finance and operations leaders a shared reference point when budgeting for aging sensor fleets. Teams filter by asset type, criticality level, geographic zone, and alert severity, then compare current period performance against prior periods to spot cost or reliability shifts before they affect service delivery.
How to Create a Smart Water Asset IoT Device Lifecycle Dashboard
You don’t need to build your report from scratch; just start with a ready-to-use dashboard template from Mokkup. Add in your data and export it however you like. Here’s how to do it:
1. Create or Log in to Your Mokkup Account
Start by signing up on Mokkup.ai using your email. If you already have an account, just log in, and you'll be good to go.
2. Choose and Customize Your Dashboard Template
Find the Smart Water Asset IoT Device Lifecycle Dashboard template in the Templates section. Use the drag-and-drop editor to adjust KPIs, edit filters, or add elements based on your data.
3. Export to Your BI Tool
Once your dashboard wireframe is ready, use the BI Tool Export feature to send it directly to Power BI or Tableau for further analysis and enhancements. You can also download the dashboard as a PDF, PNG, or JPEG, embed it on a platform, or invite your team to collaborate.
Note: This is a Pro template. You'll need a Pro subscription on Mokkup to use and customize this dashboard wireframe. Upgrade anytime to unlock full access.
Smart Water Asset IoT Device Lifecycle Dashboard Example
An asset management lead at a water utility opens this dashboard to understand whether the IoT sensor fleet deployed across the network is performing reliably and staying within budget. Before making a case for new sensor purchases or a maintenance contract renewal, they need a clear picture of how many devices are active, how often they require servicing, and where uptime is slipping. Rather than working from static asset registers, they open the IoT device lifecycle management dashboard, apply the geographic zone and asset type filters, and start narrowing down which parts of the network need attention. From there, the team can identify whether maintenance hours are climbing for a specific asset type and use that to decide if a device model needs replacing rather than repeated servicing.
Planners can compare deployment growth against replacement spend to judge whether the fleet is scaling sustainably, and they can track how critical alerts trend by quarter to see if reliability issues are seasonal or getting worse over time. Regional uptime patterns help field teams prioritize which zones need a site visit first, and finance can weigh current lifecycle costs against prior periods before locking in next year's capital plan. Working through the dashboard this way turns scattered maintenance tickets and spreadsheets into a single narrative that the whole team can act on. Asset managers walk away with a defensible replacement schedule, finance gets a cost trend they can plan around, and field operations know exactly which zones and asset types deserve the next round of attention.
How to Analyze Data in a Smart Water Asset IoT Device Lifecycle Dashboard
Here is how you can analyze data from this dashboard:
- Filter by asset type and criticality level to isolate high-priority devices before reviewing performance trends.
- Compare current period IoT device deployment counts against the previous period to catch unplanned fleet growth.
- Use the maintenance hours by asset type chart to spot which device categories are driving service costs.
- Review the device maintenance hours tracking dashboard view by geographic zone to flag regions needing extra field support.
- Track critical IoT alerts by quarter to distinguish recurring issues from one-time spikes.
- Cross-check uptime percentage by region against alert severity filters to confirm whether outages are localized.
- Apply the IoT device uptime tracking for water utilities view alongside date filters to measure seasonal reliability shifts.
Benefits of a Smart Water Asset IoT Device Lifecycle Dashboard
The following are the benefits of using this dashboard:
- Centralizes deployment, maintenance, and cost data into one smart water asset monitoring dashboard instead of scattered spreadsheets.
- Gives asset managers a single device maintenance hours tracking dashboard to justify staffing and contractor decisions.
- Supports critical IoT alert monitoring for water infrastructure so reliability issues get flagged before they escalate.
- Helps finance teams validate replacement budgets against actual annual cost trends.
- Improves visibility into uptime performance across zones and regions for faster field response.
- Reduces manual reporting effort by combining KPI tiles, trend charts, and regional maps in one place.
KPIs to Track in a Smart Water Asset IoT Device Lifecycle Dashboard
The following key KPIs can be tracked by using this dashboard:
- IoT Device Deployment Count (count): total number of connected devices active across the network, used to track fleet growth.
- Total IoT Device Maintenance Hours (hrs): cumulative service hours logged across all asset types, used to gauge maintenance workload.
- IoT Device Replacement Cost Annual ($M) : yearly spend on replacing aging or failed devices, used for capital planning.
- Critical IoT Alerts Generated (count): count of high-severity alerts raised by the sensor network, central to critical IoT alert monitoring for water infrastructure.
- IoT Device Uptime Percentage (%) : share of time devices remain operational, core to IoT device uptime tracking for water utilities.
- Cost per IoT Device Lifecycle 5-Year ($): average total cost of owning a device over five years, used to compare asset models.
Frequently Asked Questions
1. What does the Smart Water Asset IoT Device Lifecycle Dashboard track?
It tracks IoT device deployment, maintenance hours, replacement costs, uptime, and critical alerts across asset types and zones. As an IoT device lifecycle management dashboard, it gives utility teams one place to review fleet performance instead of separate systems.
2. Who should use this dashboard?
Asset managers, field operations leads, and finance teams responsible for smart water IoT infrastructure planning and budgeting use it most. It also works as an IoT device replacement cost planning dashboard for teams preparing annual capital requests.
3. Can I customize this dashboard for my own data?
Yes. Mokkup's drag-and-drop editor lets you edit KPIs, filters, and charts, then export the wireframe to Power BI, Tableau, or as an image file. No coding is required to adjust it to your utility's asset categories.