
What is a Natural Gas Transmission Asset Management Dashboard?
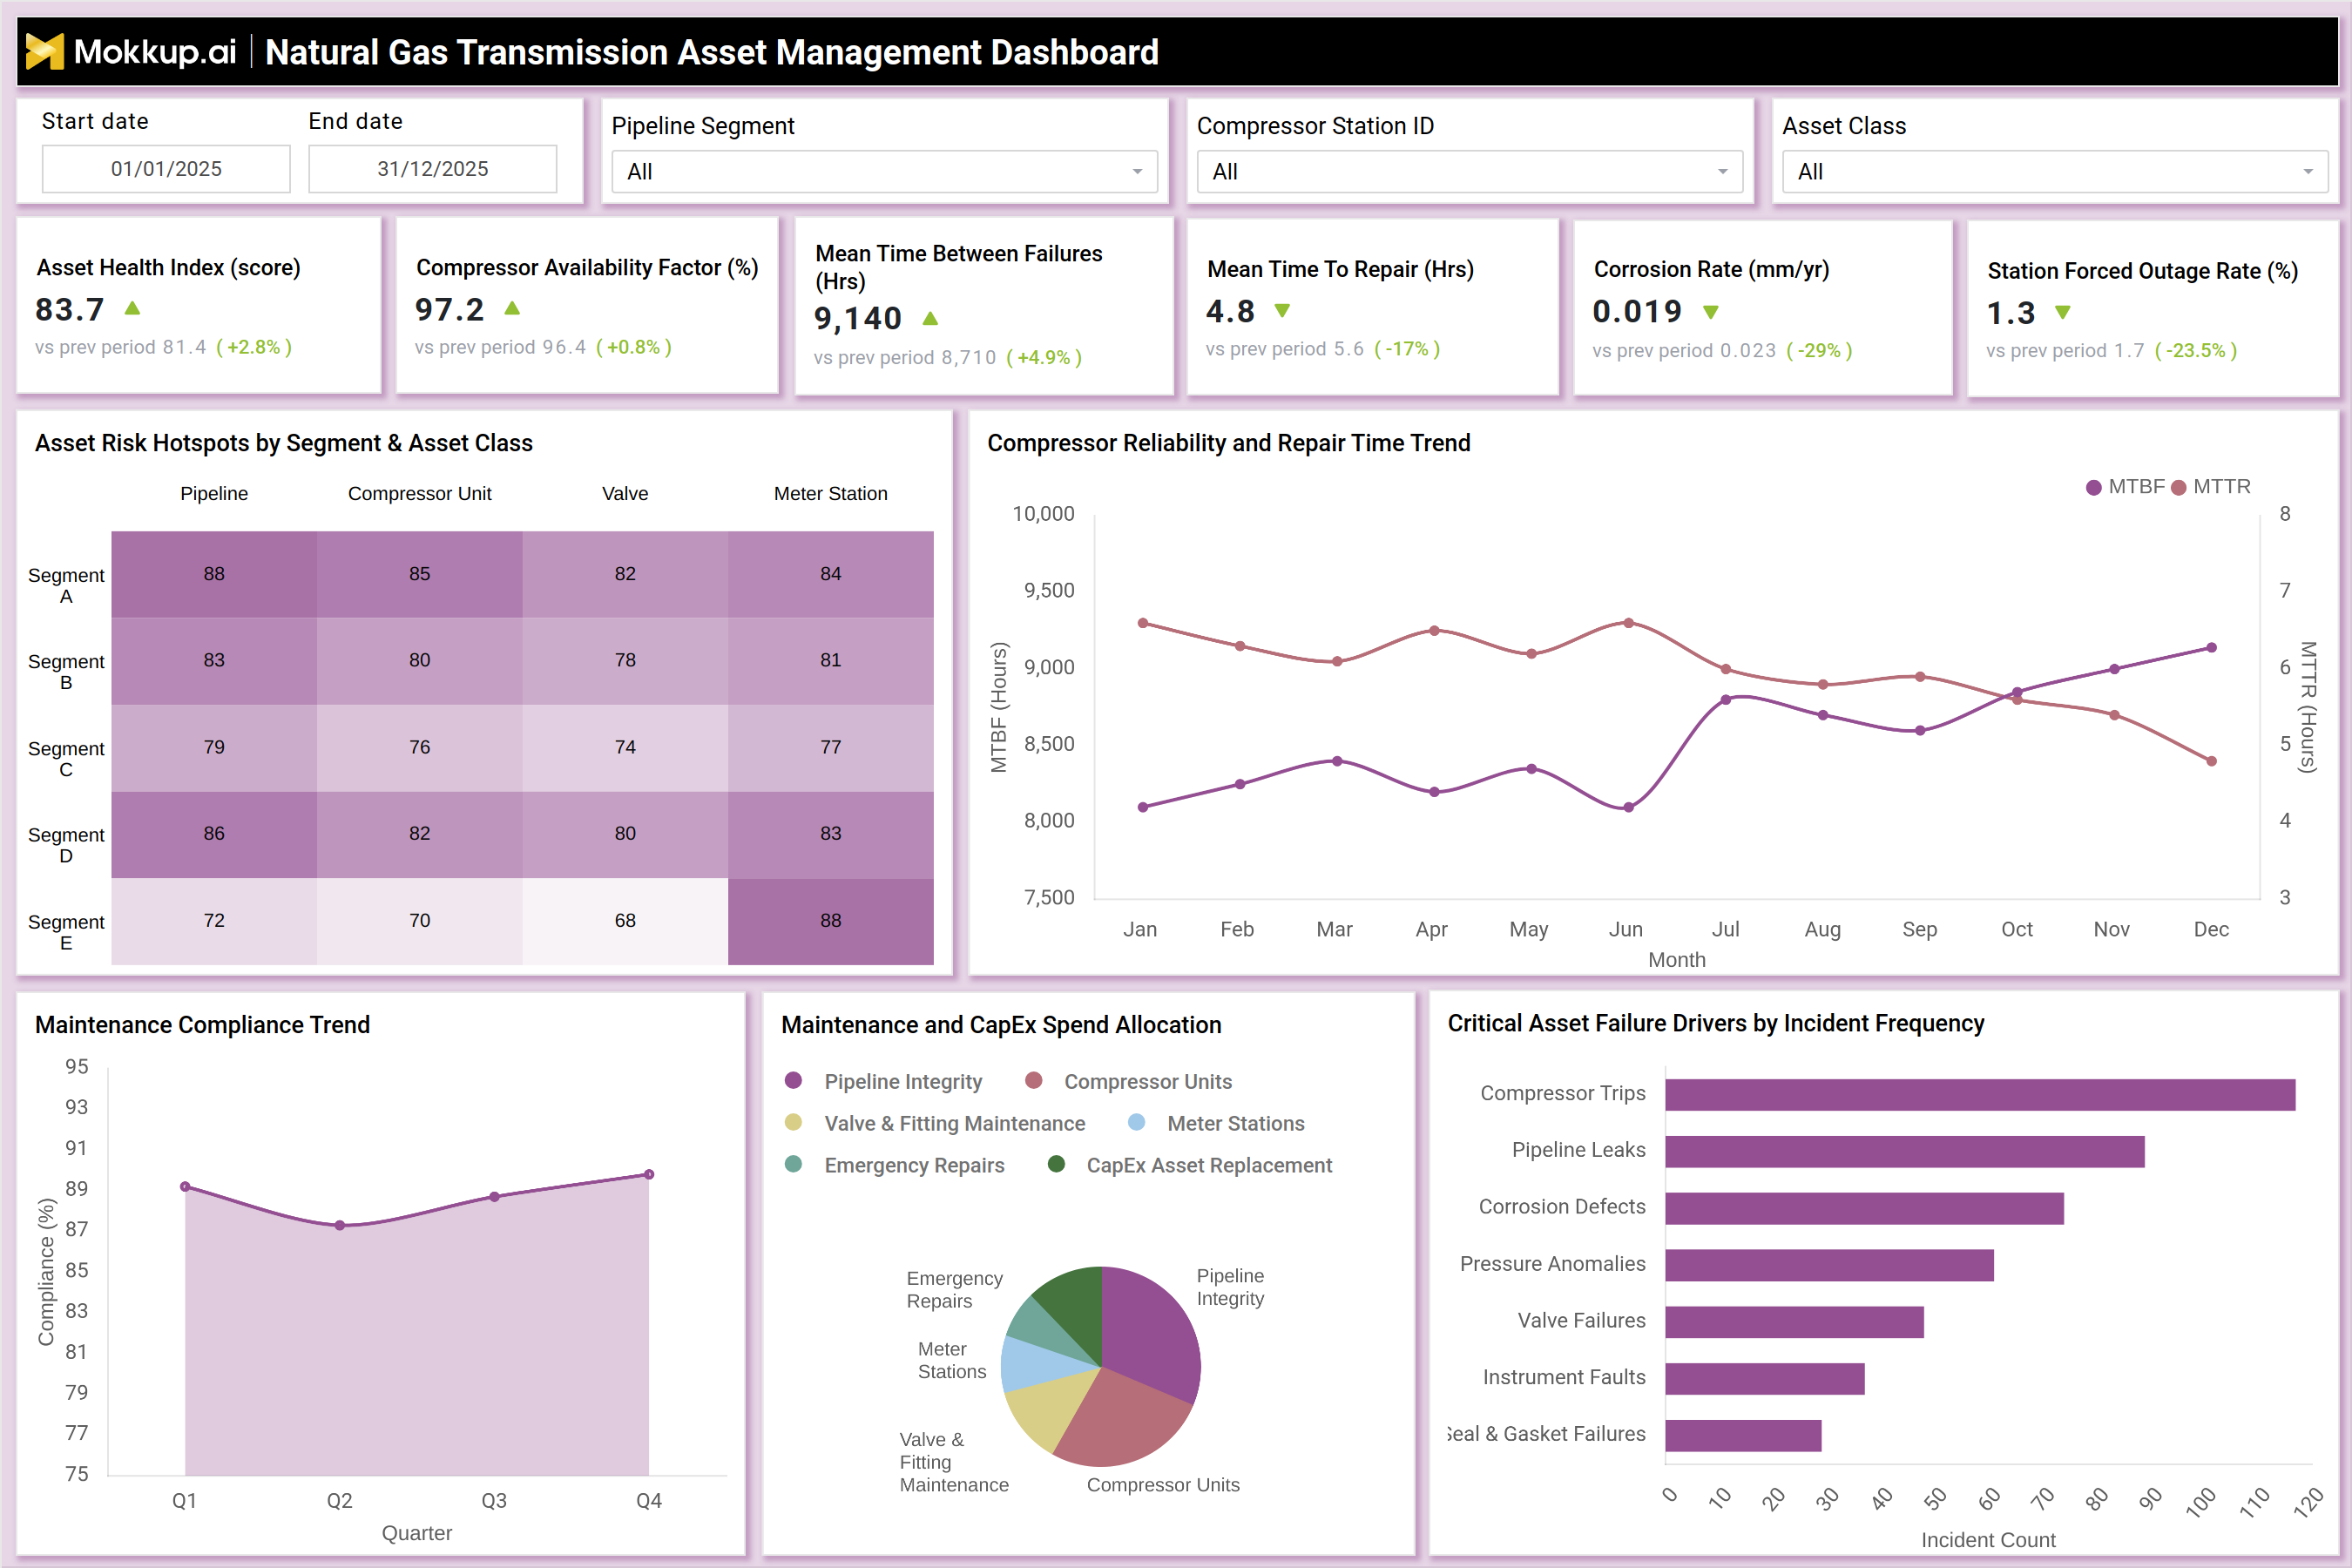
A natural gas transmission asset management dashboard is a centralized analytics platform used by pipeline operators to monitor asset health, reliability, and maintenance performance across transmission infrastructure. It combines data from compressor stations, pipelines, valves, and metering systems into a unified operational view. Pipeline networks operate across large geographies and require continuous monitoring of asset condition and failure risk. A pipeline asset management dashboard for natural gas utilities helps track key metrics such as availability, failure rates, and repair times. It supports proactive maintenance by identifying high-risk assets and performance degradation trends. The dashboard also functions as a natural gas pipeline asset performance monitoring dashboard for evaluating system reliability. Operators can monitor asset lifecycle indicators such as corrosion rate and outage frequency. As a transmission pipeline asset reliability monitoring system, it improves visibility into critical infrastructure performance. This natural gas asset maintenance and performance dashboard enables data-driven asset management decisions.
How to Create a Natural Gas Transmission Asset Management Dashboard
You don't need to build your report from scratch, just start with a ready-to-use dashboard template from Mokkup. Add in your data and export it however you like. Here's how to do it:
1. Create or Log in to Your Mokkup Account
Start by signing up on Mokkup.ai using your email. If you already have an account, just log in, and you'll be good to go.
2. Choose and Customize Your Dashboard Template
Find the Natural Gas Transmission Asset Management Dashboard template in the Templates section. Use the drag-and-drop editor to adjust KPIs, edit filters, or add elements based on your data.
3. Export to Your BI Tool
Once your dashboard wireframe is ready, use the BI Tool Export feature to send it directly to Power BI or Tableau for further analysis and enhancements. You can also download the dashboard as a PDF, PNG, or JPEG, embed it on a platform, or invite your team to collaborate.
Note: This is a Pro template. You'll need a Pro subscription on Mokkup to use and customize this dashboard wireframe. Upgrade anytime to unlock full access.
Natural Gas Transmission Asset Management Dashboard Example
A natural gas transmission operator managing multiple pipeline segments and compressor stations must ensure continuous asset reliability and operational safety. A natural gas transmission asset management dashboard provides a centralized view of asset health, availability, and maintenance performance. Operations teams can track asset health index, compressor availability, and mean time between failures to assess reliability. Maintenance teams monitor mean time to repair and forced outage rates to evaluate response efficiency. The dashboard highlights asset risk hotspots across pipeline segments and asset classes such as compressors, valves, and meter stations. Reliability trends help identify whether failure rates are increasing or improving over time. Maintenance compliance trends provide insight into adherence to scheduled maintenance programs. CapEx and maintenance spend allocation show how investments are distributed across asset categories. Failure driver analysis helps identify root causes such as compressor trips, pipeline leaks, or corrosion defects.
How to Analyze Data in the Natural Gas Transmission Asset Management Dashboard
- Review asset health index: Provides an overall view of infrastructure condition and performance status.
- Analyze compressor availability: Measures uptime of critical assets to ensure consistent pipeline operations.
- Monitor mean time between failures (MTBF): Tracks reliability trends by measuring time between asset failures.
- Track mean time to repair (MTTR): Evaluates maintenance efficiency by analyzing repair turnaround time.
- Review corrosion rate: Identifies long-term degradation risks affecting pipeline integrity.
- Analyze forced outage rate: Assesses frequency of unplanned downtime impacting operations.
- Examine asset risk hotspots: Highlights high-risk assets and pipeline segments for targeted action.
- Study reliability and repair trends: Detects performance changes and recurring issues over time.
- Review maintenance compliance trends: Ensures adherence to planned maintenance schedules and standards.
- Analyze failure drivers: Identifies root causes to prevent recurring asset failures.
Benefits of Natural Gas Transmission Asset Management Dashboard
- Provides centralized visibility into pipeline asset performance and health: Consolidates asset data for a unified view of infrastructure condition.
- Improves reliability monitoring across transmission infrastructure: Enables continuous tracking of asset performance and reliability metrics.
- Enables proactive maintenance through early risk identification: Detects potential issues early to prevent failures and downtime.
- Reduces unplanned outages by tracking failure patterns: Identifies recurring issues to minimize unexpected disruptions.
- Enhances maintenance planning and resource allocation: Optimizes scheduling and resource use based on asset needs.
- Supports asset lifecycle management for pipelines and compressor stations: Helps manage assets from installation to replacement effectively.
- Improves operational efficiency across natural gas transmission networks: Streamlines operations through better asset performance insights.
- Strengthens decision-making with data-driven asset insights: Empowers stakeholders with actionable performance data.
- Enhances safety by monitoring critical infrastructure risks: Identifies high-risk areas to prevent safety incidents.
- Supports long-term capital planning for asset replacement and upgrades: Guides investment decisions using asset condition and performance data.
KPIs to Track in Natural Gas Transmission Asset Management Dashboard
- Asset Health Index (score) – Overall condition score of pipeline assets based on performance and maintenance data.
- Compressor Availability Factor (%) – Percentage uptime of compressor units supporting gas transmission.
- Mean Time Between Failures (Hrs) – Average operating time between asset failures, indicating reliability.
- Mean Time To Repair (Hrs) – Average time required to restore failed assets to operational condition.
- Corrosion Rate (mm/yr) – Rate of material degradation affecting pipeline integrity.
- Station Forced Outage Rate (%) – Frequency of unplanned outages at compressor stations.
- Asset Risk Hotspots by Segment & Asset Class – Identification of high-risk areas across pipeline segments and asset categories.
- Compressor Reliability and Repair Time Trend – Trend analysis of MTBF and MTTR over time.
- Maintenance Compliance Trend – Percentage of completed maintenance activities versus planned schedules.
- Maintenance and CapEx Spend Allocation – Distribution of maintenance and capital expenditure across asset categories.
- Critical Asset Failure Drivers by Incident Frequency – Root causes of failures such as compressor trips, leaks, and corrosion defects.
Frequently Asked Questions
1. What is a natural gas transmission asset management dashboard?
It is a monitoring platform that tracks asset health, reliability, maintenance performance, and risk across pipeline infrastructure.
2. Who uses a pipeline asset management dashboard for natural gas utilities?
Asset managers, maintenance teams, reliability engineers, and operations leaders use this dashboard.
3. Why is asset management important in natural gas transmission?
Pipeline infrastructure requires continuous monitoring to prevent failures, ensure safety, and maintain operational efficiency.