What is an Irrigation & Water Distribution Asset Reliability & Maintenance Dashboard?
An Irrigation & Water Distribution Asset Reliability & Maintenance Dashboard is a centralized analytics platform used to monitor the operational health, maintenance performance, asset availability, and reliability of irrigation and water distribution infrastructure. It helps water utilities, irrigation authorities, and infrastructure maintenance teams track pumps, canals, gates, motors, valves, and lift stations across distribution networks. This dashboard combines maintenance KPIs, asset condition monitoring, downtime analysis, failure tracking, and aging asset insights into a single operational view. An irrigation and water distribution asset reliability dashboard enables operators to identify critical assets, reduce operational downtime, and improve maintenance planning efficiency.
The dashboard also functions as a water distribution asset reliability monitoring dashboard by helping teams monitor equipment failures, repair timelines, maintenance completion rates, and asset lifecycle conditions. With integrated maintenance analytics, utilities can improve infrastructure reliability, optimize preventive maintenance programs, and reduce service interruptions across irrigation networks. In addition, the solution acts as an irrigation system maintenance performance analytics dashboard by analyzing maintenance work order trends, aging asset risks, and asset-specific failure patterns. This supports proactive maintenance decisions and long-term infrastructure planning.
How to Create an Irrigation & Water Distribution Asset Reliability & Maintenance Dashboard
You don't need to build your report from scratch, just start with a ready-to-use dashboard template from Mokkup. Add in your data and export it however you like. Here's how to do it:
1. Create or Log in to Your Mokkup Account
Start by signing up on Mokkup.ai using your email. If you already have an account, just log in, and you'll be good to go.
2. Choose and Customize Your Dashboard Template
Find the Irrigation & Water Distribution Asset Reliability & Maintenance Dashboard template in the Templates section. Use the drag-and-drop editor to adjust KPIs, edit filters, or add elements based on your data.
3. Export to Your BI Tool
Once your dashboard wireframe is ready, use the BI Tool Export feature to send it directly to Power BI or Tableau for further analysis and enhancements. You can also download the dashboard as a PDF, PNG, or JPEG, embed it on a platform, or invite your team to collaborate.
Note: This is a Pro template. You'll need a Pro subscription on Mokkup to use and customize this dashboard wireframe. Upgrade anytime to unlock full access.
Irrigation & Water Distribution Asset Reliability & Maintenance Dashboard Example
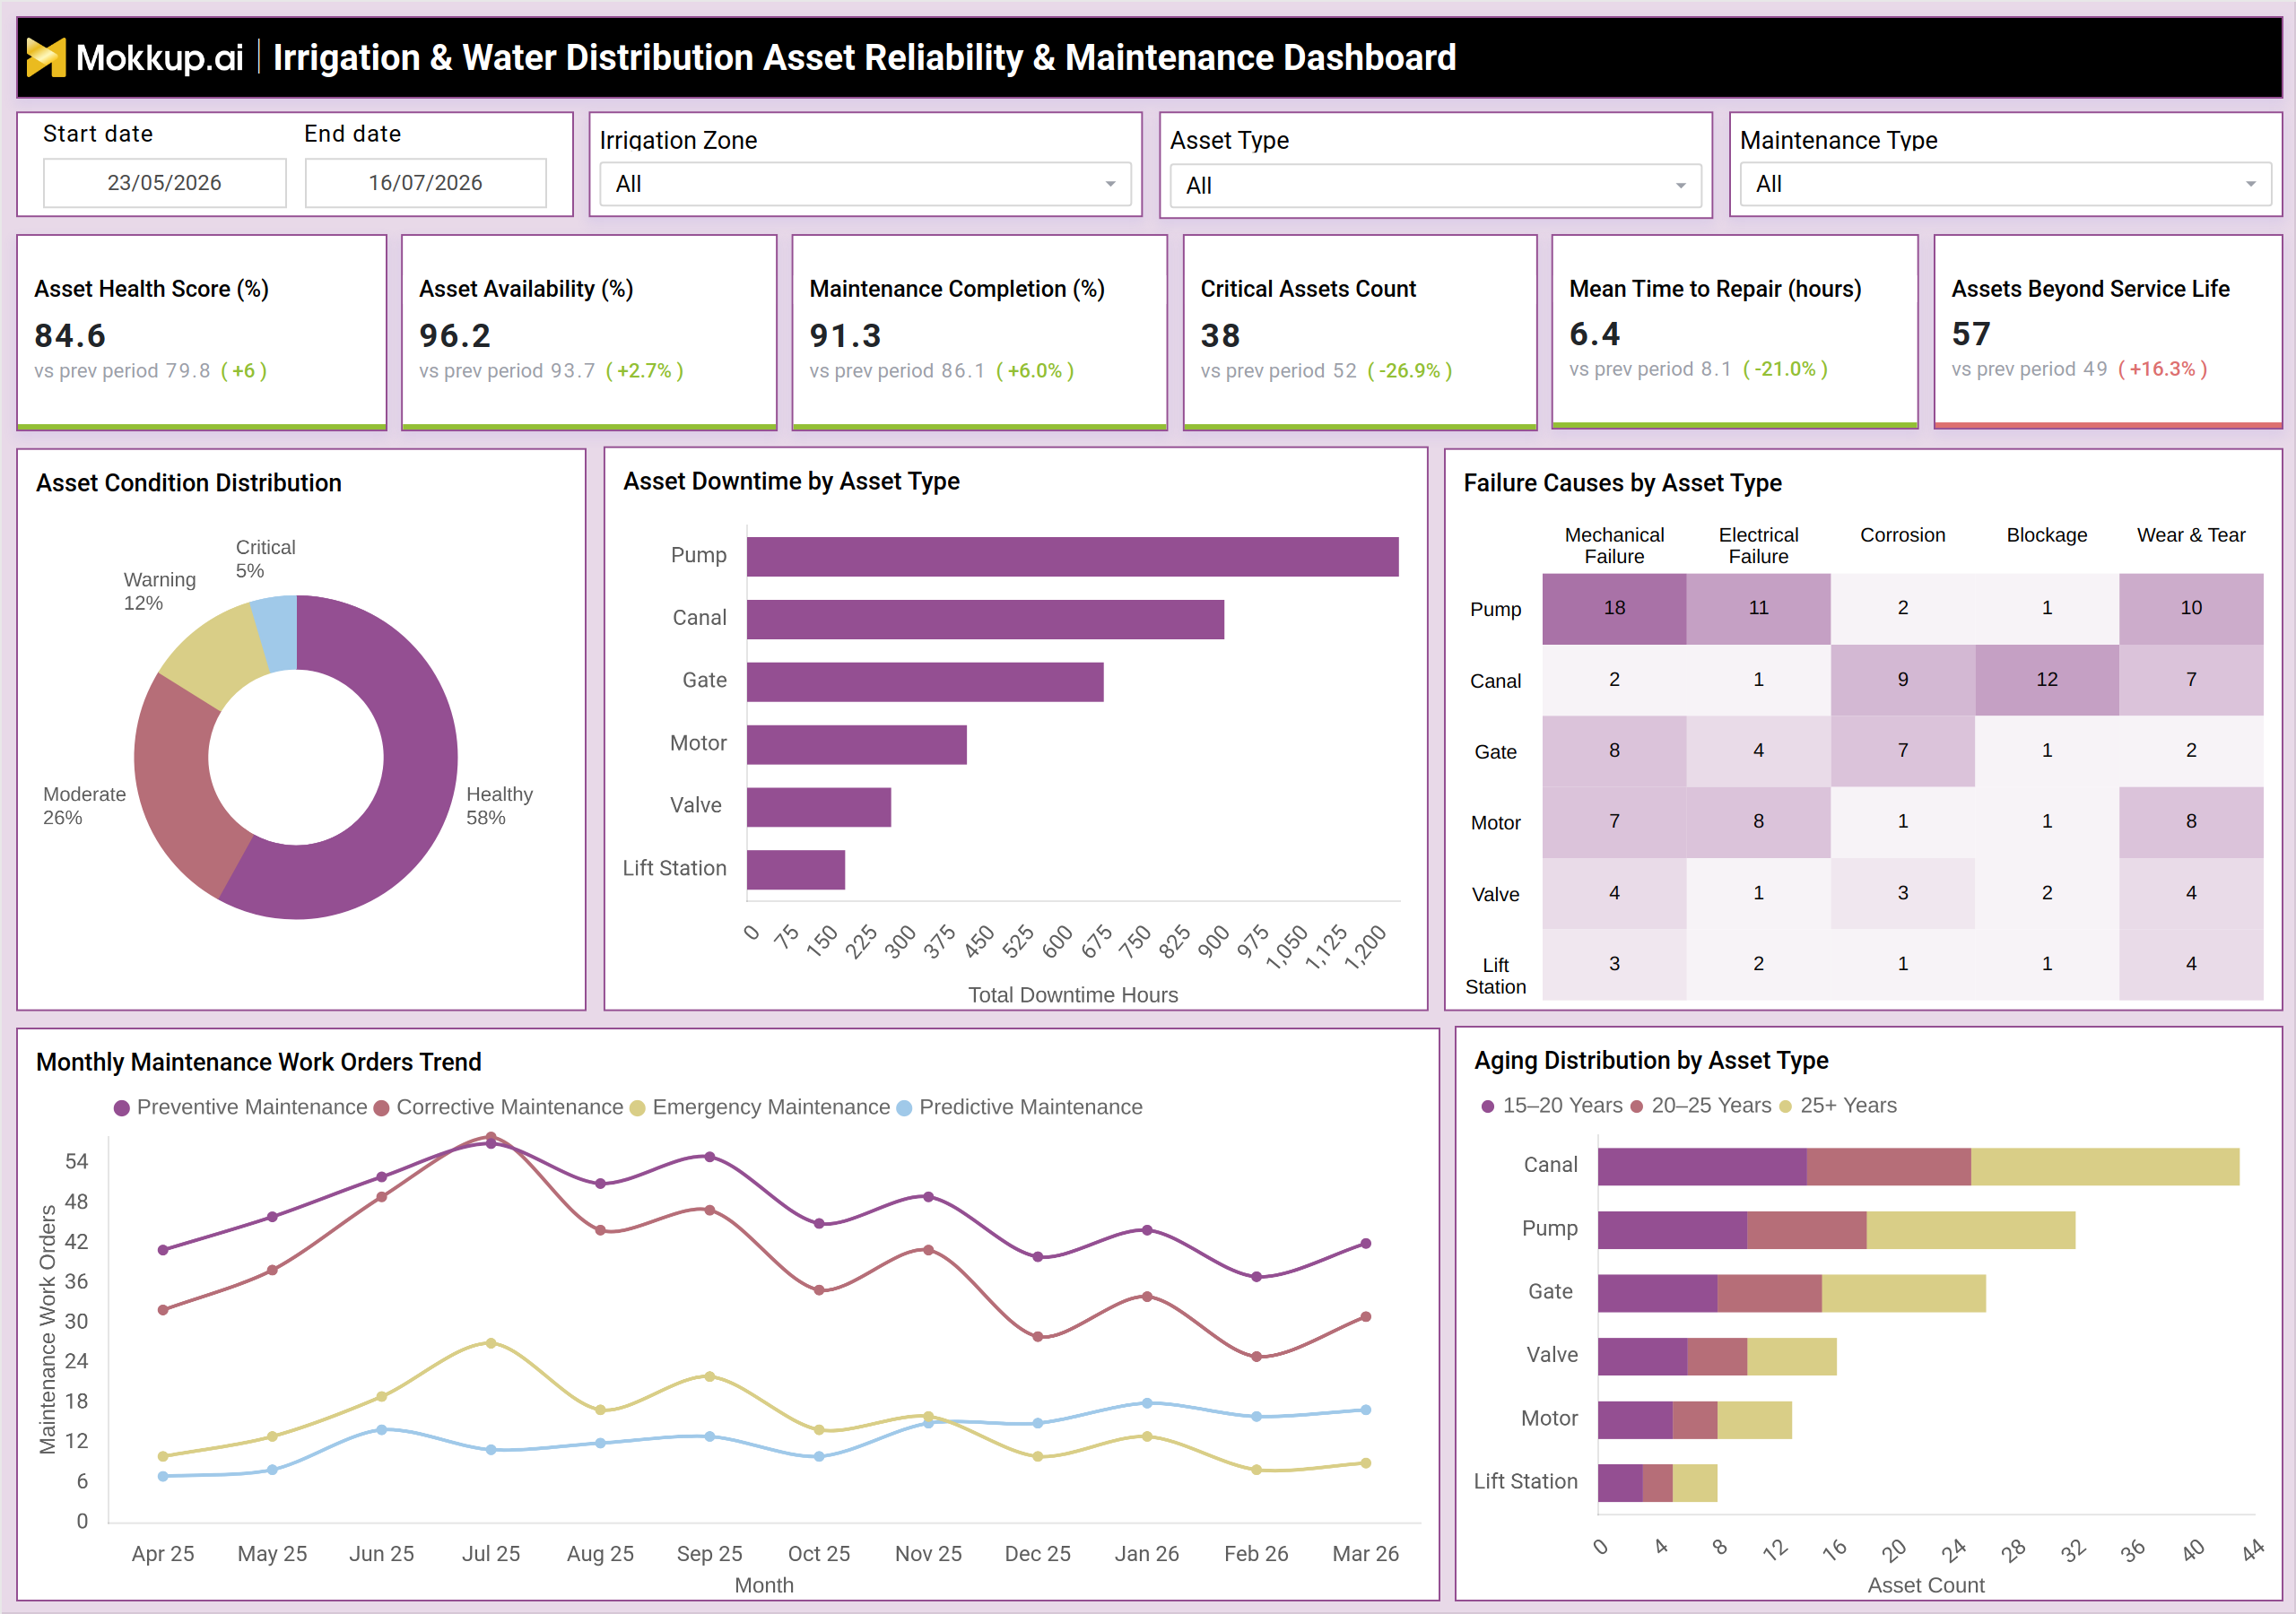
A typical irrigation infrastructure maintenance KPI dashboard includes KPI cards for asset health score, asset availability, maintenance completion rate, critical assets count, mean time to repair, and assets beyond service life. In the provided dashboard example, operators can evaluate overall network reliability while monitoring operational maintenance performance across irrigation zones. The dashboard includes asset condition distribution visuals showing healthy, moderate, warning, and critical asset conditions. Maintenance teams can quickly identify infrastructure requiring immediate intervention.
The water distribution network asset performance dashboard also provides downtime analysis by asset type, helping operators identify whether pumps, canals, gates, valves, motors, or lift stations contribute the highest operational downtime. Failure heatmaps further classify root causes such as mechanical failures, electrical faults, corrosion, blockage, and wear & tear. In addition, the dashboard acts as an irrigation asset failure and maintenance analytics dashboard by tracking preventive, corrective, emergency, and predictive maintenance trends over time. Aging distribution visuals also help infrastructure planners identify assets approaching end-of-life conditions, supporting capital replacement planning and maintenance prioritization.
How to Analyze Data in Irrigation & Water Distribution Asset Reliability & Maintenance Dashboard
Here is how you can analyze data from this dashboard:
- Improves Asset Visibility: Provides a comprehensive view of asset health, availability, and performance to support informed infrastructure management decisions.
- Enhances Operational Reliability: Monitors asset availability and reliability trends to minimize disruptions and ensure consistent irrigation system performance.
- Increases Maintenance Efficiency: Tracks maintenance completion rates and repair metrics to optimize maintenance workflows and improve resource utilization.
- Reduces Equipment Downtime: Identifies failure patterns and operational bottlenecks early, helping teams prevent prolonged outages and service interruptions.
- Supports Proactive Asset Management: Detects aging and high-risk assets before failure occurs, enabling timely maintenance, refurbishment, or replacement planning.
- Optimizes Capital Investment Planning: Uses asset lifecycle and aging analysis to prioritize infrastructure upgrades and allocate budgets more effectively.
- Improves Failure Analysis: Leverages failure heatmaps and root cause insights to address recurring equipment issues and enhance long-term asset reliability.
- Balances Preventive and Corrective Maintenance: Compares maintenance trends to encourage proactive maintenance strategies and reduce costly emergency repairs.
- Strengthens Risk Management: Identifies critical infrastructure components and emergency maintenance spikes to mitigate operational and financial risks.
- Enables Data-Driven Decision-Making: Delivers actionable insights into asset performance, maintenance effectiveness, and infrastructure health for better planning and execution.
- Prioritizes Replacement Strategies: Analyzes aging asset distribution to focus replacement efforts on the most vulnerable infrastructure components.
- Facilitates Performance Benchmarking: Compares reliability and maintenance performance across irrigation zones and maintenance categories to identify improvement opportunities and best practices.
Benefits of Irrigation & Water Distribution Asset Reliability & Maintenance Dashboard
The following are the benefits of using this dashboard:
- Improves Irrigation Infrastructure Reliability: Enhances the performance and dependability of irrigation assets by continuously monitoring asset health and maintenance activities.
- Reduces Operational Downtime: Identifies potential equipment failures early to minimize service interruptions and maintain uninterrupted water distribution operations.
- Enhances Preventive Maintenance Planning: Supports proactive maintenance scheduling based on asset condition and performance trends, reducing the likelihood of unexpected breakdowns.
- Improves Maintenance Response Efficiency: Tracks repair metrics such as MTTR to help maintenance teams respond faster and restore assets more effectively.
- Supports Predictive Maintenance Strategies: Uses asset performance data and failure patterns to predict potential issues before they impact operations.
- Identifies Critical Infrastructure Risks Early: Highlights high-risk and aging assets, enabling timely interventions to prevent costly failures and operational disruptions.
- Improves Asset Lifecycle Management: Provides visibility into asset age, condition, and service life to optimize maintenance, replacement, and investment decisions.
- Reduces Maintenance Costs and Emergency Repairs: Encourages proactive maintenance practices that lower repair expenses and reduce the frequency of emergency maintenance events.
- Supports Long-Term Infrastructure Replacement Planning: Analyzes aging asset distribution and performance trends to prioritize replacement projects and capital investments.
- Improves Operational Visibility Across Irrigation Networks: Centralizes asset and maintenance data to provide a comprehensive view of infrastructure performance across all irrigation zones.
- Enhances Asset Utilization and Performance: Ensures assets operate efficiently by monitoring availability, reliability, and maintenance effectiveness.
- Enables Data-Driven Maintenance Decision-Making: Delivers actionable insights that help utility managers optimize maintenance strategies, improve reliability, and maximize infrastructure value.
KPIs to Track in Irrigation & Water Distribution Asset Reliability & Maintenance Dashboard
The following key KPIs can be tracked by using this dashboard:
- Asset Health Score (%): Measures overall condition and operational health of infrastructure assets.
- Asset Availability (%): Tracks percentage of time assets remain operational and available.
- Maintenance Completion (%): Measures completion rate of planned maintenance activities.
- Critical Assets Count: Number of high-risk assets requiring immediate attention.
- Mean Time to Repair (hours): Tracks average time required to repair failed assets.
- Assets Beyond Service Life: Measures number of assets operating beyond recommended lifecycle limits.
Frequently Asked Questions
1. What is the purpose of an irrigation asset reliability dashboard?
The dashboard helps monitor infrastructure reliability, maintenance performance, downtime trends, and asset health across irrigation and water distribution systems.
2. Who uses this dashboard?
Water utilities, irrigation authorities, maintenance teams, operations managers, and infrastructure planning departments use this dashboard for asset monitoring and maintenance optimization.
3. Why is asset reliability monitoring important in irrigation systems?
Reliable irrigation infrastructure helps reduce water supply disruptions, minimize downtime, improve operational efficiency, and lower maintenance costs.