What is a Smart Meter and Billing Infrastructure Performance Dashboard?
The Smart Meter & Billing System Performance Dashboard template is a tailored solution designed for Electric Power Utilities professionals in IT & Digital Asset Management, aiming to ensure the optimal performance and reliability of smart meter and billing systems. The primary purpose of this dashboard wireframe is to provide insights into key performance indicators, enabling utilities to monitor system reliability, identify potential issues, and optimize overall system efficiency.
By leveraging this dashboard wireframe, utilities can guarantee accurate and timely customer billing, maintain high system uptime, and efficiently utilize resources, ultimately leading to enhanced customer satisfaction and reduced operational costs.
How to Create a Smart Meter and Billing Infrastructure Performance Dashboard
You don’t need to build your report from scratch; just start with a ready-to-use Smart Meter and Billing Infrastructure Performance dashboard template from Mokkup. Add in your data and export it however you like. Here’s how to do it:
1. Create or Log in to Your Mokkup Account
Start by signing up on Mokkup.ai using your email. If you already have an account, just log in, and you’ll be good to go.
2. Choose and Customize Your Dashboard Template
Find the Smart Meter And Billing Infrastructure Performance dashboard template in the Templates section. Use the drag-and-drop editor to adjust KPIs, edit filters, or add elements based on your data.
3. Export to Your BI Tool
Once your dashboard wireframe is ready, use the BI Tool Export feature to send it directly to Power BI or Tableau for further analysis and enhancements. You can also download the dashboard as a PDF, PNG, or JPEG, embed it on a platform, or invite your team to collaborate.
Note: This is a Pro template. You’ll need a Pro subscription on Mokkup to use and customize this dashboard wireframe. Upgrade anytime to unlock full access.
Smart Meter and Billing Infrastructure Performance Dashboard Example
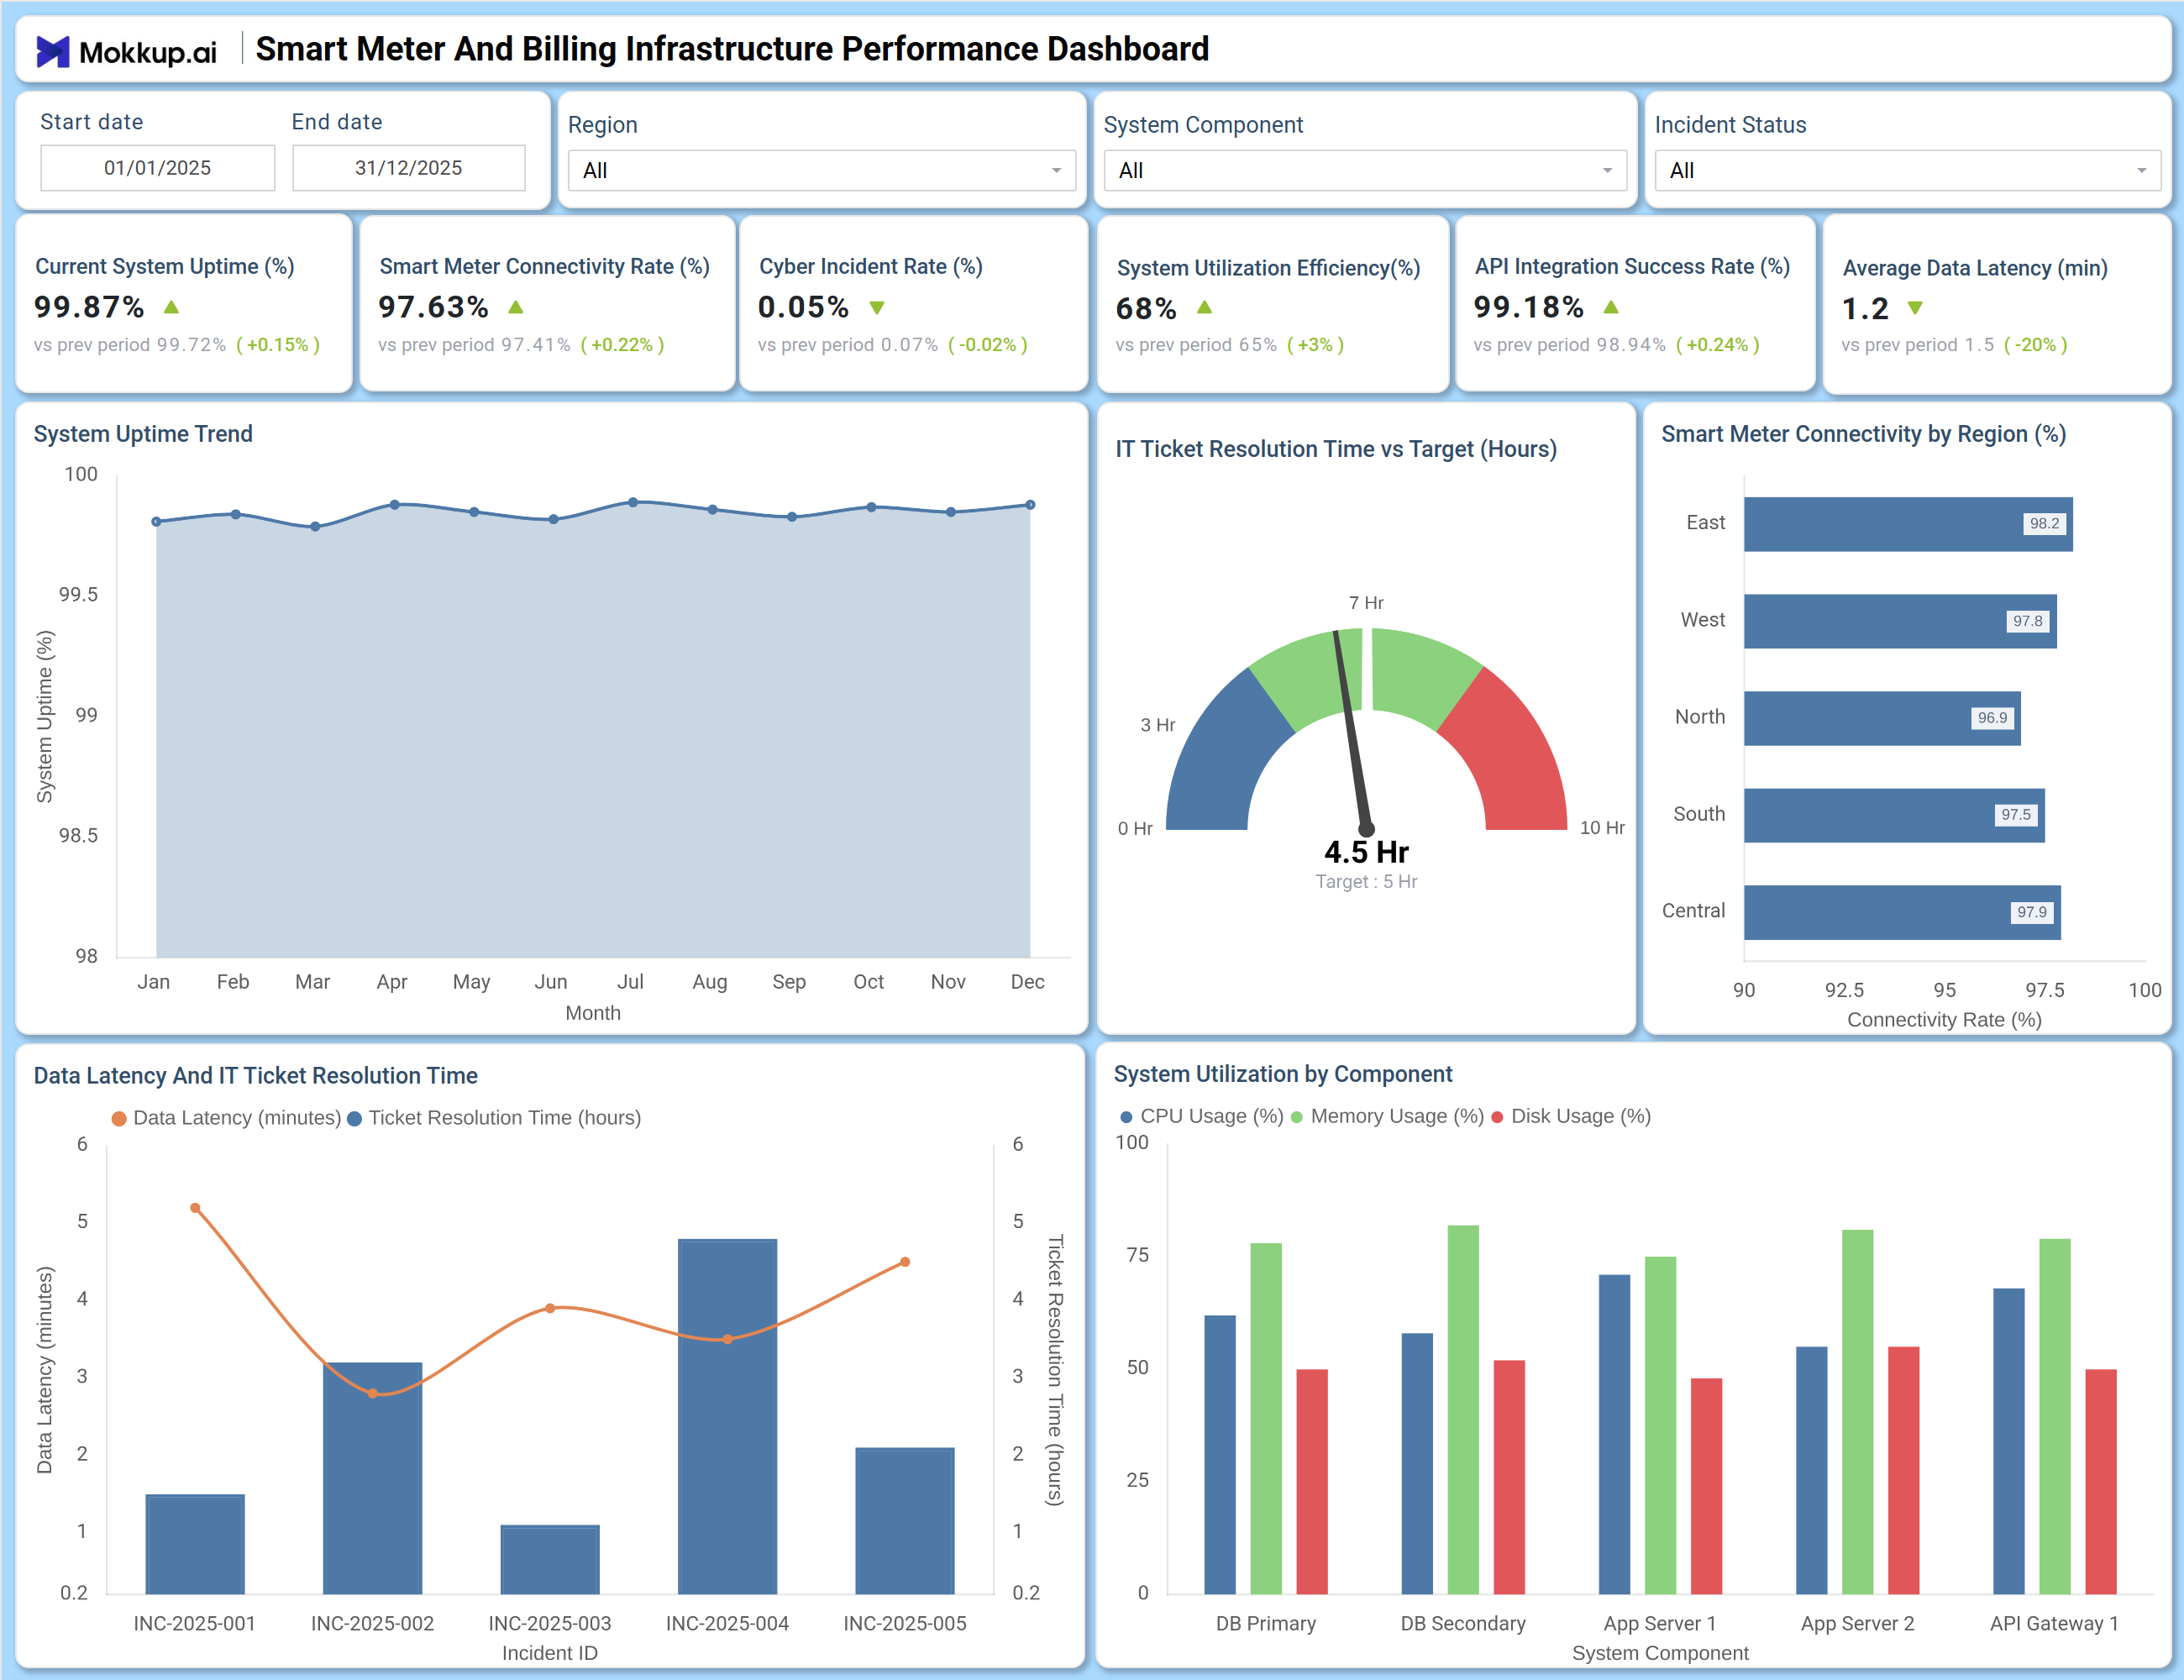
This dashboard displays a range of key KPIs that provide insights into the system's performance, including Smart Meter Connectivity Rate, System Uptime (%), Data Latency (Minutes), IT Ticket Resolution Time, Cyber Incident Rate, API Integration Success Rate, and System Utilization Efficiency. These metrics are presented through a combination of visualizations, including line charts, bar charts, and gauges.
For instance, the Smart Meter Connectivity Rate is displayed as a line chart, showing the trend over time, while the System Uptime (%) is represented as a gauge, providing a quick snapshot of the current status. By examining this dashboard wireframe, users can gain valuable insights into the performance of the smart meter and billing system. The dashboard provides a comprehensive view of the system's performance, enabling users to make data-driven decisions and take proactive steps to address any issues that may arise.
How to Analyze Data in a Smart Meter and Billing Infrastructure Performance Dashboard
Here is how you can analyze data from this dashboard:
- Evaluate Connectivity: Assess the Smart Meter Connectivity Rate to identify areas with low connectivity, allowing for targeted interventions to improve overall system performance and data accuracy.
- Monitor Uptime: Track the System Uptime (%) metric to detect any dips in system availability, enabling prompt investigation and resolution of issues to minimize downtime and ensure continuous service.
- Investigate Latency: Analyze the Data Latency (Minutes) metric to pinpoint potential bottlenecks in data transmission, facilitating optimization of data processing and reducing delays in billing and other critical operations.
- Assess Support Efficiency: Examine the IT Ticket Resolution Time to gauge the effectiveness of support teams in resolving technical issues, identifying opportunities for process improvements and enhanced customer satisfaction.
- Detect Security Threats: Analyze the Cyber Incident Rate to identify potential security vulnerabilities, enabling proactive measures to prevent future incidents and protect sensitive customer data.
- Optimize Integration: Measure the API Integration Success Rate to evaluate the effectiveness of system integrations, identifying areas for improvement to streamline data exchange and enhance overall system performance.
Benefits of a Smart Meter and Billing Infrastructure Performance Dashboard
The following are the benefits of using this dashboard:
- Enhanced Operational Efficiency: Optimize smart meter and billing system performance with real-time visibility into key metrics such as System Uptime, Data Latency, and System Utilization Efficiency, enabling utilities to identify areas of improvement and streamline their operations.
- Improved Customer Satisfaction: Reduce IT Ticket Resolution Time and increase the overall reliability of the smart meter and billing system, resulting in fewer customer complaints and increased satisfaction with the utility's services.
- Proactive Cybersecurity: Monitor and respond to potential cyber threats in real-time with metrics such as Cyber Incident Rate, enabling utilities to protect their critical infrastructure and prevent data breaches that could compromise customer information.
- Increased Smart Meter Connectivity: Track and optimize Smart Meter Connectivity Rates, allowing utilities to identify and resolve connectivity issues promptly, and ensure that customers' smart meters are always connected and providing accurate usage data.
- Seamless Integration: Ensure successful API Integration with other systems, such as customer information systems or grid management systems, with metrics like API Integration Success Rate, enabling utilities to leverage the full potential of their smart meter and billing system.
- Data-Driven Investment: Make informed decisions about IT investments and resource allocation with insights from the dashboard, such as System Uptime and Data Latency, allowing utilities to prioritize initiatives that will have the greatest impact on their operations and customer satisfaction.
KPIs to Track in a Smart Meter and Billing Infrastructure Performance Dashboard
The following key KPIs can be tracked by using this dashboard:
- Smart Meter Connectivity Rate: Percentage of meters actively connected and transmitting data.
- System Uptime: Percentage of time the smart meter and billing system remains operational and available.
- Data Latency: Average time taken for meter data to be processed and reflected in the billing system.
- IT Ticket Resolution Time: Average time required to resolve system related IT issues.
- Cyber Incident Rate: Number of security incidents per defined meter base within a given period.
- API Integration Success Rate: Percentage of successful integrations with external systems.
- System Utilization Efficiency: Percentage of system resources effectively used to maintain optimal performance.
Frequently Asked Questions
Q1. What is a Smart Meter and Billing Infrastructure Performance Dashboard?
It is a monitoring dashboard designed for electric utilities to track smart meter connectivity, billing accuracy, system uptime, latency, and cybersecurity performance in one centralized view.
Q2. What key metrics does this dashboard track?
It tracks KPIs such as Smart Meter Connectivity Rate, System Uptime, Data Latency, IT Ticket Resolution Time, Cyber Incident Rate, API Integration Success Rate, and System Utilization Efficiency.
Q3. How does this dashboard benefit utility companies?
It helps utilities improve system reliability, ensure accurate billing, reduce downtime, strengthen cybersecurity, and make data driven IT and operational decisions.