What is the Electric Power Retail Billing Operations & Revenue Assurance Dashboard?
An Electric Power Retail Billing Operations & Revenue Assurance Dashboard is a centralized analytics solution designed to monitor, control, and optimize retail electricity billing processes. The dashboard also functions as a centralized platform for electric power billing and collections analytics, enabling utilities to monitor billed revenue, outstanding amounts, and billing performance across retail customer segments. It provides visibility into billing accuracy, unbilled energy, invoice disputes, revenue leakage, and complaint resolution timelines. This dashboard supports utility finance, billing, and operations teams by combining billing system data, meter readings, tariff structures, and customer records into a single view. As a revenue assurance dashboard for electric power utilities, it helps identify gaps between energy delivered and revenue billed, ensuring compliance, accuracy, and financial stability in retail electricity operations.
How to Create an Electric Power Retail Billing Operations & Revenue Assurance Dashboard
You don’t need to build your report from scratch, just start with a ready-to-use dashboard template from Mokkup. Add in your data and export it however you like. Here’s how to do it:
1. Create or Log in to Your Mokkup Account
Start by signing up on Mokkup.ai using your email. If you already have an account, just log in, and you’ll be good to go.
2. Choose and Customize Your Dashboard Template
Find the Electric Power Retail Billing Operations & Revenue Assurance Dashboard template in the Templates section. Use the drag-and-drop editor to adjust KPIs, edit filters, or add elements based on your data.
3. Export to Your BI Tool
Once your dashboard wireframe is ready, use the BI Tool Export feature to send it directly to Power BI or Tableau for further analysis and enhancements. You can also download the dashboard as a PDF, PNG, or JPEG, embed it on a platform, or invite your team to collaborate.
Note: This is a Pro template. You’ll need a Pro subscription on Mokkup to use and customize this dashboard wireframe. Upgrade anytime to unlock full access.
Electric Power Retail Billing Operations & Revenue Assurance Dashboard Example
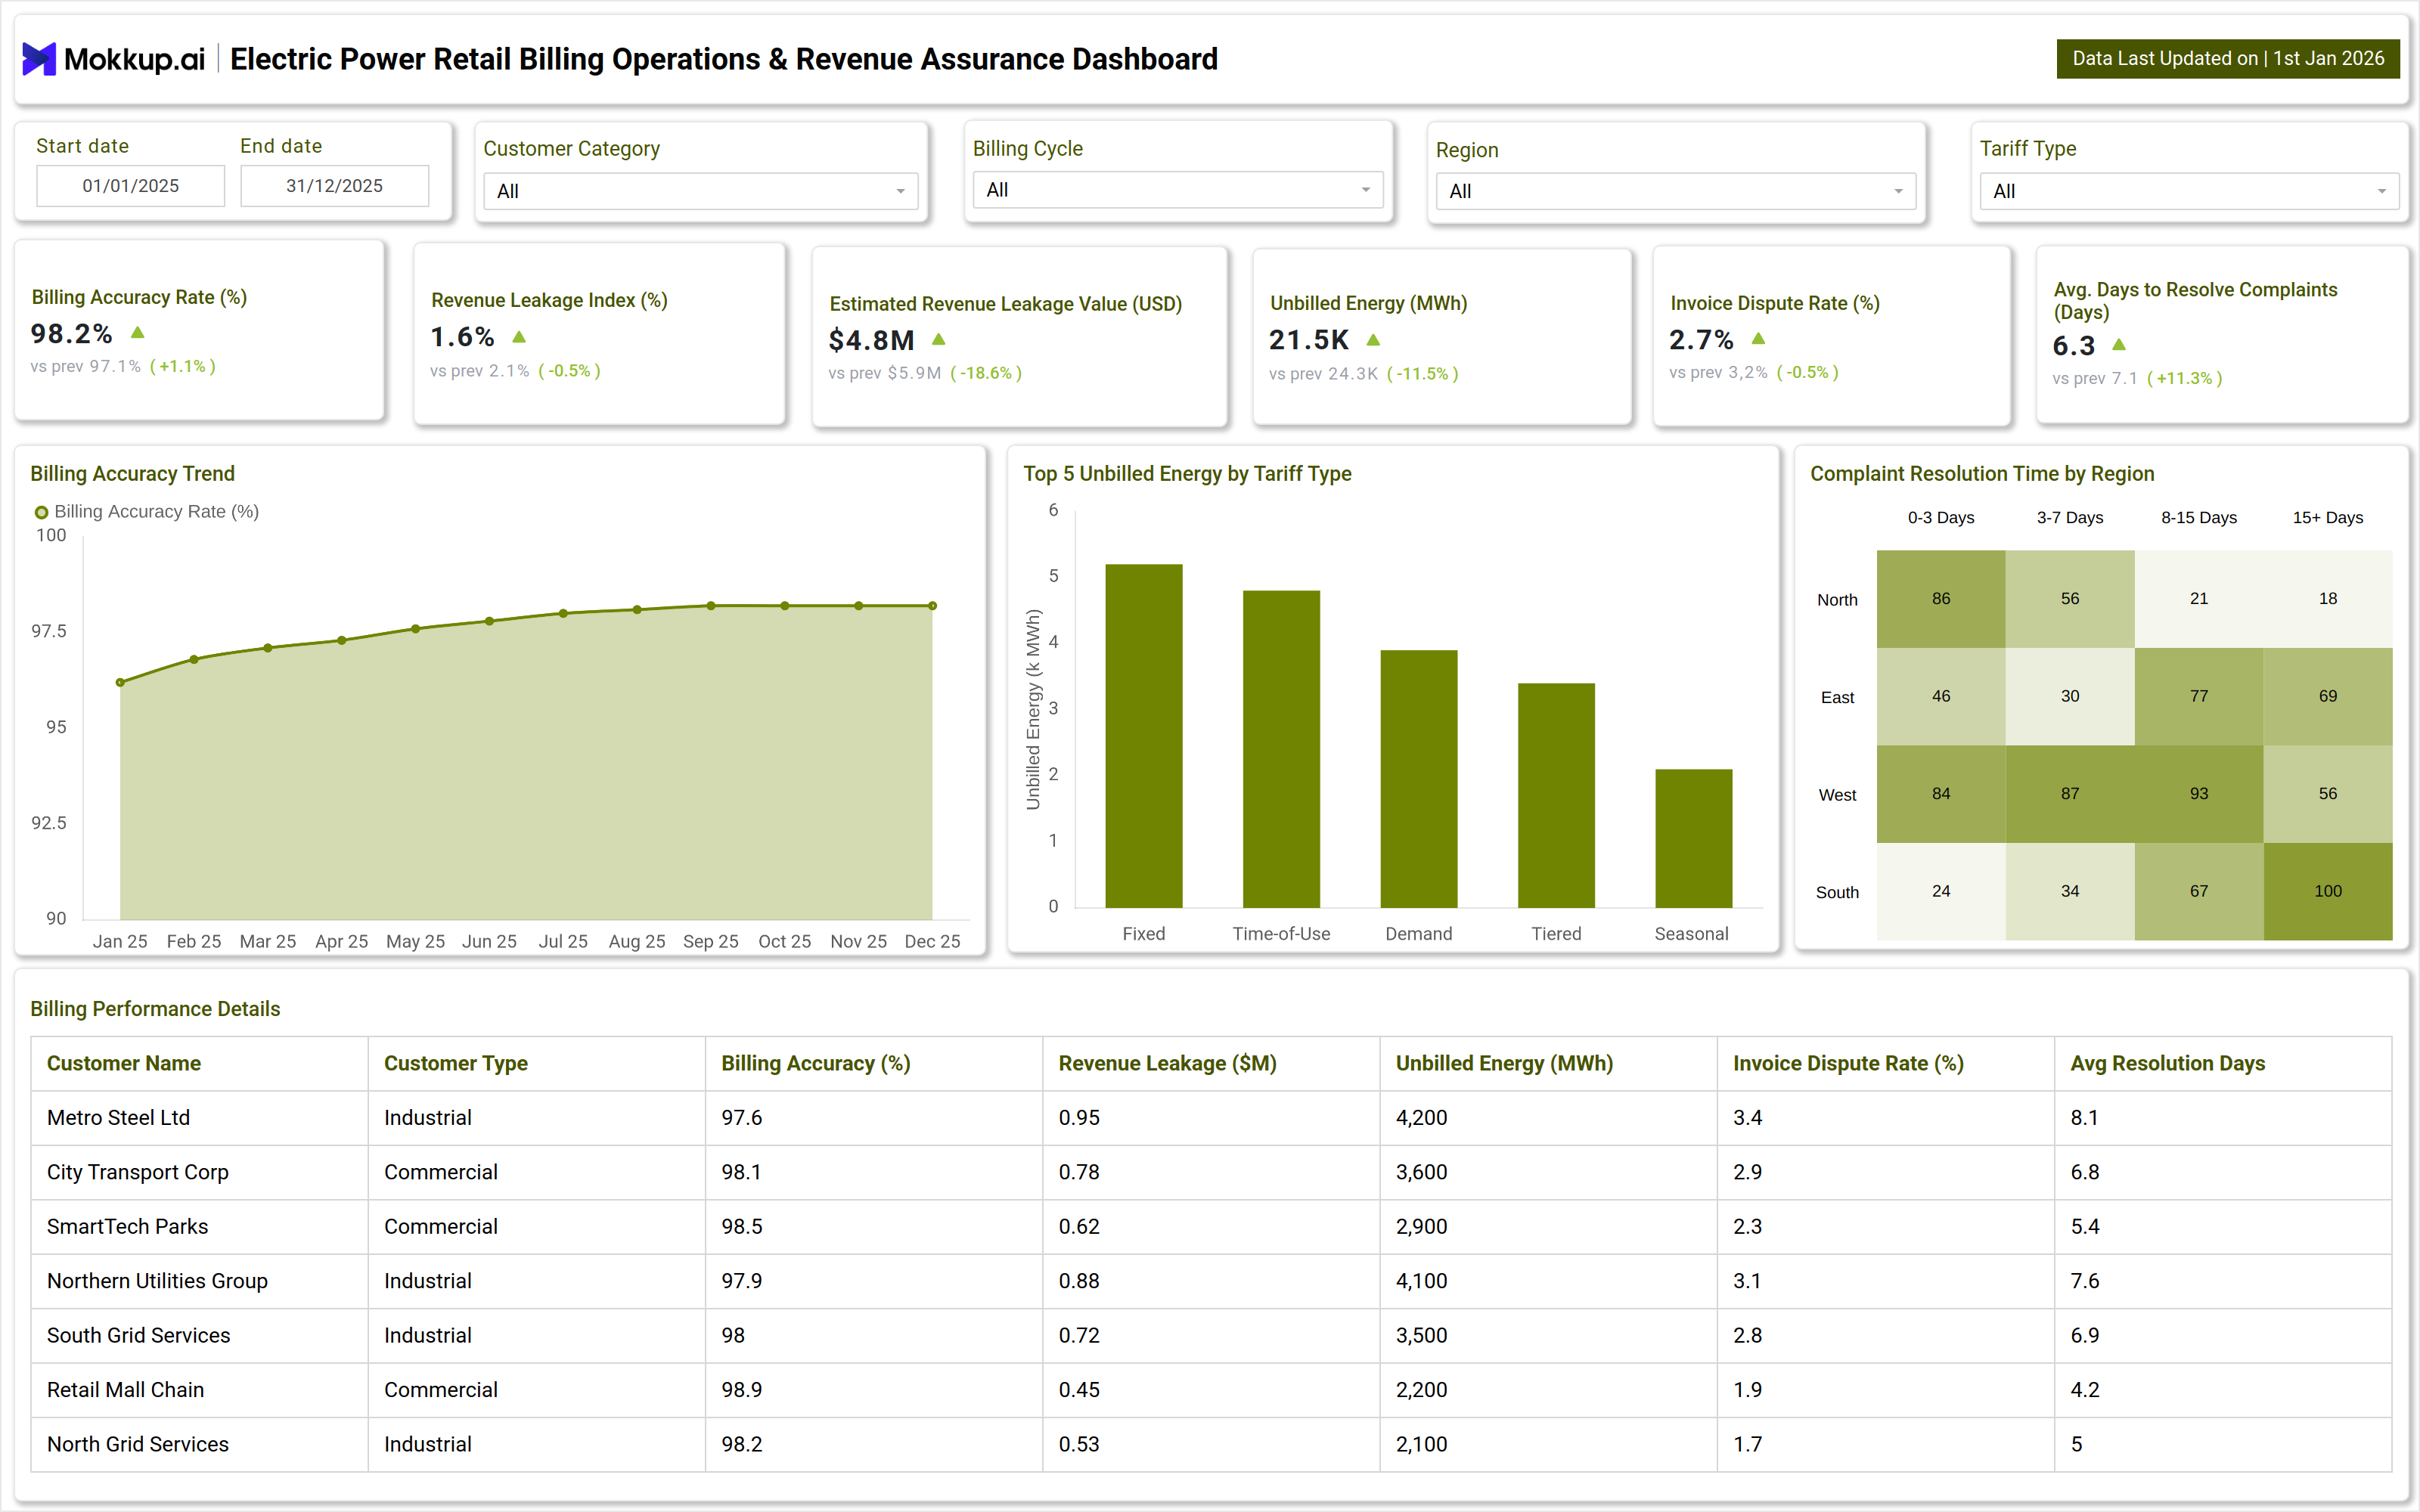
A typical dashboard view includes global filters such as billing cycle, customer category, tariff type, region, and date range. Key metrics, including billing accuracy rate, revenue leakage index, estimated revenue leakage value, unbilled energy, invoice dispute rate, and average complaint resolution days, are displayed as KPI cards. Trend visuals track billing accuracy improvements over time, while bar charts highlight unbilled energy by tariff type. Heatmaps show complaint resolution performance across regions and time buckets. Detailed tables provide customer-level billing accuracy, revenue leakage, and dispute metrics, enabling accurate analysis. This electric power revenue leakage analysis dashboard allows retail utilities to move from reactive billing fixes to proactive revenue protection. By combining billing accuracy, dispute rates, and revenue leakage metrics, the dashboard delivers actionable insights for both electric power billing and collections analytics and revenue assurance teams.
How to Analyze Data in Electric Power Retail Billing Operations & Revenue Assurance Dashboard
Here is how you can analyze data from this dashboard:
- Review Billing Accuracy Rate Trends: Analyze changes in billing accuracy over time to evaluate the effectiveness of meter data validation and billing rule configurations.
- Monitor Revenue Leakage Index: Track discrepancies between billed revenue and expected revenue to quickly detect and investigate leakage risks.
- Analyze Estimated Revenue Leakage Value: Quantify potential financial exposure from leakage and prioritize corrective actions based on business impact.
- Compare Unbilled Energy by Tariff Type: Identify high-risk tariff structures, such as time-of-use or demand-based billing, that are more prone to leakage.
- Track Invoice Dispute Rate: Evaluate billing clarity and customer communication by monitoring how frequently invoices are disputed.
- Assess Complaint Resolution Time by Region: Measure average days to resolve customer complaints to uncover regional operational bottlenecks.
- Drill Down into Customer-Level Performance: Analyze individual accounts to isolate high-impact customers affecting overall revenue assurance.
Benefits of Electric Power Retail Billing Operations & Revenue Assurance Dashboard.
The following are the benefits of using this dashboard:
- Improve Billing Accuracy Monitoring: Track billing accuracy across customer segments to quickly identify issues and maintain consistent revenue capture.
- Reduce Revenue Leakage: Detect billing and meter data anomalies early to prevent losses and minimize financial risk.
- Enhance Billing Process Efficiency Reporting: Provide operational teams with clear dashboards to monitor performance and streamline billing workflows.
- Support Faster Dispute Resolution: Surface root causes of disputes quickly to reduce resolution time and improve customer satisfaction.
- Enable Proactive Regulatory Compliance: Ensure billing practices align with tariff structures and regulatory requirements before issues escalate.
- Provide Accurate Revenue Forecasting Inputs: Supply finance teams with reliable billing and collection data to improve forecasting accuracy.
- Strengthen Revenue Assurance Analytics: Deliver comprehensive analytics that help retail utilities protect and optimize revenue.
KPIs to Track in Electric Power Retail Billing Operations & Revenue Assurance Dashboard
The following key KPIs can be tracked by using this dashboard:
- Billing Accuracy Rate (%) - Measures how accurately customer bills are generated compared to actual energy consumption and tariff rules.
- Revenue Leakage Index (%) - Indicates the percentage of potential revenue lost due to billing errors, unbilled energy, or process gaps.
- Estimated Revenue Leakage Value (USD) - Shows the monetary value of revenue at risk from billing inaccuracies and unbilled consumption.
- Unbilled Energy (MWh) - Represents the total volume of electricity delivered to customers but not yet billed.
- Invoice Dispute Rate (%) - Tracks the proportion of customer invoices that result in disputes or billing complaints.
- Average Days to Resolve Complaints - Measures the average time taken to close billing-related customer complaints.
- Billing Accuracy Trend (Monthly) - Displays how billing accuracy changes over time to assess process improvements or recurring issues.
- Unbilled Energy by Tariff Type - Highlights which tariff structures contribute most to unbilled or delayed billing.
- Complaint Resolution Time by Region - Compares billing complaint resolution performance across different service regions.
Frequently Asked Questions
1. What is revenue assurance in electric power retail utilities?
Revenue assurance focuses on ensuring that all energy delivered to customers is accurately billed and collected, minimizing losses due to billing errors, system gaps, or process inefficiencies.
2. Who should use a retail billing operations dashboard?
Billing managers, revenue assurance teams, finance leaders, customer operations teams, and utility executives benefit from this dashboard.
3. How does this dashboard help reduce revenue leakage?
By identifying unbilled energy, billing inaccuracies, and tariff mismatches early, utilities can take corrective actions before revenue loss escalates.
4. Can this dashboard support multiple tariff types?
Yes. It supports fixed, time-of-use, demand-based, tiered, and seasonal tariffs for detailed billing performance analysis.
5. Is this dashboard suitable for large retail electricity providers?
Yes. It is designed to scale across regions, customer categories, and billing cycles, making it suitable for both mid-size and large retail utilities.