What is a Security Personnel Work Schedule & Performance Dashboard?
A Security Personnel Work Schedule & Performance Dashboard template is a centralized analytics tool designed to track, optimize, and report on security staff efficiency, shift management, and operational performance. This dashboard consolidates data from scheduling systems, incident reports, patrol logs, and productivity metrics into a single interface, enabling security managers to monitor workforce readiness, response times, and compliance. By integrating shift scheduling, incident tracking, and performance analytics, this dashboard helps organizations improve security operations, reduce inefficiencies, and ensure regulatory adherence in commercial properties, biomedical facilities, and high-security environments.
Unlike manual spreadsheets or disjointed reporting tools, a customizable security personnel performance reports dashboard provides automated insights into labor distribution, incident trends, and staff productivity. It allows managers to identify understaffed shifts, track response times, and assess individual guard performance.
How to Create a Security Personnel Work Schedule & Performance Dashboard
You don’t need to build your report from scratch, just start with a ready to use Security Personnel Work Schedule & Performance dashboard template from Mokkup. Add in your data and export it however you like. Here’s how to do it:
1. Create or Log in to Your Mokkup Account
Start by signing up on Mokkup.ai using your email. If you already have an account, just log in, and you’ll be good to go.
2. Choose and Customize Your Dashboard Template
Find the Security Personnel Work Schedule & Performance Dashboard template in the Templates section. Use the drag and drop editor to adjust KPIs, edit filters, or add elements based on your data.
3. Export to Your BI Tool
Once your dashboard wireframe is ready, use the BI Tool Export feature to send it directly to Power BI or Tableau for further analysis and enhancements. You can also download the dashboard as a PDF, PNG, or JPEG, embed it on a platform, or invite your team to collaborate.
Note: This is a Pro template. You’ll need a Pro subscription on Mokkup to use and customize this dashboard wireframe. Upgrade anytime to unlock full access.
Security Personnel Work Schedule & Performance Dashboard Example
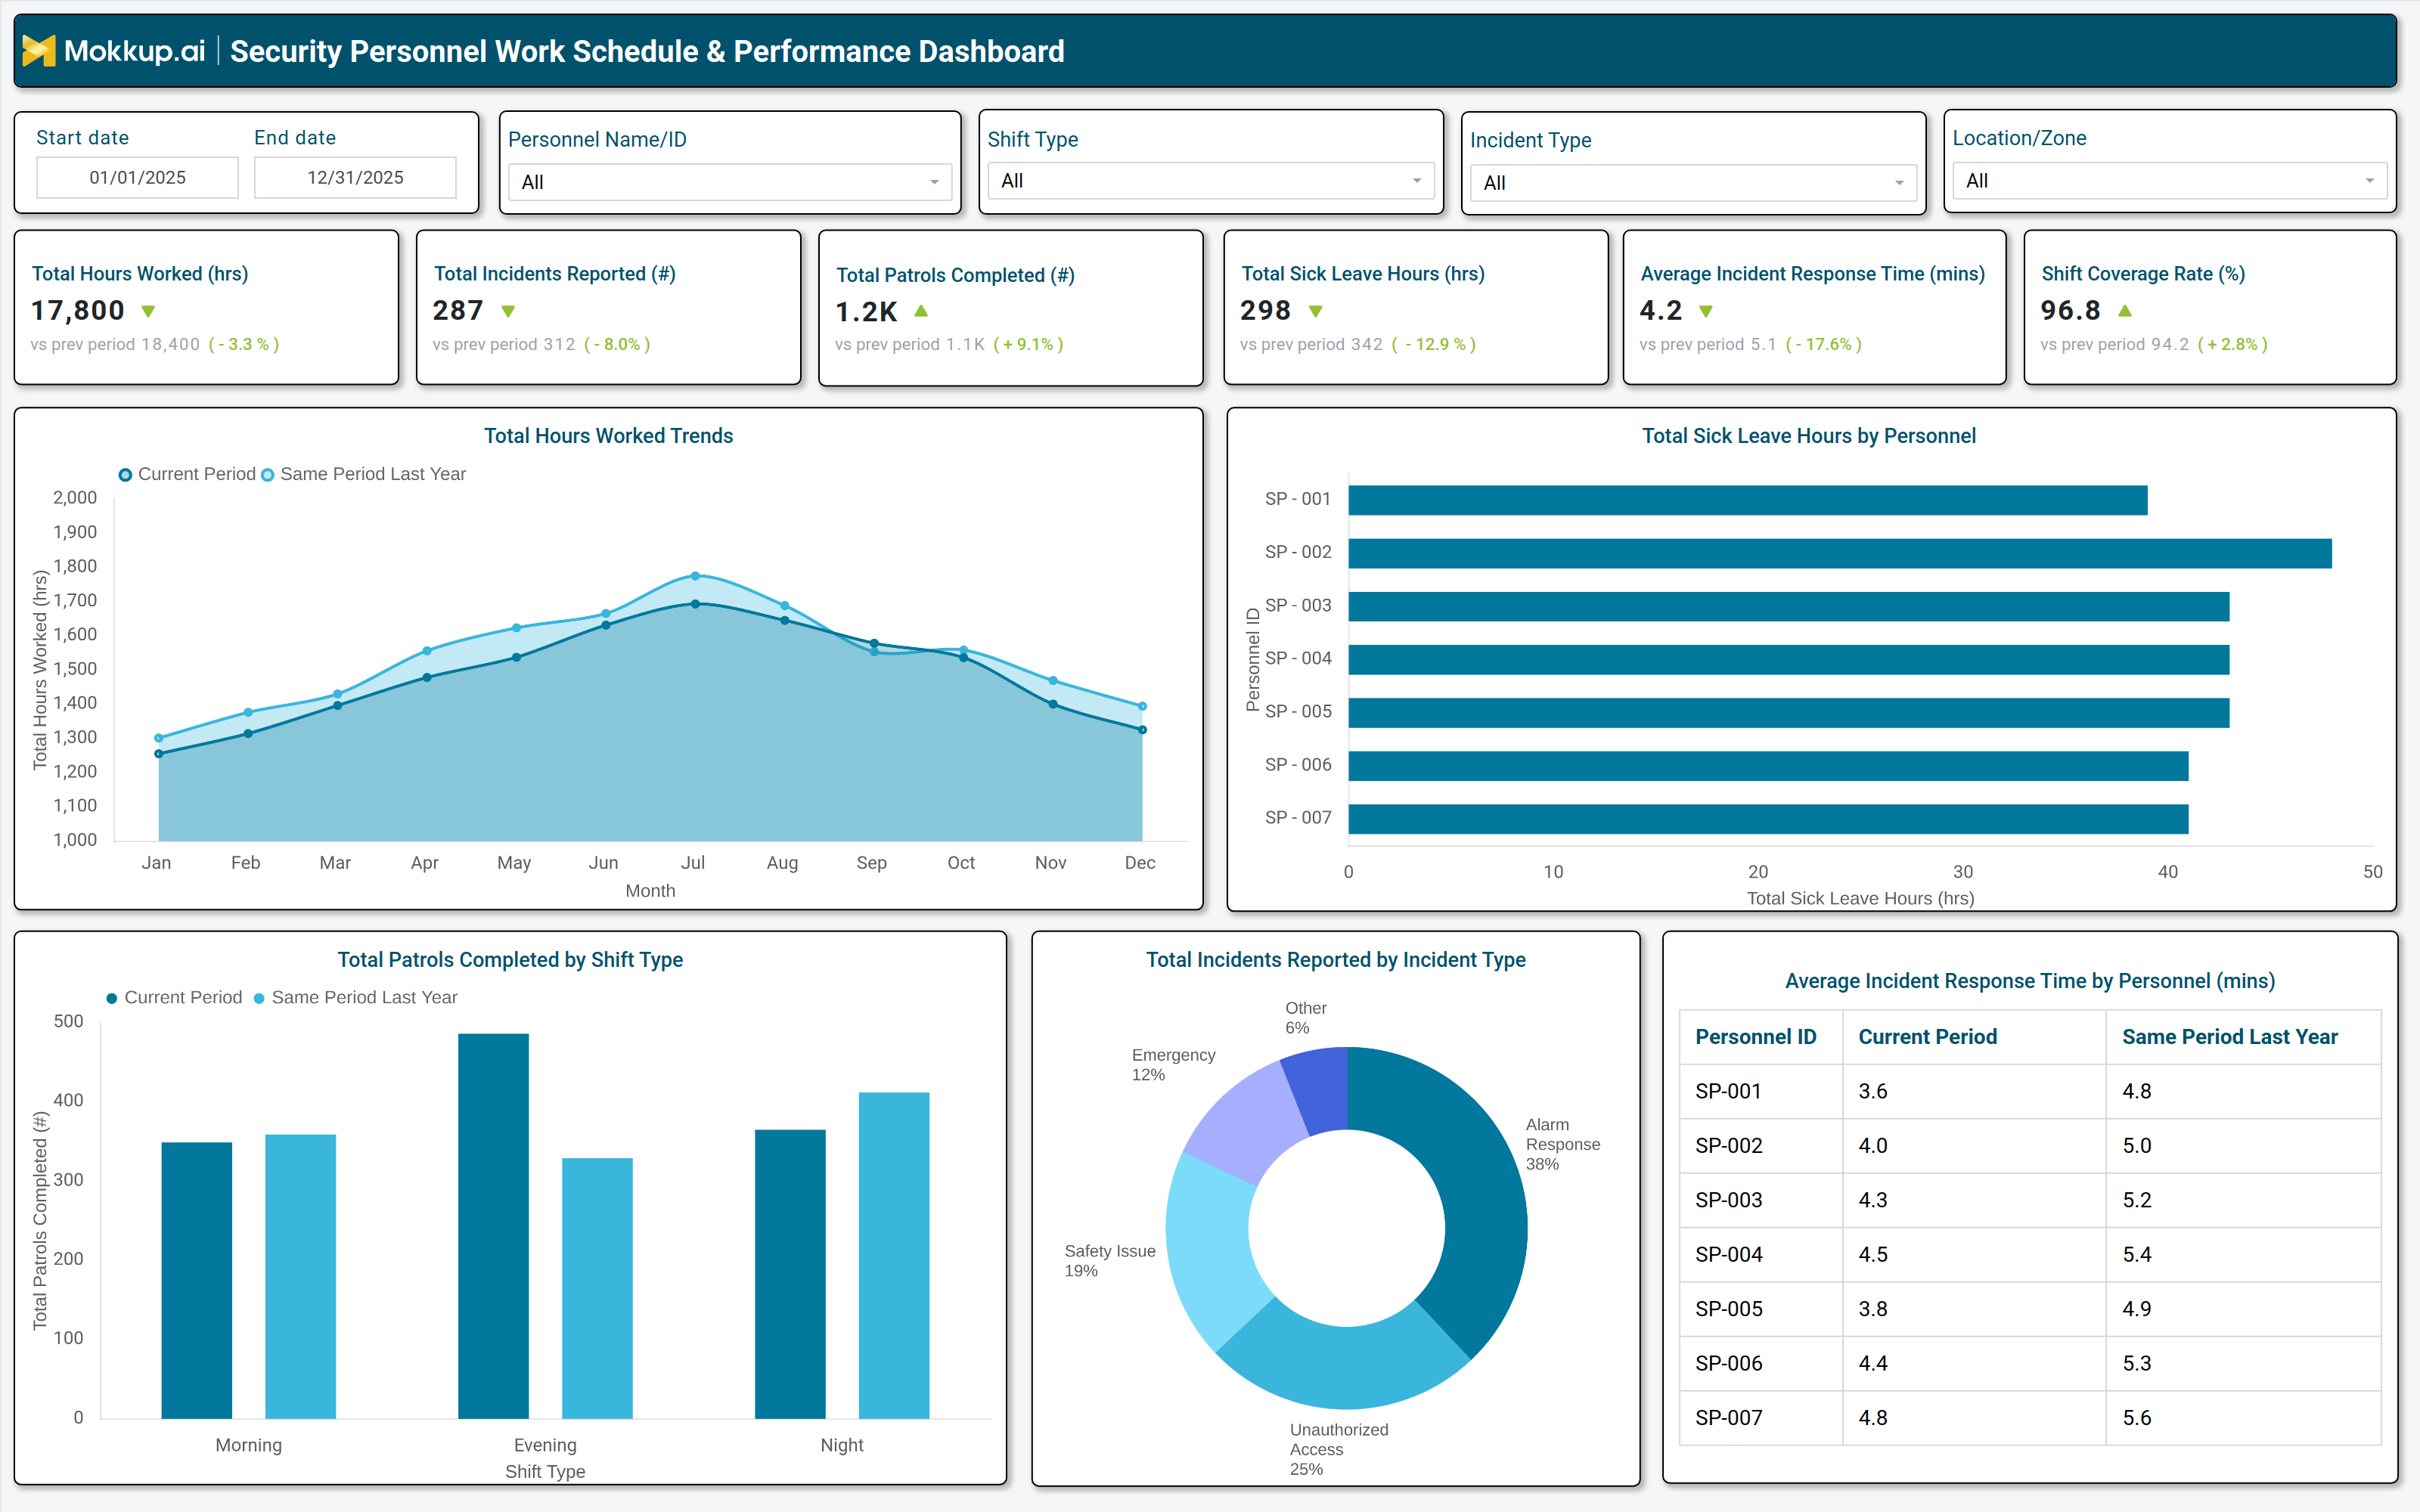
A well-structured Shift management system for the commercial security guard dashboard includes interactive filters for date ranges, personnel IDs, shift types, incident categories, and location zones, allowing managers to customize views based on operational needs. Key performance tiles display total hours worked, incidents reported, patrols completed, sick leave hours, average incident response time, and shift coverage rates, with comparisons against previous periods to highlight trends. Trend charts track monthly hours worked and patrols completed by shift type, while a bar graph breaks down sick leave hours by personnel, helping identify staffing gaps.
A pie chart categorizes incidents by type, such as unauthorized access, alarms, safety issues, and emergencies, providing insights into recurring security threats. Additionally, a table compares incident response times across security personnel, enabling performance benchmarking. Together, these components create a comprehensive security workforce management system that enhances operational efficiency, reduces risks, and ensures optimal staffing levels.
How to Analyze Data in a Security Personnel Work Schedule & Performance Dashboard
Here is how you can analyze data from this biomedical facility security staff scheduling solutions dashboard:
- Labor Distribution Review: Review total hours worked to assess workload balance and identify overtime trends.
- Incident Pattern Analysis: Track incidents reported by type to detect recurring threats and training gaps.
- Patrol Coverage Monitoring: Monitor patrols completed by shift to evaluate coverage consistency and workload balance.
- Absenteeism Trends: Analyze sick leave patterns to anticipate staffing shortages and adjust schedules proactively.
- Shift Coverage Compliance: Compare shift coverage rates against targets to ensure adequate security presence.
- Response Time Evaluation: Measure incident response times to assess guard efficiency and identify improvement areas.
- Individual Performance Assessment: Evaluate performance by personnel to recognize high performers and address gaps.
- Operational Trend Comparison: Compare current data with historical periods to detect improvements or declines in security operations.
Benefits of a Security Personnel Work Schedule & Performance Dashboard
The following are the benefits of using this security staff productivity tracking tools dashboard:
- Efficient Scheduling: Improves shift planning by automating workforce allocation and reducing conflicts.
- Enhanced Incident Tracking: Strengthens monitoring of security incidents and resolution timelines.
- Labor Cost Optimization: Reduces unnecessary overtime through better staffing control.
- Performance Accountability: Boosts productivity using clear performance benchmarks.
- Regulatory Compliance: Maintains accurate patrol and incident logs for compliance requirements.
- Training Identification: Highlights training needs through response time and incident trend analysis.
- Data Driven Decisions: Supports informed resource allocation and risk management.
- Centralized Operations View: Provides a single view of security workforce performance and scheduling.
KPIs to Track in a Security Personnel Work Schedule & Performance Dashboard
The following key KPIs can be tracked by using this best security personnel shift scheduling software:
- Total Hours Worked (hrs): Measures overall labor utilization and identifies overtime trends.
- Total Incidents Reported (count): Tracks security breaches, alarms, and safety issues to assess risk levels.
- Total Patrols Completed (count): Evaluates guard activity and ensures coverage across assigned zones.
- Total Sick Leave Hours (hrs): Monitors absenteeism to predict staffing shortages and adjust schedules.
- Average Incident Response Time (mins): Measures guard efficiency in addressing security threats.
- Shift Coverage Rate (%): Ensures adequate staffing levels to maintain security standards.
Frequently Asked Questions
Q1. What is a Security Personnel Work Schedule & Performance Dashboard used for?
It tracks security staff scheduling, incident response, and performance metrics to optimize workforce efficiency and compliance.
Q2. Who should use a Security Personnel Work Schedule & Performance Dashboard?
Security managers, facility supervisors, and operations leaders in commercial properties, biomedical labs, and high-security environments.
Q3. Can this dashboard be customized for different industries?
Yes, it can be tailored for commercial security, biomedical facilities, corporate offices, and government sites.