What is a Workforce Diversity & Gender Composition Executive Overview?
A Workforce Diversity & Gender Composition Executive Overview is a strategic analytics dashboard that provides leadership with data-driven insights into workforce demographics, gender distribution, and diversity trends. This executive-level report consolidates key metrics such as gender ratios, representation rates, and non-binary employee counts across departments, locations, and time periods.
By leveraging workforce diversity metrics for executive reporting, organizations can assess progress toward DEI reporting for leadership decision-making, identify gaps in gender balance, and align hiring and retention strategies with business objectives. The dashboard serves as a diversity analytics tool for C-suite insights, enabling executives to track workforce gender balance trends and measure the impact of inclusion initiatives.
How to Create a Workforce Diversity & Gender Composition Executive Overview
You don’t need to build your report from scratch, just start with a ready-to-use Workforce Diversity & Gender Composition Executive Overview dashboard template from Mokkup. Add in your data and export it however you like. Here’s how to do it:
1. Create or Log in to Your Mokkup Account
Start by signing up on Mokkup.ai using your email. If you already have an account, just log in, and you’ll be good to go.
2. Choose and Customize Your Dashboard Template
Find the Workforce Diversity & Gender Composition Executive Overview template in the Templates section. Use the draganddrop editor to adjust KPIs, edit filters, or add elements based on your data.
3. Export to Your BI Tool
Once your dashboard wireframe is ready, use the BI Tool Export feature to send it directly to Power BI or Tableau for further analysis and enhancements. You can also download the dashboard as a PDF, PNG, or JPEG, embed it on a platform, or invite your team to collaborate.
Note: This is a Pro template. You’ll need a Pro subscription on Mokkup to use and customize this dashboard wireframe. Upgrade anytime to unlock full access.
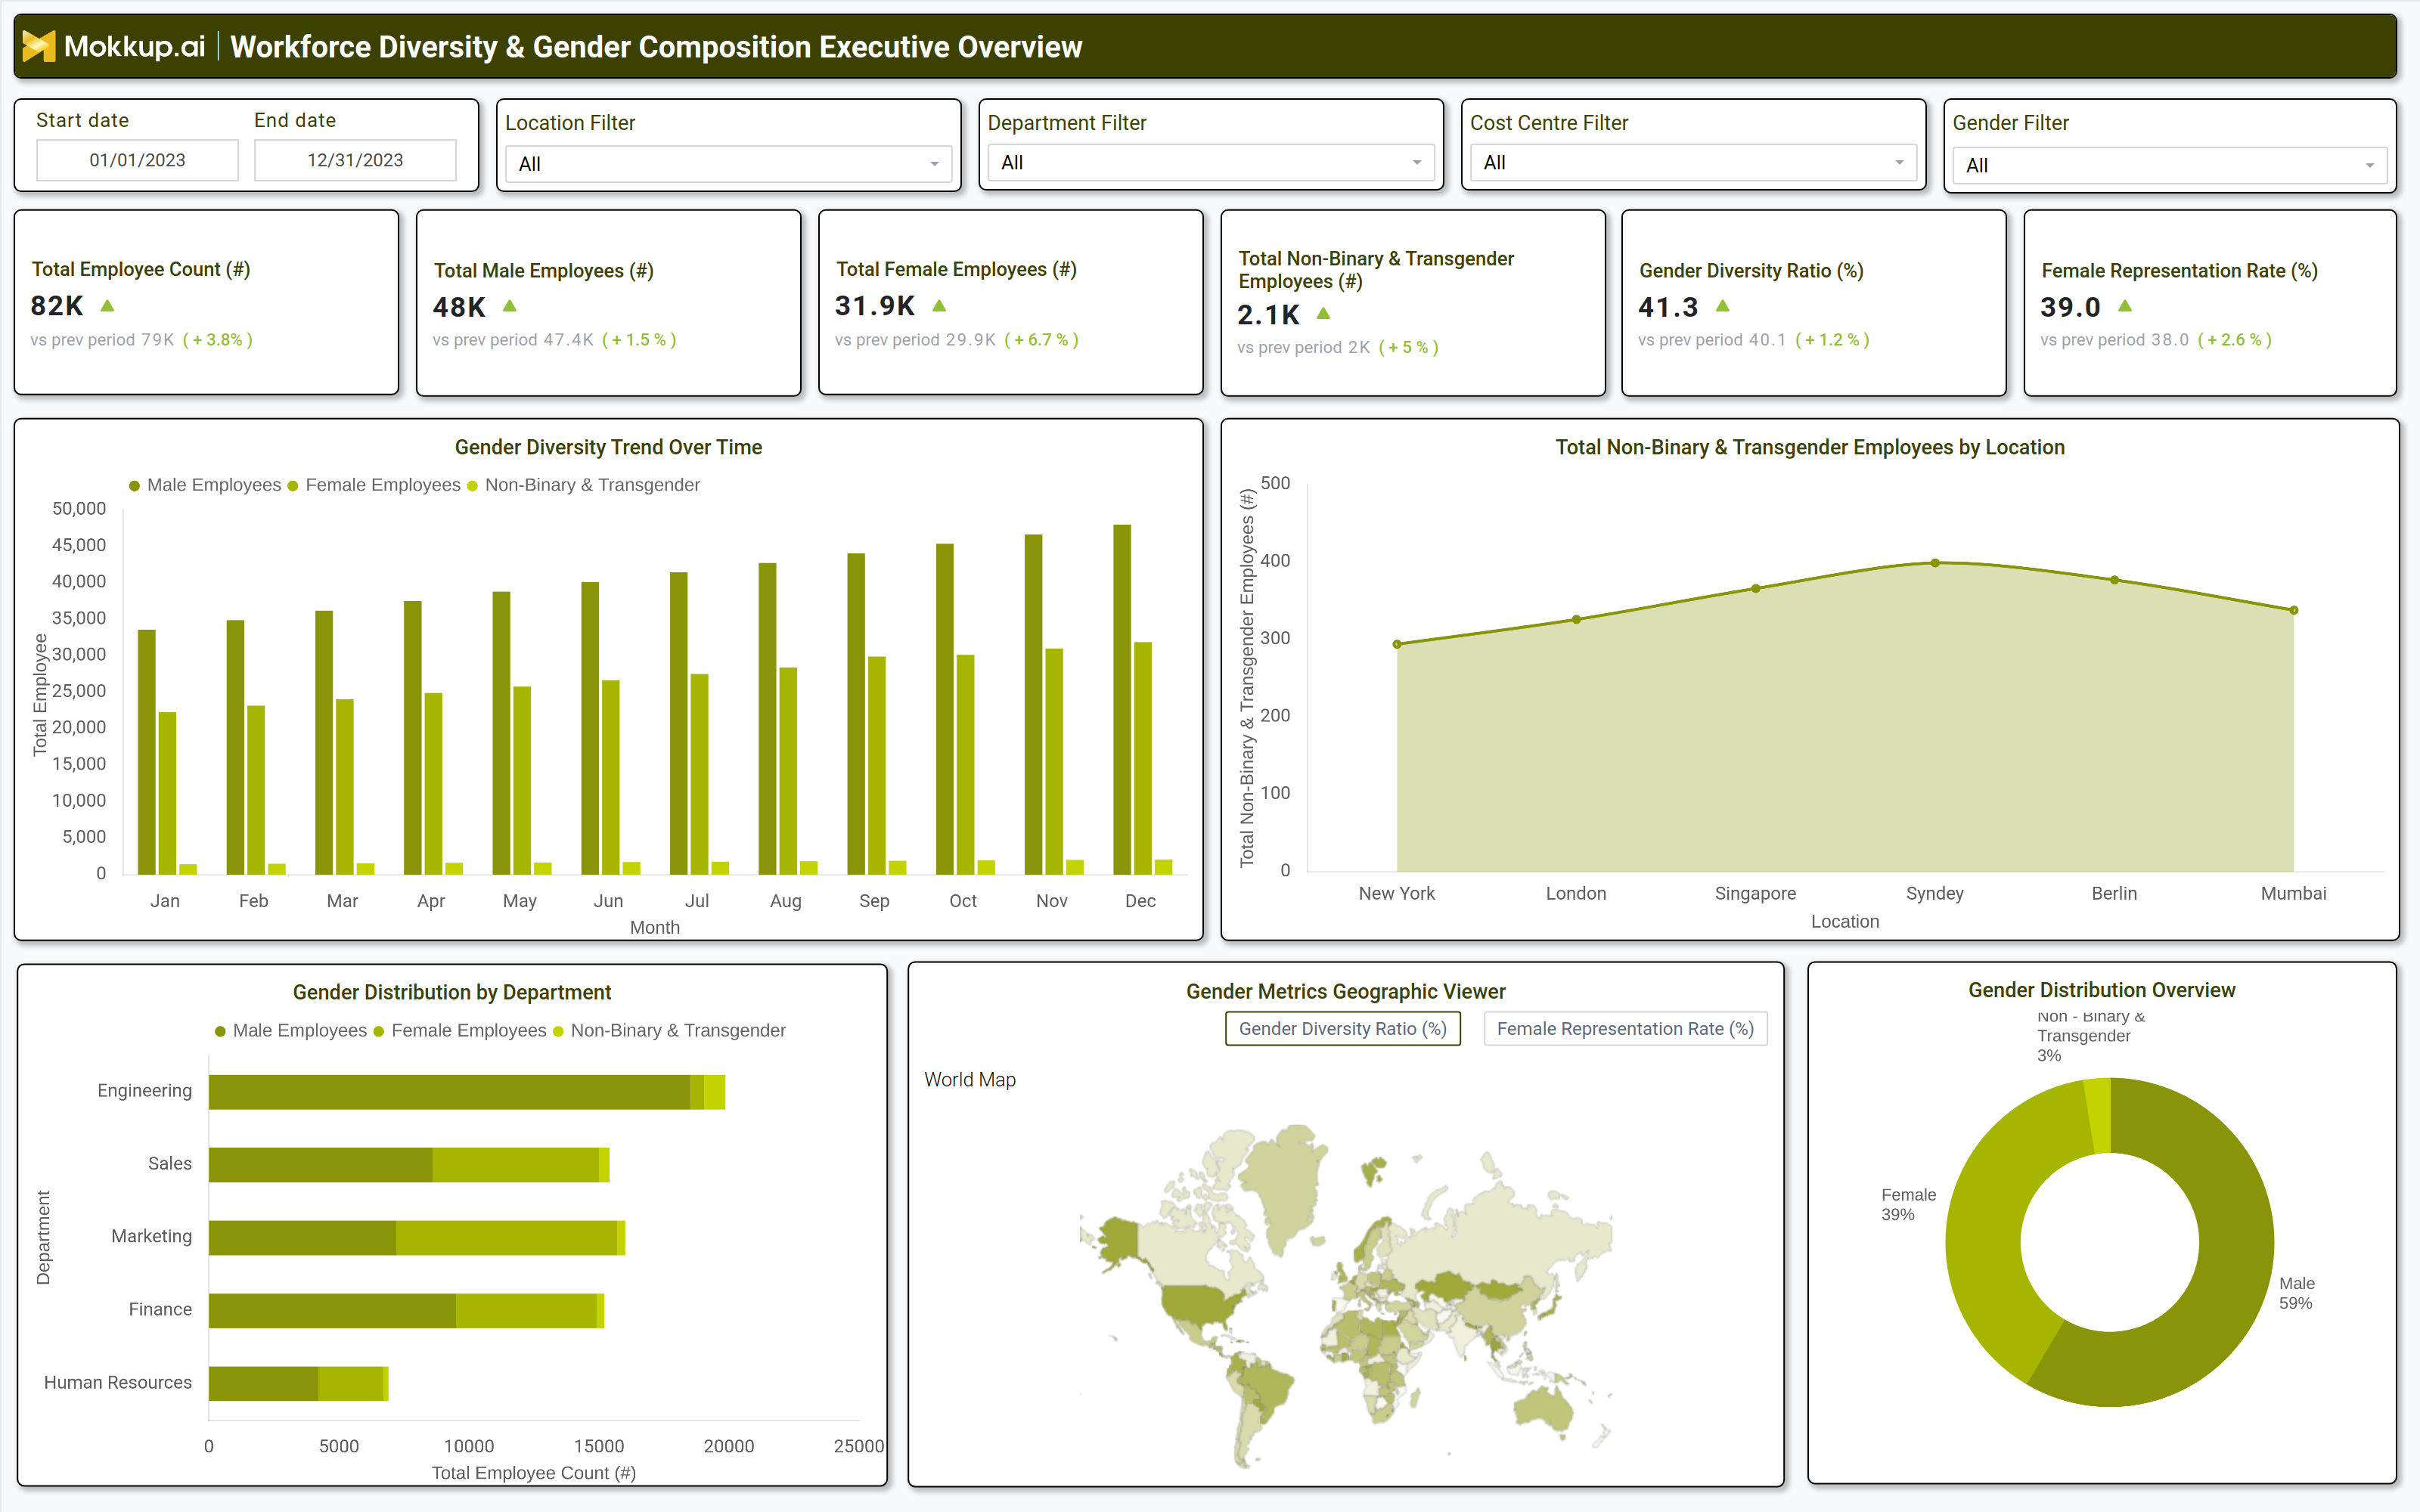
Workforce Diversity & Gender Composition Executive Overview Example
A well-structured DEI analytics dashboard for leadership teams includes interactive filters for date ranges, locations, departments, and gender categories. Key performance tiles display total employee count, male and female representation, nonbinary & transgender employee numbers, gender diversity ratio, and female representation rate. Trend charts visualize gender diversity trends over time, while department-level breakdowns highlight disparities in gender distribution.
A geographic map shows total nonbinary & transgender employees by location, and a pie chart provides a high-level gender distribution overview. These components form a gender composition analysis in HR dashboards, giving executives a clear view of workforce diversity and areas needing improvement.
How to Analyze Data in a Workforce Diversity & Gender Composition Executive Overview
Here is how you can analyze data from this dashboard:
- Workforce Size & Distribution: Review total employee counts to assess overall growth and shifts in gender distribution.
- Representation Gap Analysis: Compare male, female, and non-binary employee numbers to identify diversity gaps.
- Diversity Ratio Trends: Track gender diversity ratio trends to measure progress toward balanced representation.
- Department Level Parity: Analyze female representation across departments to pinpoint areas with low gender parity.
- Inclusive Hiring Monitoring: Examine nonbinary and transgender employee data by location to support inclusive hiring practices.
- Role-Based Imbalance Detection: Use department-level breakdowns to detect imbalances in leadership and technical roles.
- DEI Progress Evaluation: Compare current diversity metrics with historical data to assess the impact of DEI initiatives.
Benefits of a Workforce Diversity & Gender Composition Executive Overview
The following are the benefits of using this dashboard:
- Improved Transparency: Enhances visibility into workforce diversity and gender representation.
- Data Driven DEI Strategy: Supports evidence-based diversity and inclusion planning.
- Better Hiring & Retention: Strengthens hiring and retention policies using gender composition insights.
- Leadership Accountability: Provides executives with clear diversity performance indicators.
- Industry Benchmarking: Enables comparison with workforce gender balance trends across the industry.
- Compliance Support: Facilitates regulatory and corporate diversity reporting.
- Inclusive Culture Growth: Drives business performance by fostering an inclusive workplace environment.
KPIs to Track in a Workforce Diversity & Gender Composition Executive Overview
The following key KPIs can be tracked by using gender representation tracking dashboard for companies:
- Total Employee Count (count): Measures overall workforce size and growth.
- Male Employees (count): Tracks the number of male employees for gender balance analysis.
- Female Employees (count): Monitors female workforce representation.
- Non-Binary & Transgender Employees (count): Assesses inclusion of gender-diverse employees.
- Gender Diversity Ratio (%): Calculates the balance between male, female, and nonbinary employees.
- Female Representation Rate (%): Evaluates the percentage of women in the workforce.
Frequently Asked Questions
Q1. What is the purpose of a workforce diversity dashboard for HR executives?
It provides executives with workforce diversity metrics for executive reporting, helping them track gender representation, identify gaps, and drive DEI reporting for leadership decision-making.
Q2. What data sources feed into this HR diversity metrics visualization dashboard?
HRIS (Human Resource Information Systems), payroll data, employee surveys, and diversity reporting tools.
Q3. Who should use this employee gender diversity reporting dashboard?
HR leaders, DEI specialists, executives, and business analysts responsible for workforce gender balance trends and inclusion strategies.