
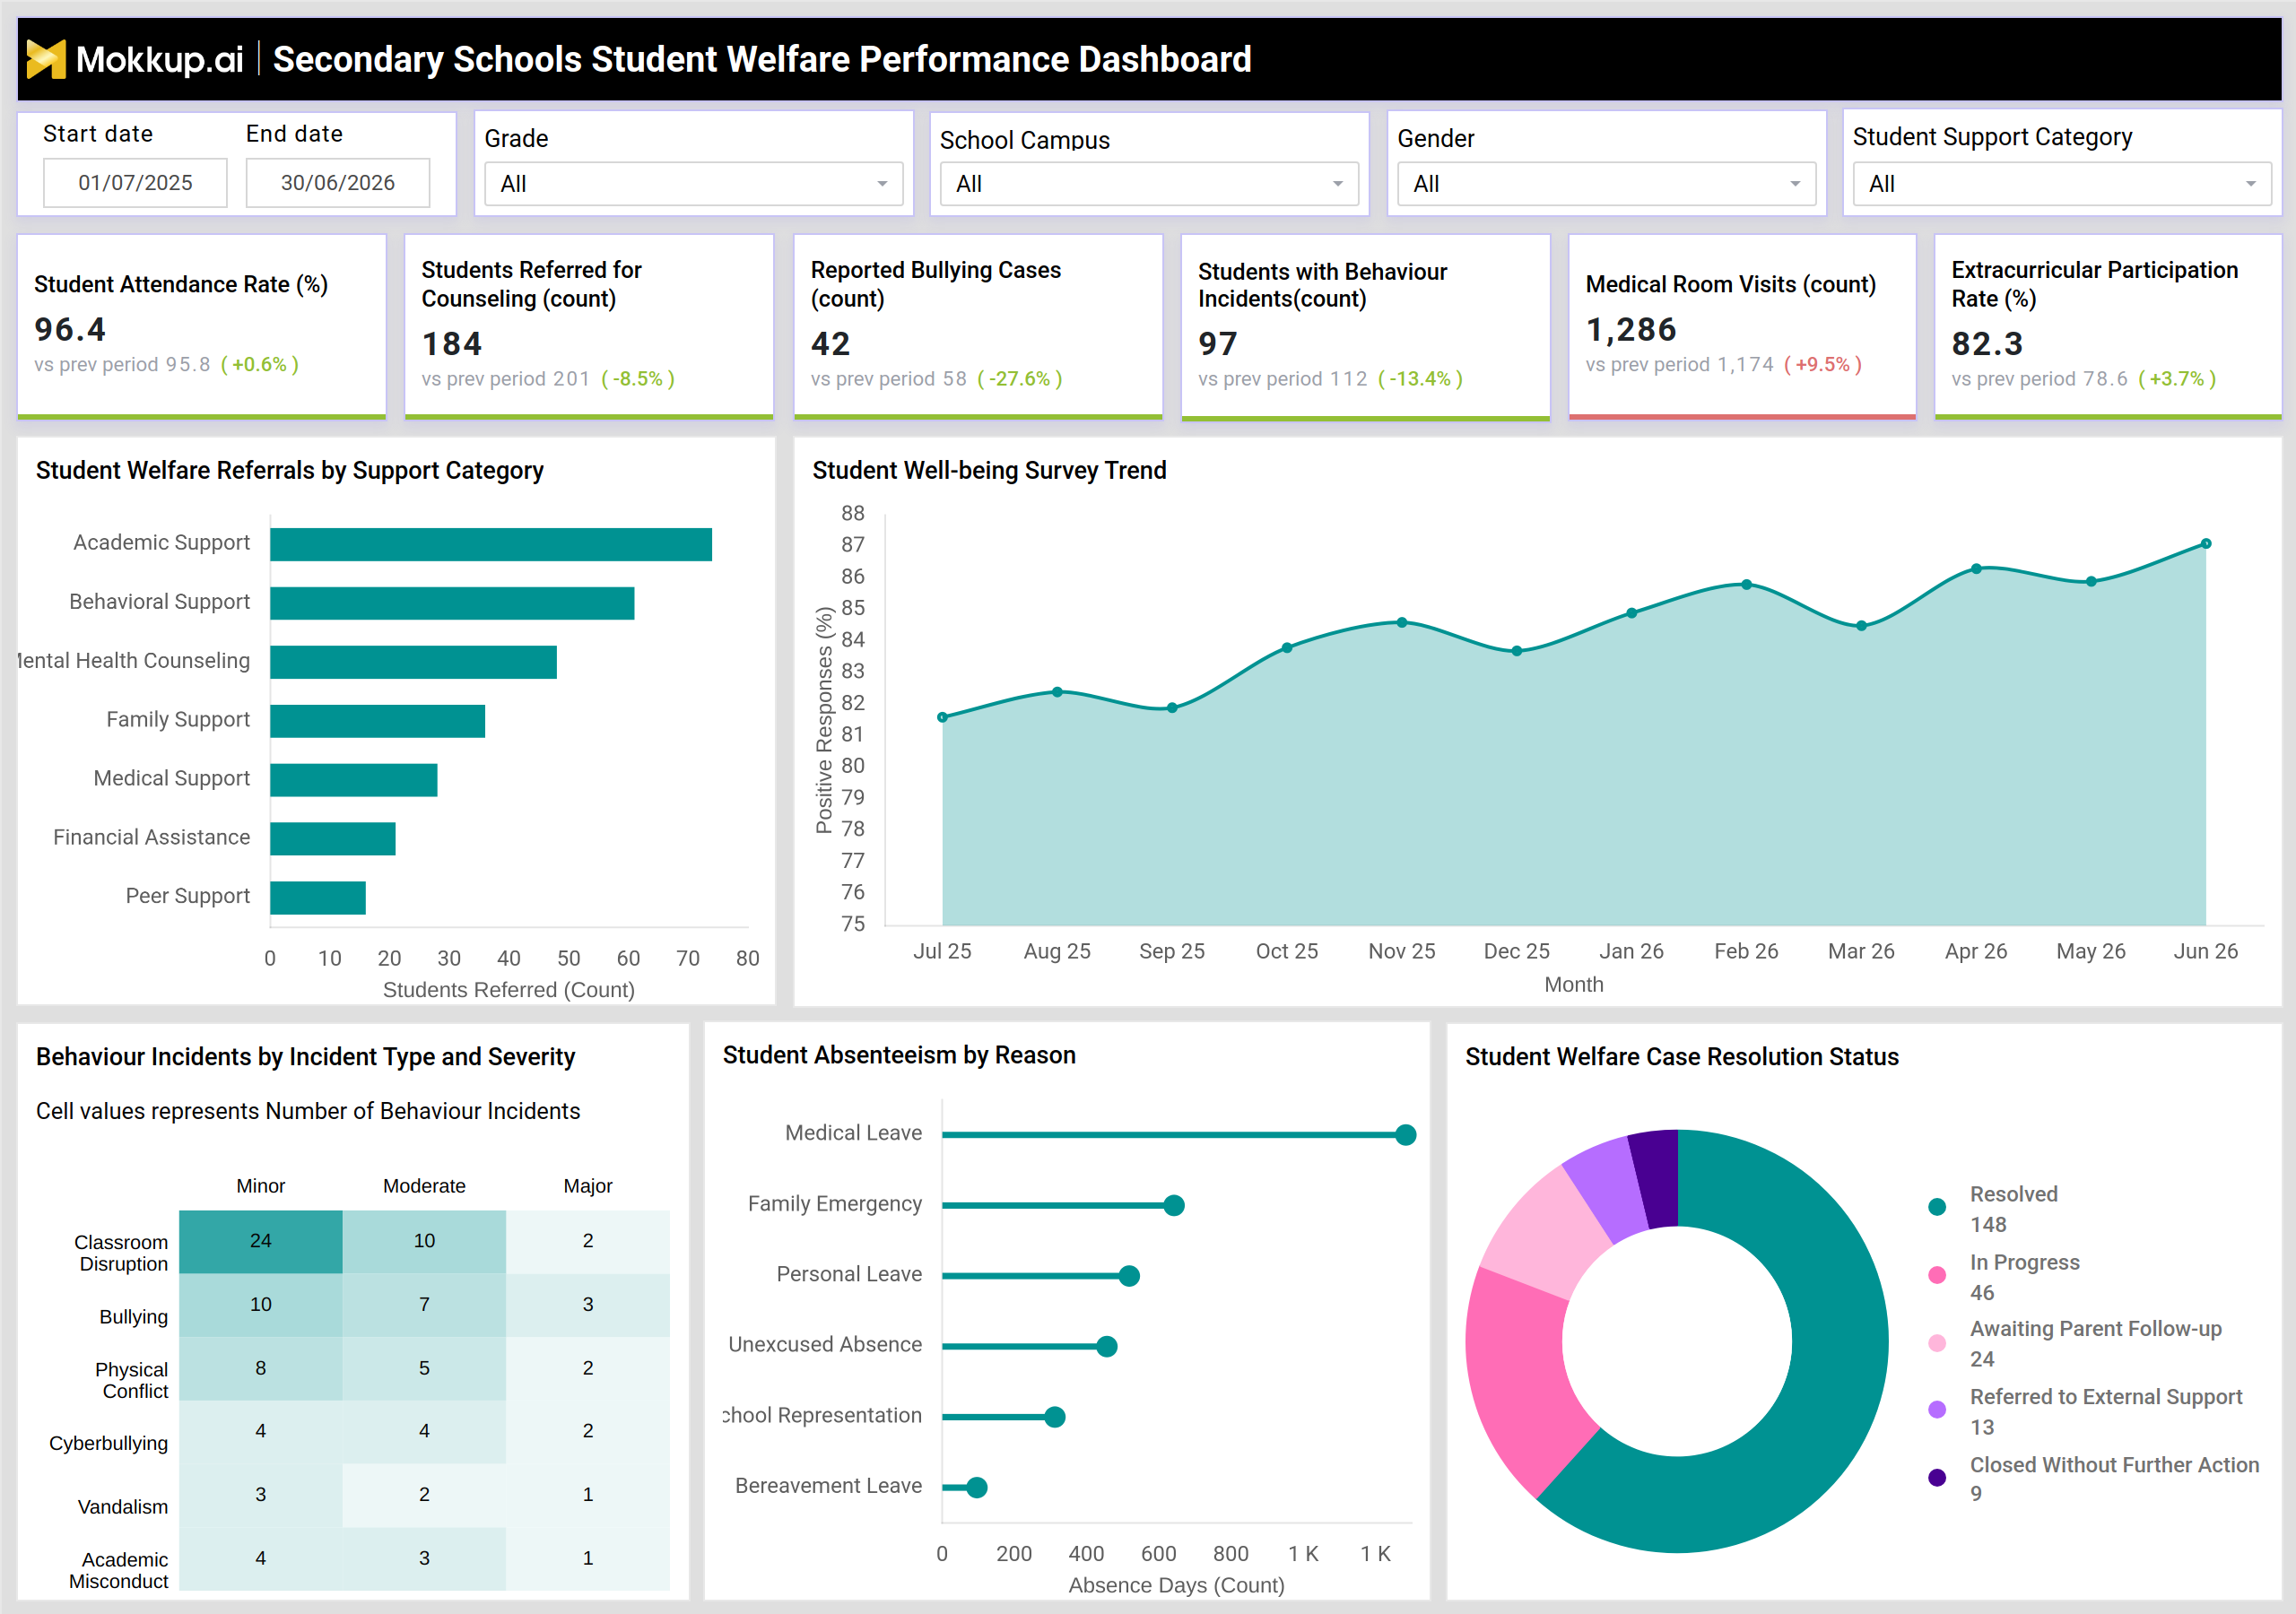
What is a Secondary Schools Student Welfare Performance Dashboard?
The Secondary Schools Student Welfare Performance Dashboard is a single-screen wireframe template built for school administrators, counselors, and welfare coordinators who need one consolidated view of student wellbeing across a campus. It brings together attendance, counseling referrals, behaviour incidents, and case resolution data so welfare teams do not have to piece together information from separate registers and spreadsheets. As a secondary school student welfare performance dashboard, it sits at the center of pastoral care reporting, letting schools filter by grade, school campus, gender, and student support category to focus on the population segment that needs attention. Because welfare tracking spans academic, behavioral, medical, and family circumstances, the layout groups referral categories, incident types, and absenteeism reasons so teams can run a quick daily check or a longer trend review across a full academic year.
How to Create a Secondary Schools Student Welfare Performance Dashboard
You don't need to build your report from scratch; just start with a ready-to-use dashboard template from Mokkup. Add in your data and export it however you like. Here's how to do it:
1. Create or Log in to Your Mokkup Account
Start by signing up on Mokkup.ai using your email. If you already have an account, just log in, and you'll be good to go.
2. Choose and Customize Your Dashboard Template
Find the Secondary Schools Student Welfare Performance Dashboard template in the Templates section. Use the drag-and-drop editor to adjust KPIs, edit filters, or add elements based on your data.
3. Export to Your BI Tool
Once your dashboard wireframe is ready, use the BI Tool Export feature to send it directly to Power BI or Tableau for further analysis and enhancements. You can also download the dashboard as a PDF, PNG, or JPEG, embed it on a platform, or invite your team to collaborate.
Note: This is a Pro template. You'll need a Pro subscription on Mokkup to use and customize this dashboard wireframe. Upgrade anytime to unlock full access.
Secondary Schools Student Welfare Performance Dashboard Example
A welfare coordinator typically opens this dashboard each week to check whether pastoral care efforts are keeping pace with emerging student needs across the term. Before looking into any single number, they set the date range and narrow the view by grade or campus to understand whether an issue is isolated to one cohort or spread across the school, which shapes whether escalation is needed or existing routines are sufficient. Once the filters are set, the coordinator reviews attendance and participation patterns alongside counseling and medical activity to judge overall welfare performance in a single sitting. If referrals for a particular support category start climbing, they can compare that category against others to identify a school counseling referral trend worth investigating further.
The behaviour incident breakdown lets discipline leads separate minor classroom issues from more serious cases, supporting stronger student behaviour incident tracking for schools so follow-up is prioritized by risk rather than treated uniformly. Attendance officers lean on the absenteeism view for student absenteeism reason analysis, distinguishing planned leave from unexcused absence, since that distinction changes how a case is handled. Case managers use the resolution view to track how welfare cases move from open to closed, and to flag cases stalled awaiting a parent response or needing referral to an external support service. This keeps every open case visible instead of letting it slip once the initial report is filed, strengthening school bullying case resolution tracking and welfare case follow-up more broadly. Altogether, the dashboard helps welfare teams move from reactive record-keeping to a coordinated view of student welfare, so patterns in behaviour, wellbeing, and support needs surface early enough for the school to act on them.
How to Analyze Data in a Secondary Schools Student Welfare Performance Dashboard
Here is how you can analyze data from this dashboard:
- Filter by grade, school campus, gender, or student support category to isolate the population segment driving a trend
- Compare current attendance and participation rates against the previous period to spot early shifts
- Track school counseling referral trends across support categories to see where demand is rising
- Cross-check behaviour incidents by type and severity to prioritize cases carrying the highest risk
- Review student absenteeism reason analysis to separate planned leave from unexcused absence patterns
- Watch the student wellbeing survey trend line to confirm whether sentiment is improving term over term
- Audit case resolution status regularly to catch cases stuck awaiting parent follow-up or external referral
Benefits of a Secondary Schools Student Welfare Performance Dashboard
The following are the benefits of using this dashboard:
- Centralizes attendance, counseling, medical, and behaviour data in one secondary school student welfare performance dashboard
- Strengthens student behaviour incident tracking for schools by separating minor, moderate, and major cases
- Speeds up school bullying case resolution tracking by keeping every open case visible until closed
- Gives welfare coordinators a filterable view by grade, campus, gender, and support category
- Reduces manual reporting effort across counseling, medical room, and extracurricular records
- Supports earlier intervention by surfacing rising referral or incident trends before they escalate
- Helps leadership teams justify staffing and support program decisions with consistent welfare data
- Makes it easier to spot school counseling referral trends before caseloads become unmanageable
KPIs to Track in a Secondary Schools Student Welfare Performance Dashboard
The following key KPIs can be tracked by using this dashboard:
- Student Attendance Rate (%): the share of enrolled students present against total school days, indicating overall engagement
- Students Referred for Counseling (count): the number of students directed to counseling support within the selected period
- Reported Bullying Cases (count): incidents formally logged as bullying, used to gauge campus safety climate
- Students with Behaviour Incidents (count): the number of individual students with at least one logged behaviour incident
- Medical Room Visits (count): demand placed on the medical room, useful for staffing and health pattern review
- Extracurricular Participation Rate (%): the share of students engaged in extracurricular activities, a proxy for social wellbeing and student wellbeing survey analysis over time
Frequently Asked Questions
1. What does the Secondary Schools Student Welfare Performance Dashboard track?
It tracks attendance, counseling referrals, bullying reports, behaviour incidents, medical room visits, extracurricular participation, and a student wellbeing survey analysis trend, alongside absenteeism reasons and welfare case resolution status. Filters for grade, campus, gender, and support category narrow the view to any student segment.
2. Who should use this dashboard?
School administrators, welfare coordinators, counselors, and discipline leads use it to monitor pastoral care activity and case progress. Leadership teams also use it to review student welfare performance when planning support resources.
2. Can I customize this dashboard for my school?
Yes, the template is fully editable in Mokkup's drag-and-drop editor, so KPIs, filters, and chart labels can be adjusted to match your school's data. Once customized, it can be exported to Power BI or Tableau, or downloaded directly.