
What is a Biomass and Bioenergy Boiler Safety & Field Incident Compliance Dashboard?
A Biomass and Bioenergy Boiler Safety & Field Incident Compliance Dashboard is a centralized analytics platform designed to monitor, track, and report safety incidents, compliance violations, and operational risks in biomass power plants. It consolidates boiler performance data, safety event logs, regulatory compliance metrics, and field incident reports into a single interface. This dashboard helps plant managers, safety officers, and compliance teams identify trends in interlock violations, fire hazards, and valve failures, enabling proactive risk mitigation. By integrating safety valve compliance rates, lost time injury frequency (LTIFR), and permit-to-work (PTW) adherence, the dashboard ensures regulatory compliance while improving operational safety. It also provides historical trend analysis, allowing utilities to compare current performance against past incidents and benchmark safety improvements.
How to Create a Biomass and Bioenergy Boiler Safety & Field Incident Compliance Dashboard
You don't need to build your report from scratch, just start with a ready-to-use dashboard template from Mokkup. Add in your data and export it however you like. Here's how to do it:
1. Create or Log in to Your Mokkup Account
Start by signing up on Mokkup.ai using your email. If you already have an account, just log in, and you'll be good to go.
2. Choose and Customize Your Dashboard Template
Find the Biomass and Bioenergy Boiler Safety & Field Incident Compliance Dashboard template in the Templates section. Use the drag-and-drop editor to adjust KPIs, edit filters, or add elements based on your data.
3. Export to Your BI Tool
Once your dashboard wireframe is ready, use the BI Tool Export feature to send it directly to Power BI or Tableau for further analysis and enhancements. You can also download the dashboard as a PDF, PNG, or JPEG, embed it on a platform, or invite your team to collaborate.
Note: This is a Pro template. You'll need a Pro subscription on Mokkup to use and customize this dashboard wireframe. Upgrade anytime to unlock full access.
Biomass and Bioenergy Boiler Safety & Field Incident Compliance Dashboard Example
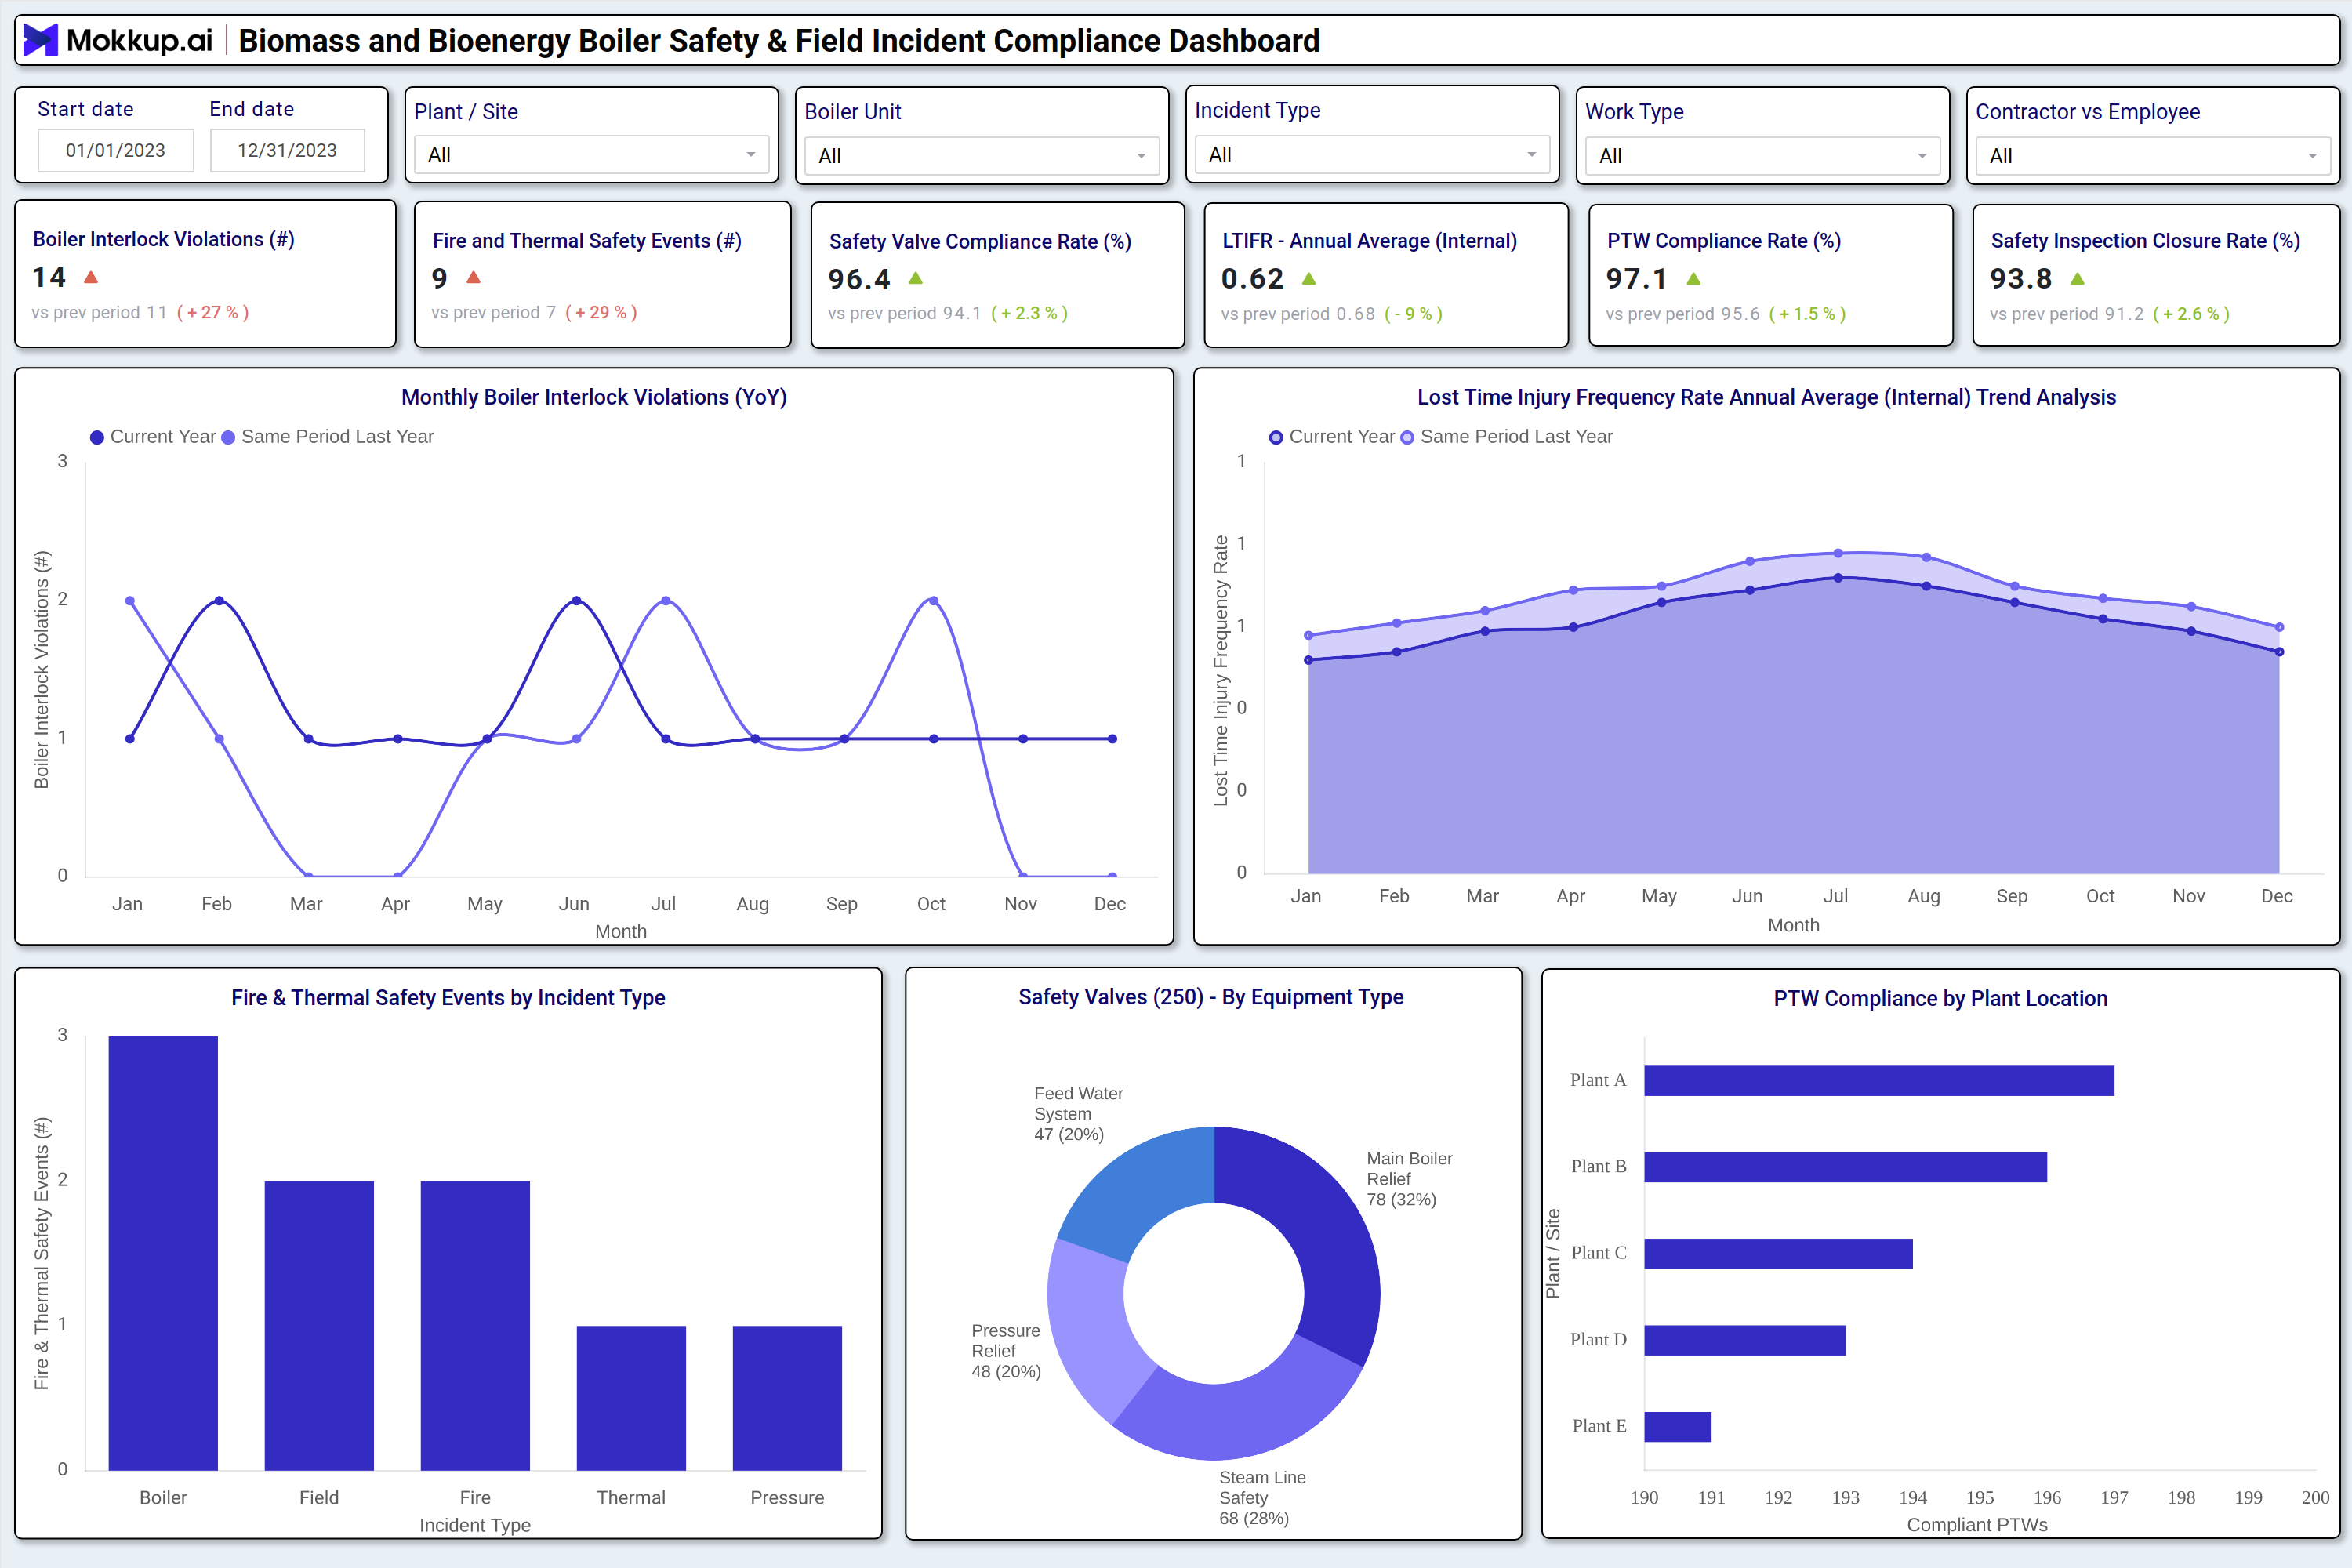
A typical biomass boiler safety dashboard includes interactive filters for date range, plant/site, boiler unit, incident type, work type, and contractor vs. employee involvement. Key performance tiles display boiler interlock violations, fire and thermal safety events, safety valve compliance rates, lost time injury frequency rate (LTIFR), and PTW compliance percentages. Trend charts compare monthly boiler interlock violations and annual LTIFR averages against the previous year, highlighting improvements or deteriorations in safety performance. A breakdown of fire and thermal safety events by incident type (e.g., boiler, field, fire, thermal, pressure) helps identify high-risk areas. A safety valve compliance pie chart categorizes failures by equipment type (feed water system, main boiler relief, steam line safety, pressure relief), while a PTW compliance bar chart ranks plant locations by permit adherence. Together, these components form a comprehensive safety and compliance monitoring system that enables data-driven decision-making for biomass power plant operators.
How to Analyze Data in a Biomass and Bioenergy Boiler Safety & Field Incident Compliance Dashboard
Here is how you can analyze data from this PTW compliance monitoring dashboard:
- Boiler Interlock Violations: Monitor interlock violations to detect equipment malfunctions early, prevent unsafe operating conditions, and reduce the risk of safety breaches.
- Fire and Thermal Safety Events by Incident Type: Track incidents such as boiler fires, pressure failures, and thermal hazards to identify recurring safety risks and implement preventive measures.
- Safety Valve Compliance Rates: Review compliance with safety valve inspection and testing requirements to ensure regulatory adherence and prevent catastrophic equipment failures.
- Lost Time Injury Frequency Rate (LTIFR): Compare LTIFR against industry benchmarks to evaluate workforce safety performance and identify opportunities to improve workplace safety.
- Permit-to-Work (PTW) Compliance by Plant Location: Assess PTW compliance across facilities to minimize unauthorized work activities and strengthen operational safety controls.
- Incident Trend Analysis (Current vs. Previous Year): Analyze year-over-year safety incident trends to measure the effectiveness of safety programs and identify areas requiring improvement.
- Safety Valve Failures by Equipment Type: Break down valve failures by equipment category to prioritize maintenance activities, optimize replacement strategies, and improve asset reliability.
- Contractor vs. Employee Incident Rates: Compare incident rates between contractors and employees to identify training gaps, enhance safety protocols, and promote a stronger safety culture.
Benefits of a Biomass and Bioenergy Boiler Safety & Field Incident Compliance Dashboard
The following are the benefits of using this safety valve compliance dashboard:
- Enhanced Boiler Safety: Track boiler interlock violations and thermal safety events to identify hazards early, prevent equipment failures, and improve overall plant safety.
- Improved Regulatory Compliance: Automate monitoring of safety valve inspections and permit-to-work (PTW) processes to ensure adherence to regulatory and operational safety requirements.
- Reduced Operational Downtime: Proactively identify and address safety risks to minimize unexpected outages, improve equipment reliability, and maintain uninterrupted operations.
- Lower Incident-Related Costs: Use data-driven risk mitigation strategies to reduce the financial impact of accidents, equipment failures, and safety incidents.
- Improved Audit Readiness: Maintain centralized incident records and compliance data to simplify audits, enhance traceability, and support regulatory reporting.
- Optimized Maintenance Schedules: Analyze equipment failure patterns and safety trends to prioritize maintenance activities and improve asset performance.
- Strengthened Workforce Safety: Monitor Lost Time Injury Frequency Rate (LTIFR) and other safety metrics to assess workforce safety performance and drive continuous improvement.
- Industry Benchmarking Capabilities: Compare safety performance against industry standards and best practices to identify gaps and support ongoing safety enhancements.
KPIs to Track in a Biomass and Bioenergy Boiler Safety & Field Incident Compliance Dashboard
The following key KPIs can be tracked by using this dashboard:
- Boiler Interlock Violations (count): Measures safety system failures that could lead to boiler malfunctions.
- Fire and Thermal Safety Events (count): Tracks incidents involving fire, overheating, or thermal hazards.
- Safety Valve Compliance Rate (%): Indicates percentage of safety valves meeting regulatory standards.
- Lost Time Injury Frequency Rate (LTIFR) – Annual Average: Calculates workplace injuries per million hours worked, reflecting safety performance.
- Permit-to-Work (PTW) Compliance Rate (%): Measures adherence to work authorization procedures to prevent unauthorized operations.
- Safety Inspection Closure Rate (%): Tracks percentage of safety inspections completed on time.
- Incident Resolution Time (Hours): Measures average time taken to resolve safety incidents, indicating response efficiency.
Frequently Asked Questions
1. What is a biomass boiler safety dashboard used for?
It monitors boiler safety, tracks field incidents, and ensures regulatory compliance in biomass power plants.
2. What data sources feed into this bioenergy field incident compliance dashboard?
Boiler control systems, safety incident logs, maintenance records, regulatory compliance reports, and workforce safety databases.
3. Who should use a boiler interlock violation dashboard?
Plant managers, safety officers, compliance teams, and utility executives responsible for boiler operations and workforce safety.