
What is a Secondary Schools Career Guidance & College Readiness Dashboard
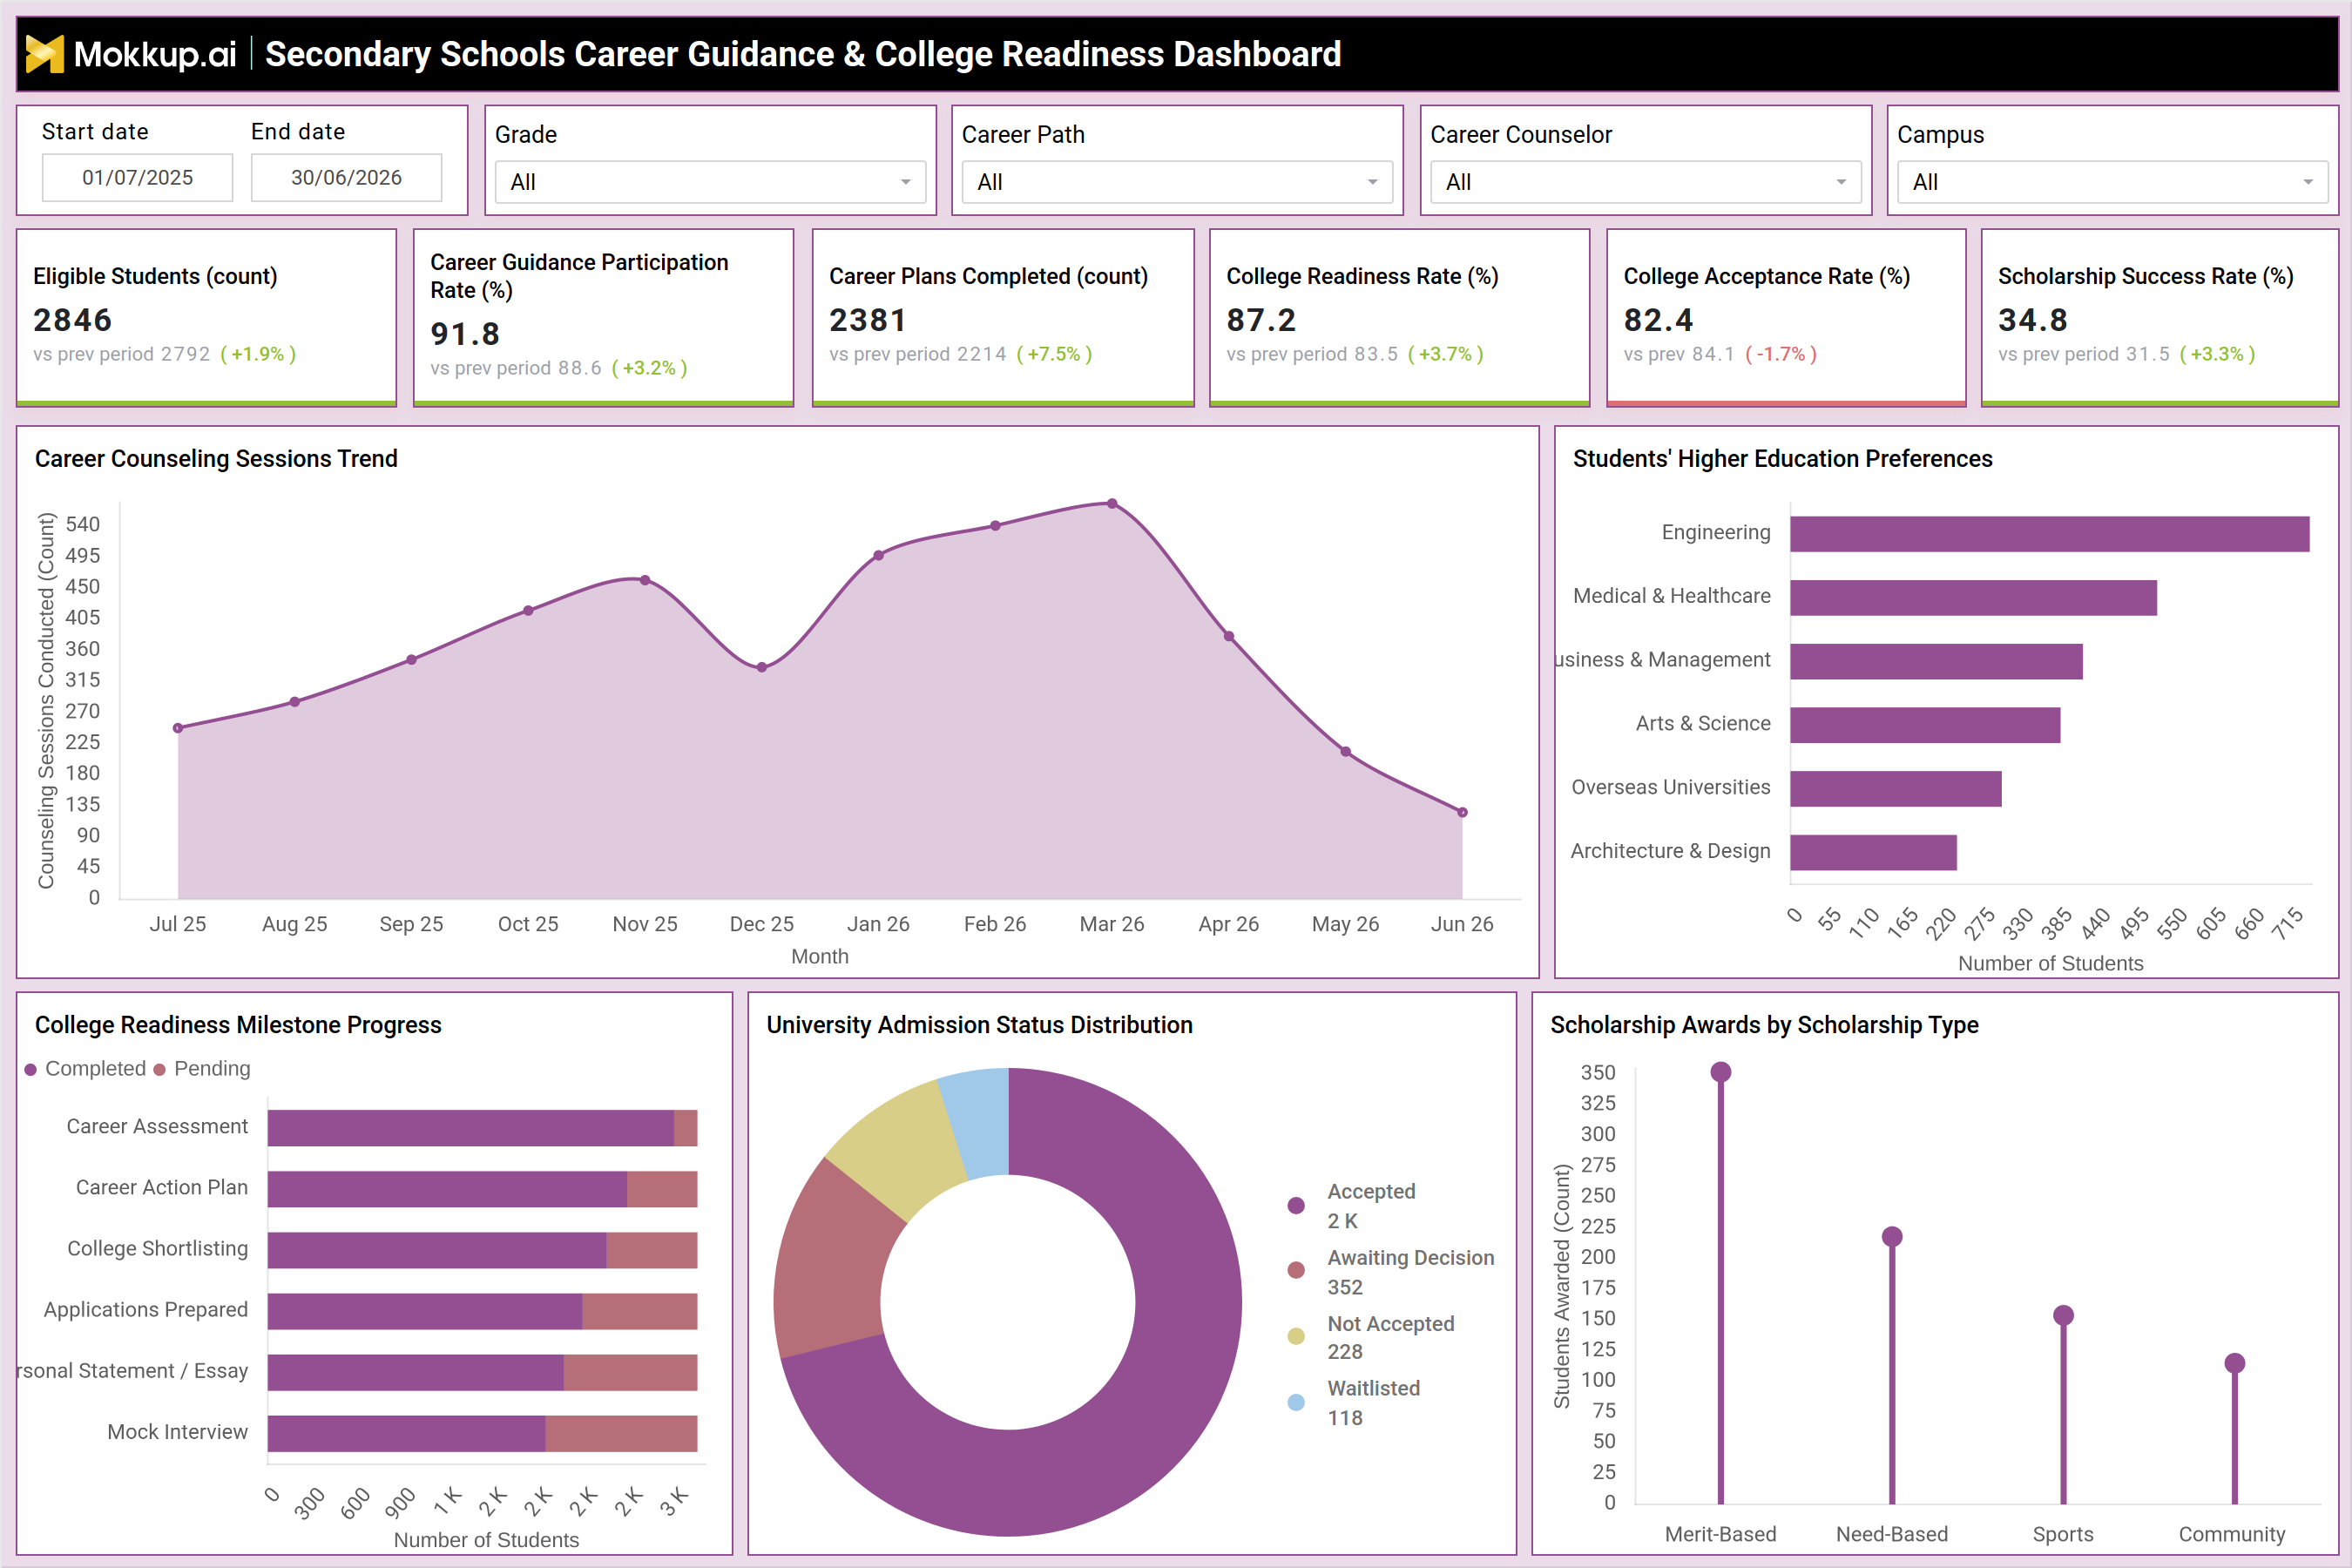
The Secondary Schools Career Guidance & College Readiness Dashboard is a dashboard template built for school counseling teams, career guidance departments, and academic leadership who need one view of how students move from career exploration to college admission. It brings together career guidance participation, career plan completion, college readiness, admission outcomes, and scholarship activity so counselors stop switching between spreadsheets, application trackers, and counseling session logs.
This career guidance dashboard for secondary schools is filterable by date range, grade, career path, career counselor, and campus, letting a single school or a network of campuses monitor cohorts separately or side by side. Because it is delivered as a Mokkup wireframe, counseling heads and academic administrators can adapt the layout to their own reporting cycle before it reaches Power BI or Tableau, making it a practical starting point for any team building out a college readiness dashboard template or setting up career guidance and college readiness analytics for the first time.
How to Create a Secondary Schools Career Guidance & College Readiness Dashboard
You don't need to build your report from scratch; just start with a ready-to-use dashboard template from Mokkup. Add in your data and export it however you like. Here's how to do it:
1. Create or Log in to Your Mokkup Account
Start by signing up on Mokkup.ai using your email. If you already have an account, just log in, and you'll be good to go.
2. Choose and Customize Your Dashboard Template
Find the Secondary Schools Career Guidance & College Readiness Dashboard template in the Templates section. Use the drag-and-drop editor to adjust KPIs, edit filters, or add elements based on your data.
3. Export to Your BI Tool
Once your dashboard wireframe is ready, use the BI Tool Export feature to send it directly to Power BI or Tableau for further analysis and enhancements. You can also download the dashboard as a PDF, PNG, or JPEG, embed it on a platform, or invite your team to collaborate.
Note: This is a Pro template. You'll need a Pro subscription on Mokkup to use and customize this dashboard wireframe. Upgrade anytime to unlock full access.
Secondary Schools Career Guidance & College Readiness Dashboard Example
A high school career counselor typically opens this student career counseling dashboard for high schools at the start of a term review, trying to understand how many eligible students are engaging with career guidance and whether that engagement is translating into completed career plans.
Filtering by grade or campus narrows the view to the cohort they are responsible for, whether that is a single grade level preparing for board exams or an entire campus ahead of college application season. From there, the counselor reviews how counseling session activity has moved across the academic year, which helps identify periods where demand for career guidance is heaviest and where additional counselor time needs to be scheduled. Looking at students' higher education preferences, department heads can compare which career paths and fields of study are gaining traction, informing which guest sessions, workshops, or partner university visits to prioritize next term. The milestone progress view lets counselors see how far students have moved through career assessment, action planning, college shortlisting, applications, personal statements, and mock interviews, so they can identify which milestone is causing the most students to fall behind and target outreach accordingly.
On the outcomes side, academic leadership uses this college acceptance rate tracking dashboard to see how admission decisions are distributed across accepted, waitlisted, and not-accepted categories, gauging how well readiness efforts are converting into offers. They can also review how scholarship awards are spread across merit-based, need-based, sports, and community categories to evaluate whether support is reaching the students who need it. As a college readiness dashboard for school counselors, this view turns career guidance and college readiness analytics into a coordinated way of working, so no student's application timeline slips through the cracks and every counselor knows where to focus attention next.
How to Analyze Data in a Secondary Schools Career Guidance & College Readiness Dashboard
Here is how you can analyze data from this dashboard:
- Analyze student cohorts: Filter by grade and campus to evaluate career guidance participation for specific student groups.
- Measure engagement outcomes: Compare career guidance participation rates with career plans completed to identify engagement-to-completion gaps.
- Plan counseling resources: Review monthly counseling session activity to prepare staffing for periods of peak demand.
- Support college readiness: Use the college readiness dashboard to align workshops and university outreach with student interest trends.
- Track milestone progress: Review readiness milestones to identify stages where students experience the greatest delays.
- Evaluate admission outcomes: Analyze university admission status distribution to understand how readiness efforts translate into acceptances.
- Assess scholarship distribution: Segment scholarship awards by type to evaluate support across merit, need-based, sports, and community categories.
- Review counselor performance: Apply the career counselor filter to analyze individual caseloads and student outcomes.
Benefits of a Secondary Schools Career Guidance & College Readiness Dashboard
The following are the benefits of using this dashboard:
- Centralize counseling data: Combine career guidance and college readiness metrics into a single student career counseling dashboard for high schools.
- Reduce manual tracking: Replace spreadsheets, counseling logs, and application trackers with one centralized reporting view.
- Identify student bottlenecks: Give counseling leaders visibility into the milestones that cause the greatest student delays.
- Support resource planning: Use insights to make informed decisions about counselor staffing and workshop scheduling.
- Scale across campuses: Use the career guidance dashboard consistently for single-campus or multi-campus reporting.
- Track college outcomes: Monitor college acceptance rates to provide leadership with clear visibility into student outcomes.
- Promote equitable support: Analyze scholarship distribution patterns to ensure fair allocation of student support.
- Enable flexible reporting: Filter by grade, career path, counselor, and campus to tailor analysis to specific needs.
KPIs to Track in a Secondary Schools Career Guidance & College Readiness Dashboard
The following key KPIs can be tracked by using this dashboard:
- Eligible Students (count) - total number of students who qualify for career guidance support within the selected period.
- Career Guidance Participation Rate (%) - the share of eligible students actively engaging in career guidance activities.
- Career Plans Completed (count) - the number of students who have finished building a documented career plan.
- College Readiness Rate (%) - the proportion of students who have met the milestones considered necessary for college applications.
- College Acceptance Rate (%) - the percentage of applicants who received an acceptance from a university.
- Scholarship Success Rate (%) - the share of scholarship applicants who were awarded funding.
Frequently Asked Questions
1. Who should use the Secondary Schools Career Guidance & College Readiness Dashboard?
School counseling teams, career guidance coordinators, and academic leadership overseeing student career readiness and college admissions use this career guidance dashboard for secondary schools. It suits a single campus as well as multi-campus school networks tracking cohorts separately.
2. Can this dashboard track multiple campuses at once?
Yes. The campus filter lets counseling teams isolate data for one location or compare metrics across an entire network as a college readiness dashboard for school counselors. Grade, career path, and career counselor filters narrow the view further.
3. Do I need Power BI or Tableau to use this template?
No. The wireframe can be customized directly in Mokkup and exported as a PDF, PNG, or JPEG, or pushed to Power BI or Tableau for deeper analysis. A Pro subscription is required to customize and export this template.