
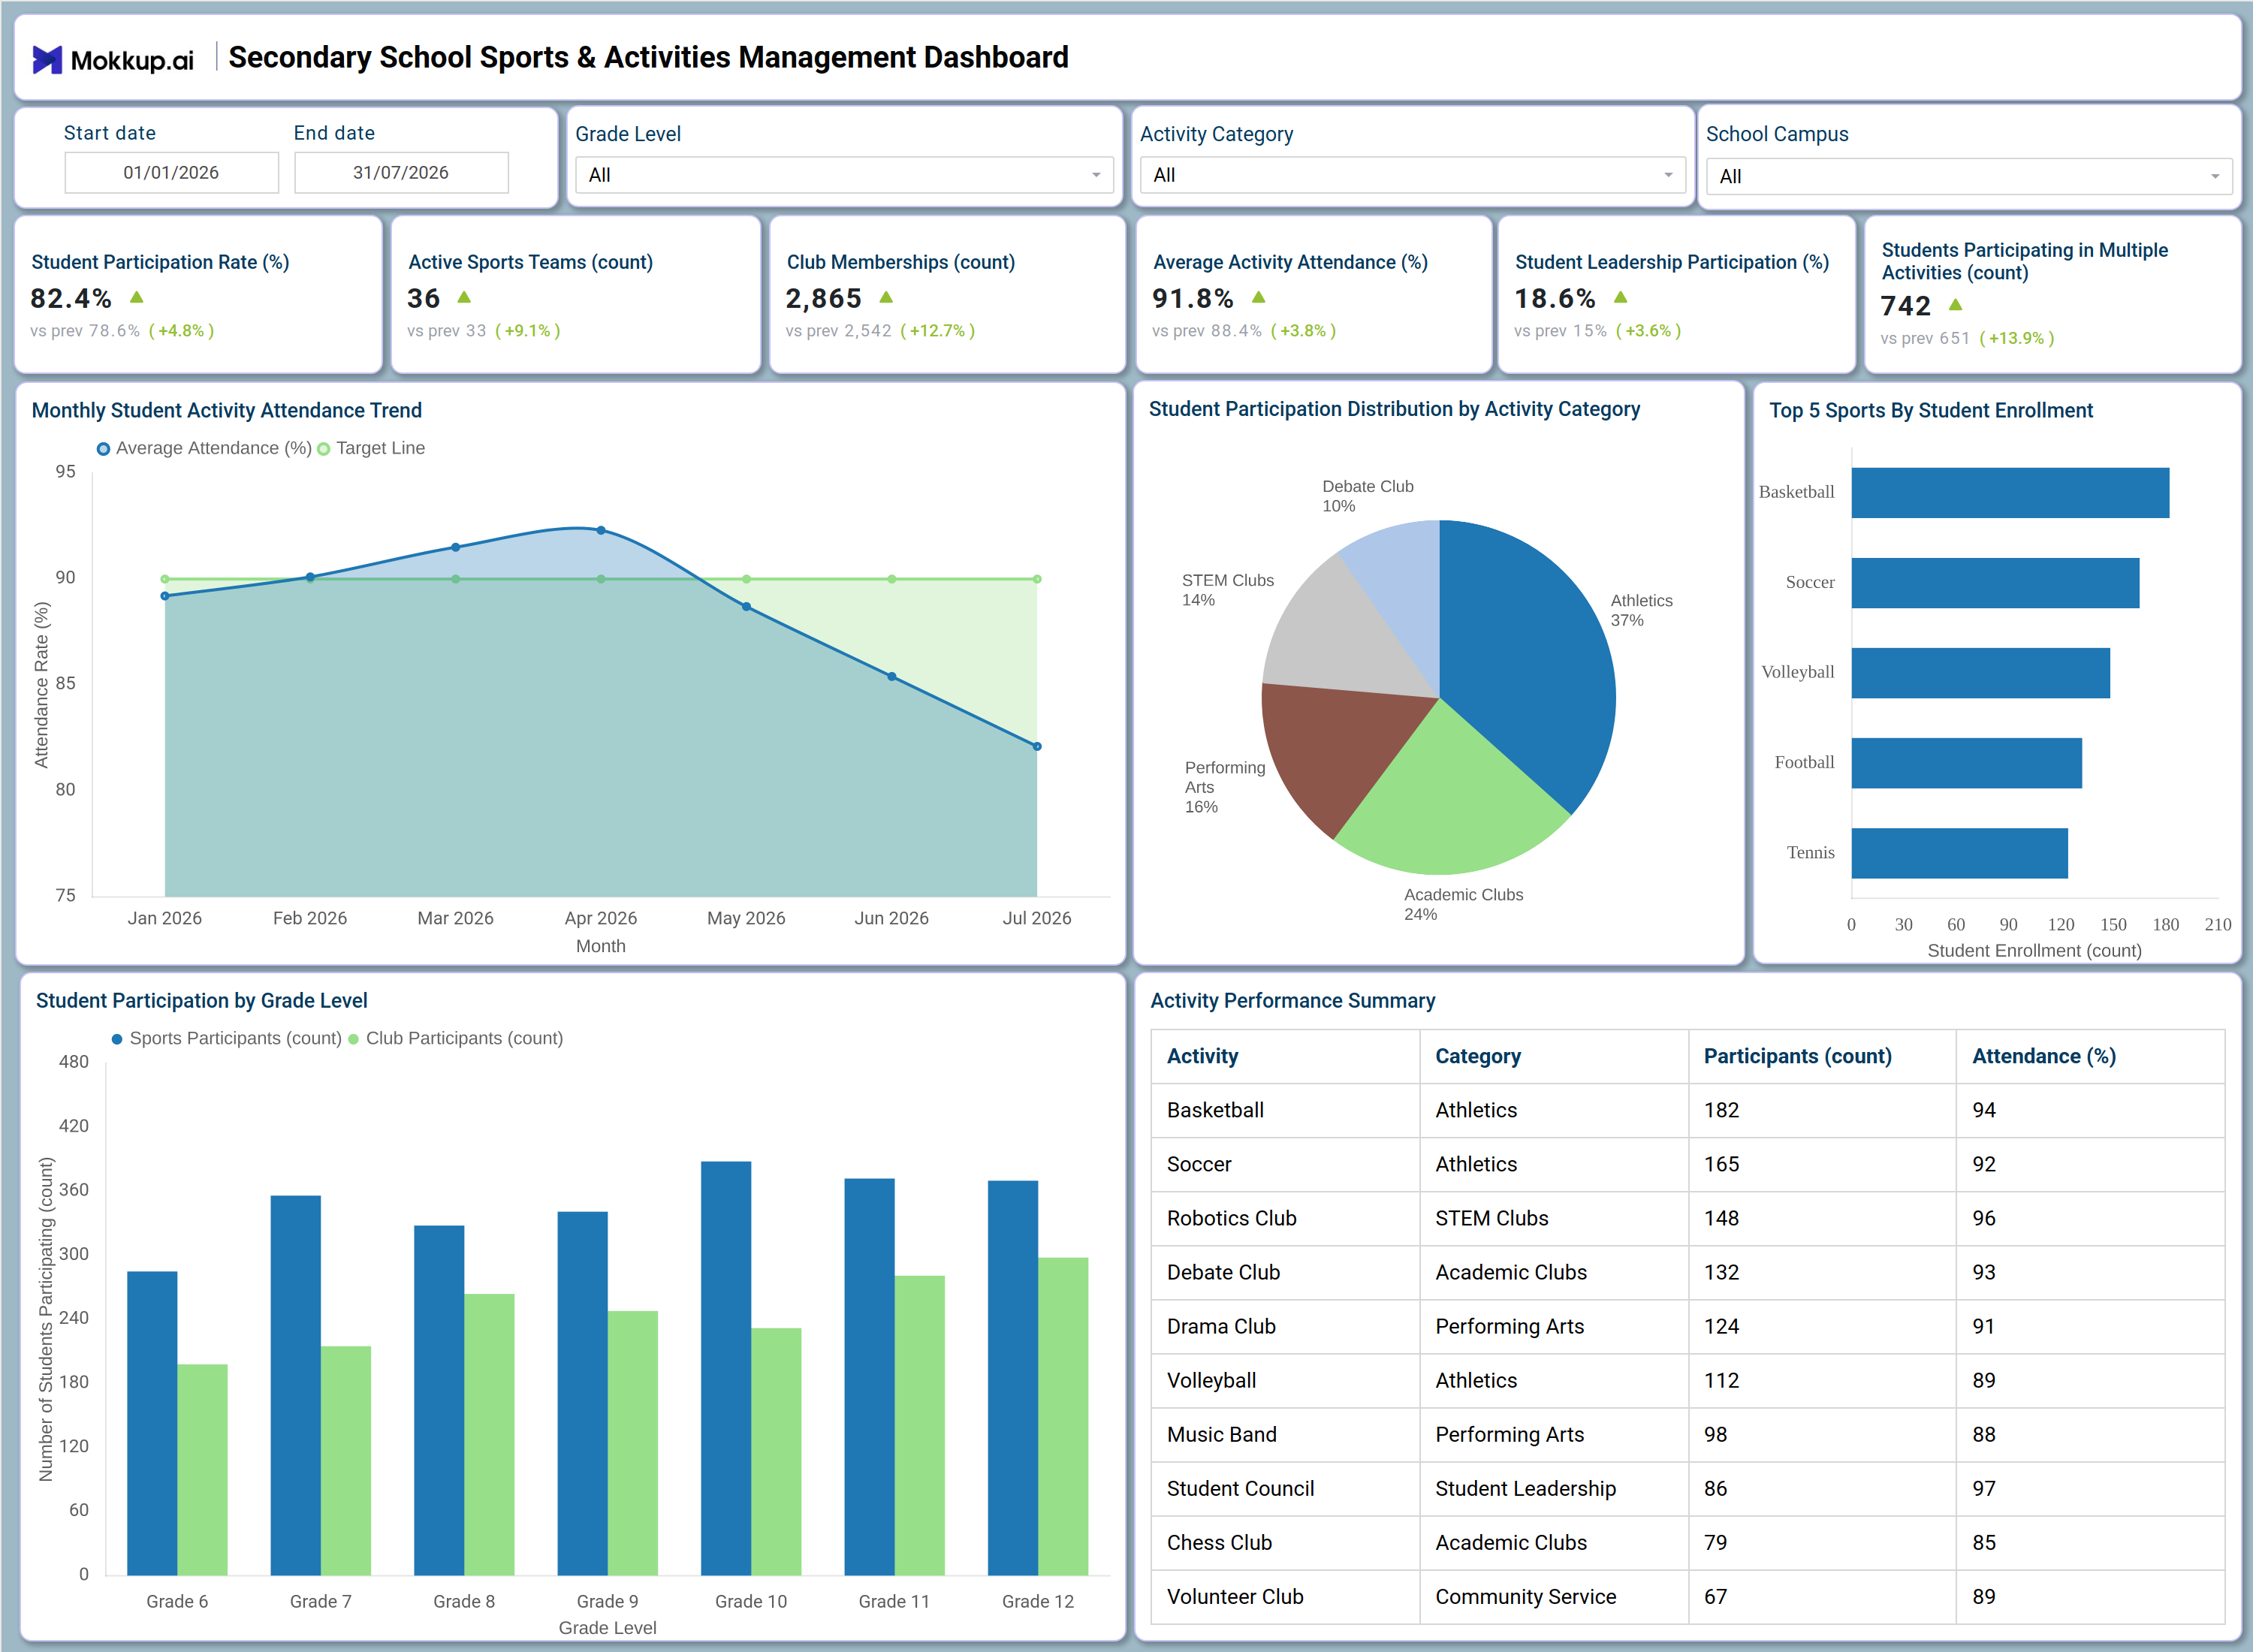
What is a Secondary School Sports & Activities Management Dashboard
The Secondary School Sports & Activities Management Dashboard is a student sports and activities dashboard designed for athletic directors, activity coordinators, and school administrators who need a consolidated view of extracurricular engagement. It brings together participation data across athletics, academic clubs, performing arts, and STEM programs so staff can see how students are engaging with sports and clubs throughout the school year. The dashboard supports student participation rate monitoring alongside attendance, leadership involvement, and cross-activity engagement, giving schools a single reference point instead of separate spreadsheets for each program. Filters for date range, grade level, activity category, and school campus let staff narrow the view to the segment that matters for a given review, whether that is a single sport, a specific grade, or a full semester of programming.
How to Create a Secondary School Sports & Activities Management Dashboard
You don't need to build your report from scratch; just start with a ready-to-use dashboard template from Mokkup. Add in your data and export it however you like. Here's how to do it:
1. Create or Log in to Your Mokkup Account
Start by signing up on Mokkup.ai using your email. If you already have an account, just log in, and you'll be good to go.
2. Choose and Customize Your Dashboard Template
Find the Secondary School Sports & Activities Management Dashboard template in the Templates section. Use the drag-and-drop editor to adjust KPIs, edit filters, or add elements based on your data.
3. Export to Your BI Tool
Once your dashboard wireframe is ready, use the BI Tool Export feature to send it directly to Power BI or Tableau for further analysis and enhancements. You can also download the dashboard as a PDF, PNG, or JPEG, embed it on a platform, or invite your team to collaborate.
Note: This is a Pro template. You'll need a Pro subscription on Mokkup to use and customize this dashboard wireframe. Upgrade anytime to unlock full access.
Secondary School Sports & Activities Management Dashboard Example
An activities coordinator typically opens this dashboard at the start of a new marking period to understand how student engagement is trending across sports and clubs before the next planning cycle. They come in with a specific question: which programs are gaining or losing participants, and where does student activity attendance tracking suggest attention is needed? Using the date range and grade level filters, they narrow the view to the period and cohort under review before digging into the deeper detail.
From there, the dashboard supports several decisions. Coordinators can identify which activity categories are attracting the most students so they can plan for facility and staffing needs accordingly, and compare grade-level participation to see whether older or younger students are gravitating toward sports over clubs. When attendance for a particular month dips, staff can use that signal to check in with coaches or club sponsors before enrollment declines further. Sports team enrollment analysis becomes straightforward when comparing enrollment across the top programs, helping athletic directors decide where to add sections or recruit additional coaching support.
The result is a shared, consistent view that helps administrators, coaches, and club sponsors align on where student engagement is strong and where it needs reinforcement. Rather than relying on anecdotal reports from individual programs, the school can back extracurricular planning, budget requests, and staffing decisions with a consolidated picture of participation, attendance, and leadership involvement across the entire activities calendar.
How to Analyze Data in a Secondary School Sports & Activities Management Dashboard
Here is how you can analyze data from this dashboard:
- Compare participation by grade: Use the Grade Level filter to analyze sports and club participation trends across Grades 6 through 12.
- Analyze activity categories: Apply the Activity Category filter to evaluate participation in Athletics, Academic Clubs, Performing Arts, STEM Clubs, or Debate Club.
- Review campus performance: Filter by School Campus to assess participation for a specific location.
- Monitor attendance trends: Track the Monthly Student Activity Attendance Trend chart to identify seasonal declines before student retention is affected.
- Evaluate activity popularity: Review the Student Participation Distribution by Activity Category chart to identify the most popular activity types.
- Track sports enrollment: Use the Top 5 Sports by Student Enrollment chart to analyze team enrollment and identify programs approaching capacity.
- Compare grade-level preferences: Review the Student Participation by Grade Level chart to understand whether students prefer sports or club activities.
- Assess activity performance: Check the Activity Performance Summary table to compare attendance percentages and participant counts for each activity.
Benefits of a Secondary School Sports & Activities Management Dashboard
The following are the benefits of using this dashboard:
- Centralize participation data: Combine sports and club participation across all grade levels in a single dashboard.
- Track student attendance: Monitor student activity attendance across multiple extracurricular categories from one view.
- Reduce reporting effort: Replace manual extracurricular reporting with pre-built KPI tiles and visual charts.
- Support program planning: Track club membership by grade level to guide budgeting and staffing decisions.
- Optimize resource allocation: Analyze participation by activity category to support facility and resource planning.
- Align extracurricular teams: Give athletic directors and activity coordinators a shared view of enrollment data without rebuilding reports each season.
- Monitor participation performance: Provide administrators, coaches, and club sponsors with a consistent view of student participation trends.
KPIs to Track in a Secondary School Sports & Activities Management Dashboard
The following key KPIs can be tracked by using this dashboard:
- Student Participation Rate (%) - Supports student participation rate monitoring by measuring the share of enrolled students engaged in at least one sport or club.
- Active Sports Teams (count) - Tracks the total number of operating sports teams to gauge program breadth across the school.
- Club Memberships (count) - Feeds club membership tracking dashboard reporting by quantifying enrollment across all club categories.
- Average Activity Attendance (%) - Evaluates attendance consistency across sports and clubs to flag activities losing engagement.
- Student Leadership Participation (%) - Supports student leadership participation tracking by measuring the proportion of students holding leadership roles within activities.
- Students Participating in Multiple Activities (count) - Measures cross-activity involvement to understand how many students balance sports and clubs at once.
Frequently Asked Questions
1. What industries benefit most from this Secondary School Sports & Activities Management Dashboard?
Secondary schools, school districts, and independent athletic departments benefit most from this student sports activity dashboard. Activity coordinators, athletic directors, and school administrators use it to track sports and club engagement across campuses.
2. Can this dashboard track club membership trends by grade level?
Yes. The Student Participation by Grade Level chart breaks down sports and club participants by grade, and the Grade Level filter narrows every other chart to the same cohort for club membership tracking dashboard analysis.
3. Is this dashboard suitable for comparing sports team enrollment across different campuses?
Yes. The School Campus filter isolates participation and enrollment data by location, making it easy to run sports team enrollment analysis and student leadership participation tracking side by side across campuses before rolling results up district-wide.