
What is a Secondary School Procurement Dashboard?
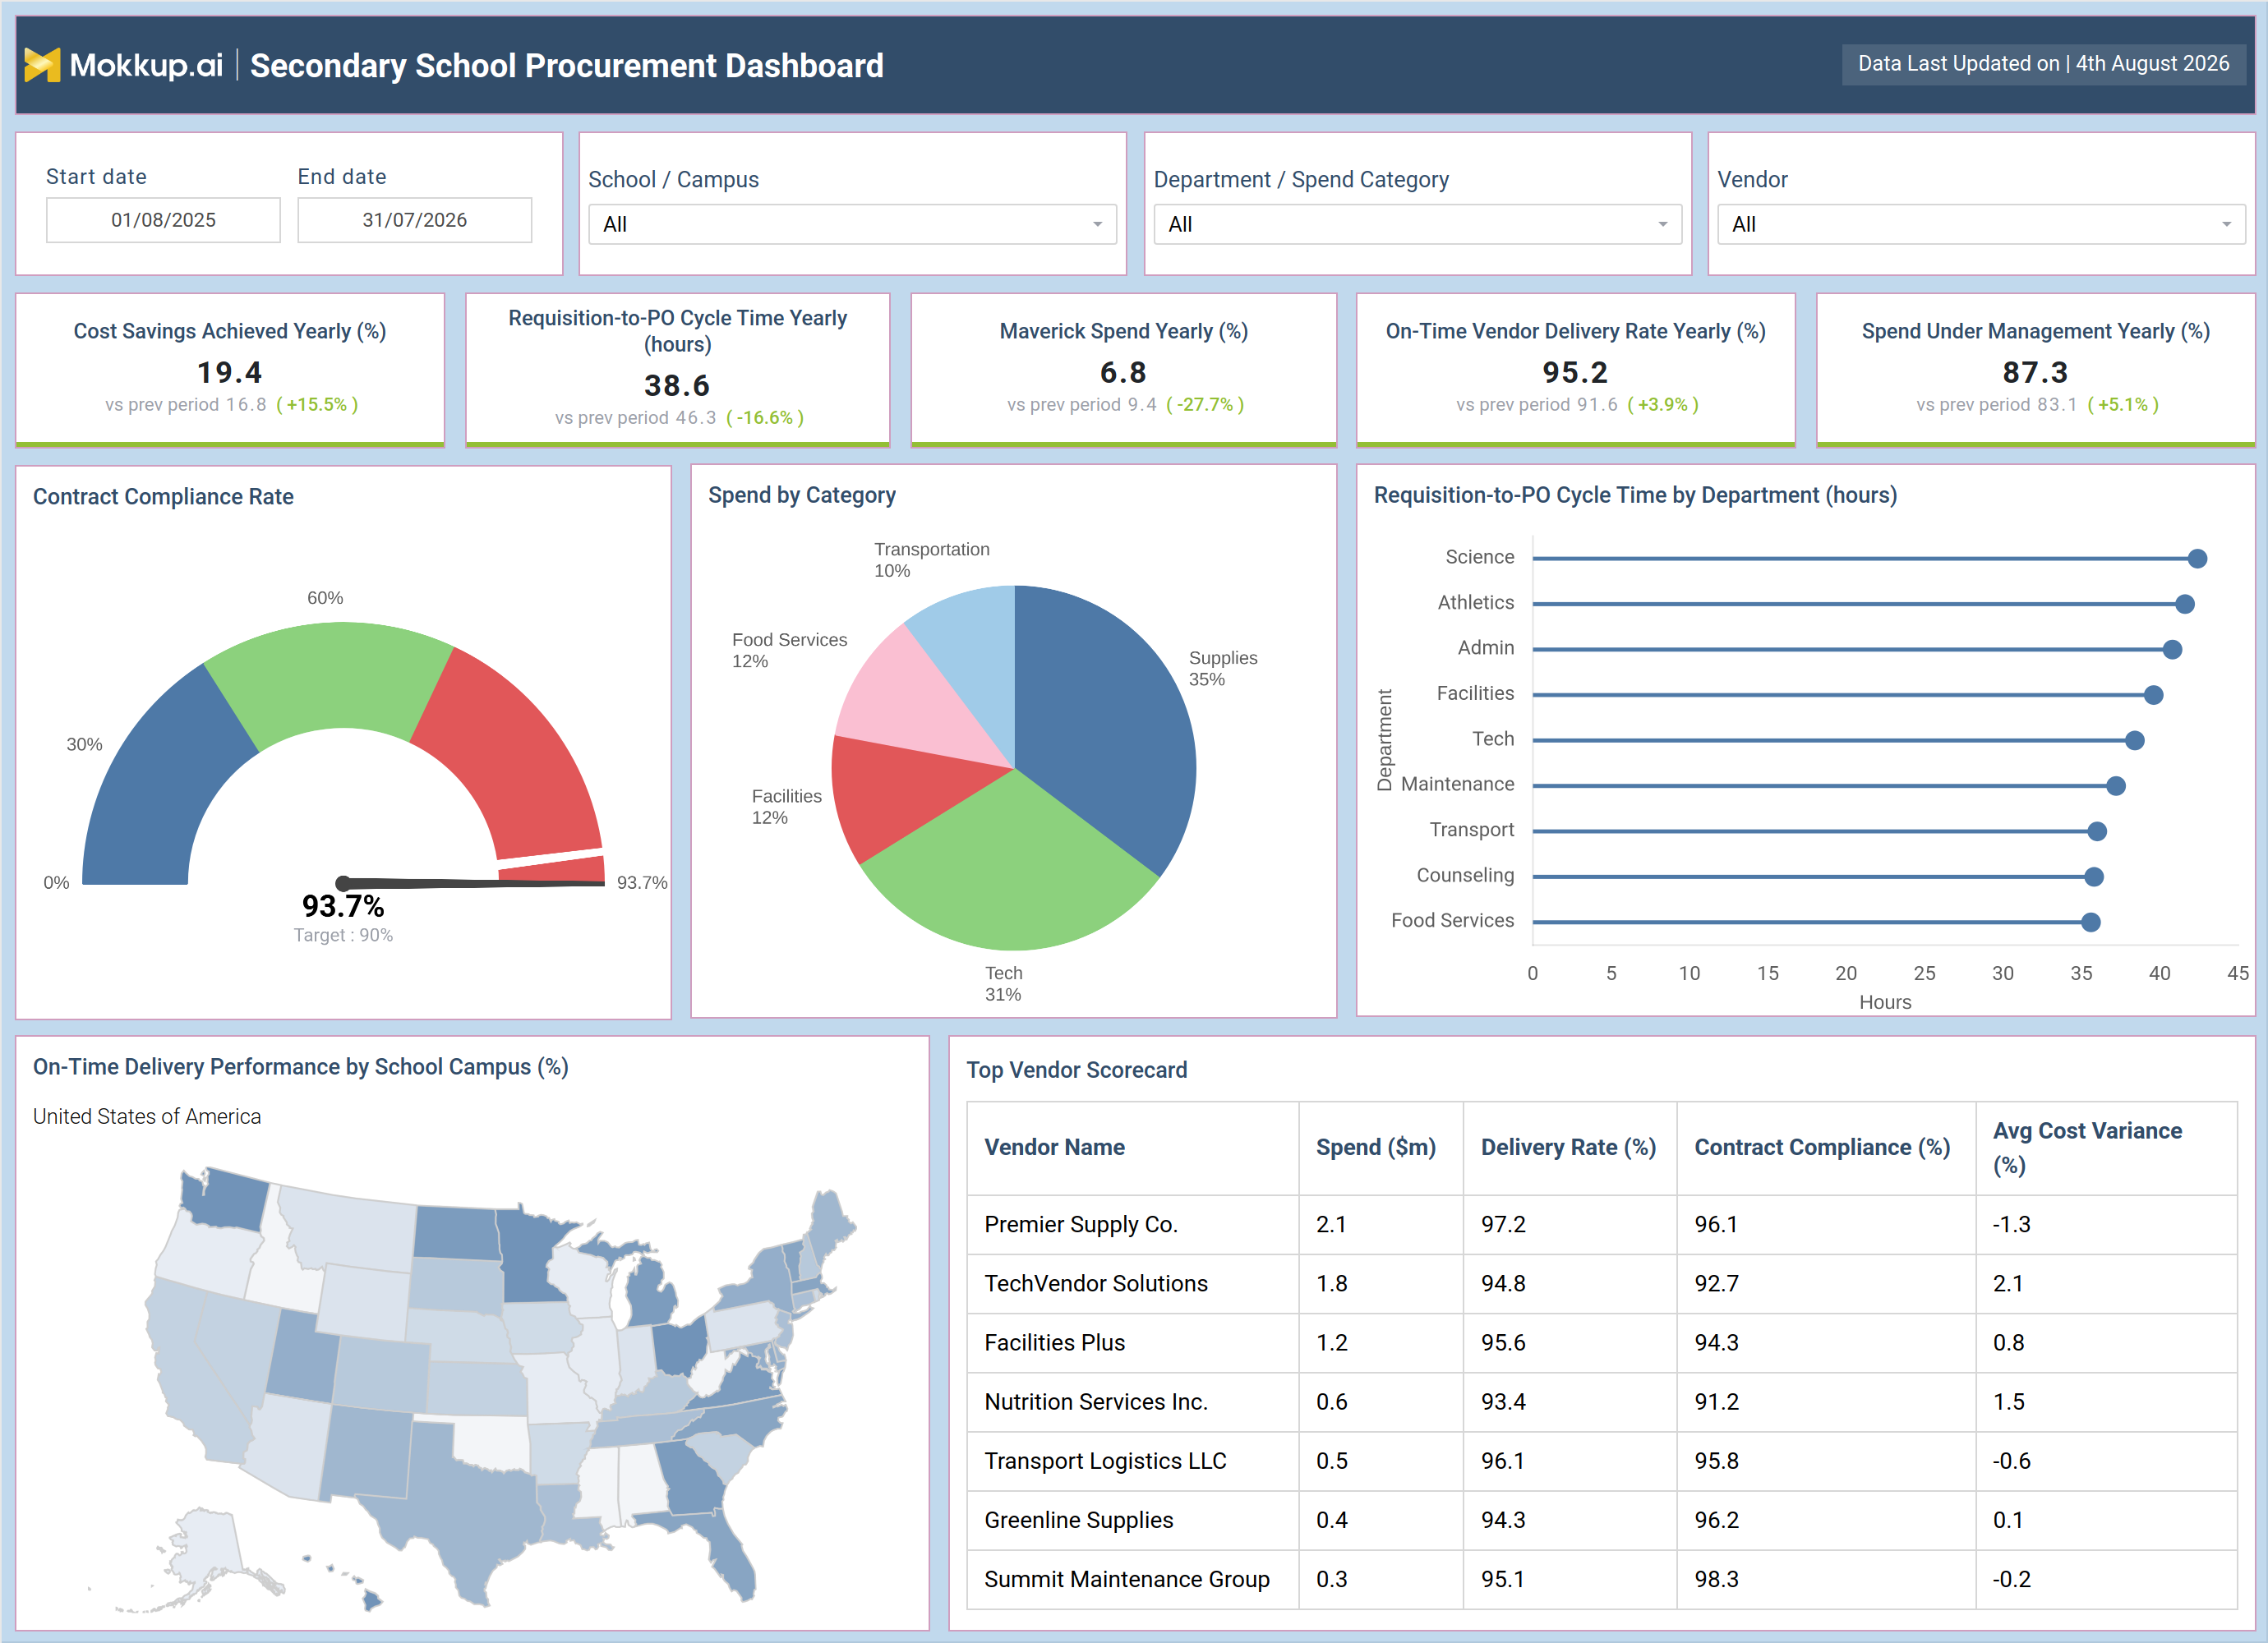
The Secondary School Procurement Dashboard gives district procurement teams and school business officers a single view into how purchasing performs across departments, vendors, and campuses. Built for K-12 sourcing, contracts, and vendor management staff, this secondary school procurement dashboard consolidates spend, cycle time, and delivery performance data that would otherwise sit scattered across purchase order systems, vendor contracts, and finance spreadsheets. Instead of reconciling numbers from separate sources, procurement directors can filter by school or campus, department or spend category, and vendor to see exactly where purchasing dollars are going and how efficiently requisitions move through to purchase order. The dashboard functions as a requisition-to-PO cycle time tracking tool that also surfaces contract adherence, so leadership can judge whether purchasing policy is actually being followed and not just documented on paper. For district finance offices managing multiple campuses, having this level of visibility in one wireframe template makes it easier to standardize procurement practices and hold every department to the same purchasing discipline.
How to Create a Secondary School Procurement Dashboard
You don't need to build your report from scratch; just start with a ready-to-use dashboard template from Mokkup. Add in your data and export it however you like. Here's how to do it:
1. Create or Log in to Your Mokkup Account
Start by signing up on Mokkup.ai using your email. If you already have an account, just log in, and you'll be good to go.
2. Choose and Customize Your Dashboard Template
Find the Secondary School Procurement Dashboard template in the Templates section. Use the drag-and-drop editor to adjust KPIs, edit filters, or add elements based on your data.
3. Export to Your BI Tool
Once your dashboard wireframe is ready, use the BI Tool Export feature to send it directly to Power BI or Tableau for further analysis and enhancements. You can also download the dashboard as a PDF, PNG, or JPEG, embed it on a platform, or invite your team to collaborate.
Note: This is a Pro template. You'll need a Pro subscription on Mokkup to use and customize this dashboard wireframe. Upgrade anytime to unlock full access.
Secondary School Procurement Dashboard Example
A district procurement manager typically opens this dashboard at the start of a budget cycle or vendor review to understand how purchasing is trending across the district. The first question is usually whether spend is staying within approved categories and whether cycle times are improving or slipping as new requisitions come in from schools. From the main view, procurement leads can compare how quickly requisitions convert into purchase orders across departments, identifying which teams are causing bottlenecks and which are operating efficiently. Finance officers can review how spend is distributed across categories such as supplies, technology, facilities, food services, and transportation, helping them decide where tighter controls or renegotiated contracts reduce cost.
Sourcing teams can also run vendor scorecard analysis for school districts to compare delivery reliability, pricing consistency, and contract adherence side by side, so they can prioritize renewals with top performers and flag vendors whose performance is slipping before it affects service continuity. When delivery issues appear concentrated in specific campuses, teams can drill into regional performance to understand whether the problem is vendor-specific or tied to a particular school's logistics. Ultimately, the dashboard helps procurement and finance teams move from reactive purchasing to a disciplined, data-informed process. Instead of waiting for an audit to reveal maverick spend or missed contract terms, teams can catch these issues early and correct course, protecting budget integrity while keeping schools supplied with what they need on time.
How to Analyze Data in a Secondary School Procurement Dashboard
Here is how you can analyze data from this dashboard:
- Use the date range and School/Campus filters to narrow this secondary school procurement dashboard to a specific campus or budget period.
- Break down spend by Department/Spend Category to see which categories draw the largest share of budget.
- Use this requisition-to-PO cycle time tracking tool view to see where departmental approvals bottleneck.
- Apply the vendor filter and run maverick spend rate monitoring for schools to flag off-contract purchases.
- Review the Top Vendor Scorecard to compare delivery rate, contract compliance, and cost variance by vendor.
- Use the On-Time Delivery Performance map to spot campuses with recurring delivery delays.
Benefits of a Secondary School Procurement Dashboard
The following are the benefits of using this dashboard:
- Cuts time spent reconciling procurement data from multiple systems into one view.
- Improves budget discipline through maverick spend rate monitoring for schools that catches contract exceptions early.
- Speeds up requisition approvals by highlighting departments where cycle time lags.
- Strengthens vendor scorecard analysis for school districts to support renewal and renegotiation decisions.
- Increases accountability across campuses with side-by-side delivery and compliance comparisons.
- Supports audit readiness by keeping this contract compliance rate tracking dashboard visible year-round.
KPIs to Track in a Secondary School Procurement Dashboard
The following key KPIs can be tracked by using this dashboard:
- Cost Savings Achieved (%) - the share of procurement budget saved through negotiated pricing, discounts, and contract terms versus list cost.
- Requisition-to-PO Cycle Time (hours) - the average time between a requisition being submitted and a purchase order being issued.
- Maverick Spend (%) - the share of purchases made outside approved contracts or preferred vendors, a key indicator of budget risk.
- On-Time Vendor Delivery Rate (%) - the percentage of vendor orders delivered by the agreed date, reflecting supply chain reliability.
- Spend Under Management (%) - this spend under management tracking for schools metric captures the portion of total spend actively tracked and controlled by procurement.
Frequently Asked Questions
1. What is a Secondary School Procurement Dashboard used for?
It gives school district procurement and finance teams a single view of purchasing performance, covering spend, vendor delivery, and contract compliance across departments and campuses. It replaces manual reconciliation across separate purchase order and vendor systems with one dashboard.
2. How does the dashboard help control maverick spend?
The dashboard tracks maverick spend as a dedicated KPI, showing what percentage of purchases fall outside approved vendors or contracts. Teams can filter by department to see where policy exceptions are concentrated and address them early.
3. Can I customize this dashboard for my district's data?
Yes. The dashboard supports spend under management tracking for schools using your own data, filters, and vendor list once you customize the template in Mokkup and export it to your preferred BI tool.