
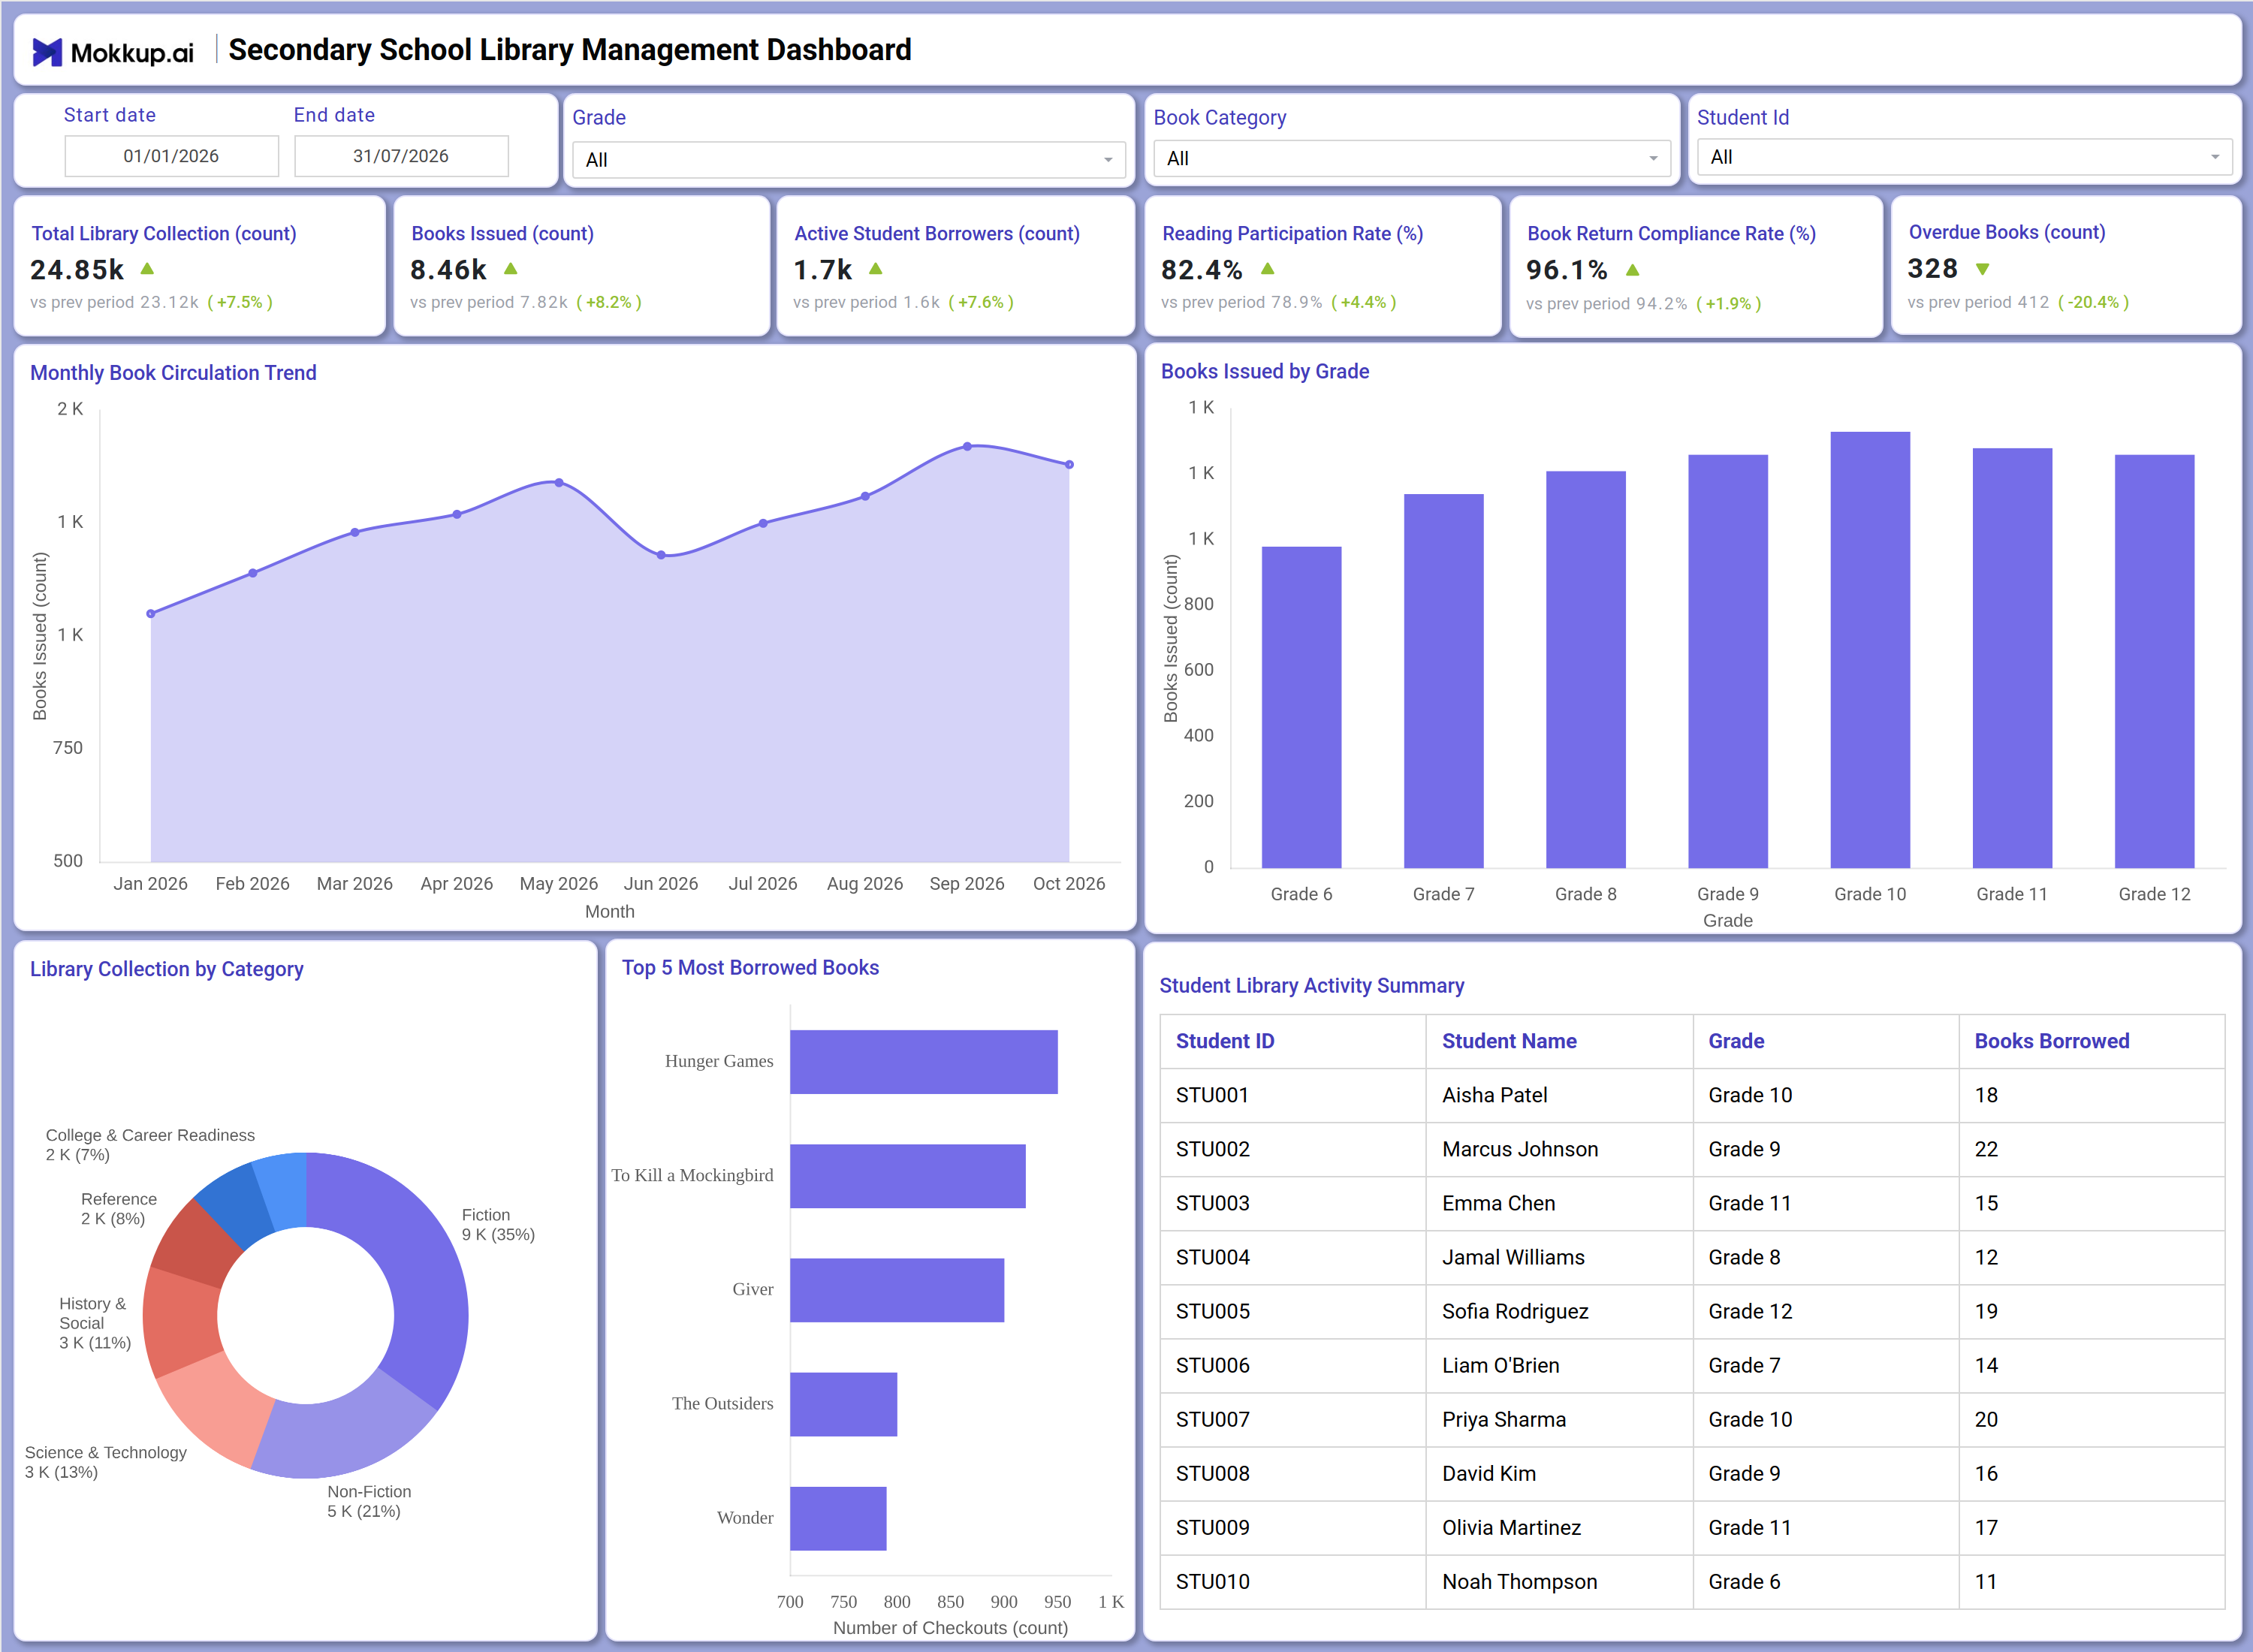
What is a Secondary School Library Management Dashboard
A secondary school library management dashboard gives librarians, school administrators, and academic teams a consolidated view of how a school library's collection is being used across grades and subjects. It brings together book circulation volumes, borrower activity, and a library collection by category dashboard structure into one screen, so staff no longer need to compile figures from separate spreadsheets or catalog systems. The dashboard also surfaces which titles are most in demand and how compliant students are with return timelines, giving library teams the visibility needed to plan acquisitions and enforce lending policies. Built for grades 6 through 12, it adapts to any secondary school looking to run its library operations with more structure and less manual reporting.
How to Create a Secondary School Library Management Dashboard
You don't need to build your report from scratch; just start with a ready-to-use dashboard template from Mokkup. Add in your data and export it however you like. Here's how to do it:
1. Create or Log in to Your Mokkup Account
Start by signing up on Mokkup.ai using your email. If you already have an account, just log in, and you'll be good to go.
2. Choose and Customize Your Dashboard Template
Find the Secondary School Library Management Dashboard template in the Templates section. Use the drag-and-drop editor to adjust KPIs, edit filters, or add elements based on your data.
3. Export to Your BI Tool
Once your dashboard wireframe is ready, use the BI Tool Export feature to send it directly to Power BI or Tableau for further analysis and enhancements. You can also download the dashboard as a PDF, PNG, or JPEG, embed it on a platform, or invite your team to collaborate.
Note: This is a Pro template. You'll need a Pro subscription on Mokkup to use and customize this dashboard wireframe. Upgrade anytime to unlock full access.
Secondary School Library Management Dashboard Example
A school librarian typically opens this dashboard at the start of a term to understand how actively students across grades are engaging with the collection and whether lending policies are working as intended. Working within a set date range, the librarian narrows the view by grade, book category, or a specific student ID to answer a focused question, such as which grade level is falling behind on reading engagement or which category of books needs replenishing. From this single screen, the librarian can track how book circulation trend dashboard patterns shift month over month, identifying whether checkouts are rising ahead of exam periods or dropping off during holidays. By comparing issued volumes across grades, staff can pinpoint which grade levels are underutilizing the library and target outreach accordingly.
Looking at the most borrowed titles helps the team decide which popular series need additional copies, while reviewing return compliance and overdue counts lets them flag students or grades that need reminders before overdue items affect access to new checkouts. Altogether, the dashboard helps library staff move from reactive record-keeping to a proactive approach where reading participation rate tracking, collection health, and student borrowing behavior are reviewed together. This gives school leadership more confidence that the library is being used effectively and that acquisition budgets are directed toward the categories and titles students actually want.
How to Analyze Data in a Secondary School Library Management Dashboard
Here is how you can analyze data from this dashboard:
- Compare borrowing trends: Use the Grade filter to analyze book circulation patterns across Grades 6 through 12.
- Analyze collection categories: Apply the Book Category filter to evaluate Fiction, Non-Fiction, Science & Technology, or Reference titles separately.
- Review student activity: Search by Student ID to view an individual's borrowing history in the Student Library Activity Summary table.
- Monitor circulation trends: Track the Monthly Book Circulation Trend chart to identify seasonal declines in library usage.
- Identify low-engagement grades: Review Books Issued by Grade to determine which grade levels borrow fewer books than the school average.
- Evaluate collection balance: Analyze the Library Collection by Category to identify sections that may need additional resources.
- Prioritize popular titles: Track the Top 5 Most Borrowed Books to determine which books require additional copies.
- Compare performance over time: Adjust the start and end date range to evaluate circulation trends across different academic terms.
Benefits of a Secondary School Library Management Dashboard
The following are the benefits of using this dashboard:
- Centralize library operations: Combine collection size, circulation volume, and borrower activity into a single secondary school library management dashboard.
- Track overdue books: Monitor overdue book trends to identify rising overdue counts before they affect student access.
- Plan library acquisitions: Analyze the library collection by category to support future book purchasing decisions.
- Reduce reporting effort: Replace manual monthly circulation reports with pre-built KPI tiles and visualizations.
- Improve reading engagement: Identify grade levels that need targeted reading promotion initiatives.
- Review student borrowing activity: Access the Student Library Activity Summary table to evaluate individual borrowing patterns.
- Support collection planning: Use borrowing trend insights to determine which popular titles should be reordered.
KPIs to Track in a Secondary School Library Management Dashboard
The following key KPIs can be tracked by using this dashboard:
- Total Library Collection (count) - Tracks the total number of books and materials owned by the library, providing a baseline for collection size planning.
- Books Issued (count) - Measures how many books were checked out within the selected period, reflecting overall circulation activity.
- Active Student Borrowers (count) - Counts distinct students who borrowed at least one book, indicating the breadth of library engagement.
- Reading Participation Rate (%) - Reflects the share of enrolled students actively borrowing books, a key signal for reading participation rate tracking across grades.
- Book Return Compliance Rate (%) - Captures the book return compliance rate at which borrowed items are returned on time, highlighting how well lending policies are being followed.
- Overdue Books (count) - Tracks the number of items past their due date, helping staff prioritize follow-up before backlogs grow.
Frequently Asked Questions
1. What schools benefit most from a secondary school library management dashboard?
Middle and high schools with Grade 6 through Grade 12 use this dashboard to track collection usage, circulation trends, and borrower activity. Library staff, school administrators, and academic coordinators all rely on it to plan acquisitions and monitor reading engagement.
2. Can this dashboard track overdue books and return compliance together?
Yes, this overdue books tracking dashboard displays Overdue Books alongside Book Return Compliance Rate, so librarians can see how lending discipline affects the collection's availability. This pairing makes it easier to flag grades or categories with recurring return delays.
3. What does the Library Collection by Category chart show?
This donut chart breaks the total collection down by genre, such as Fiction, Non-Fiction, Science & Technology, and Reference, showing what share each category holds. It helps librarians decide where to expand or trim the collection based on actual category distribution.