
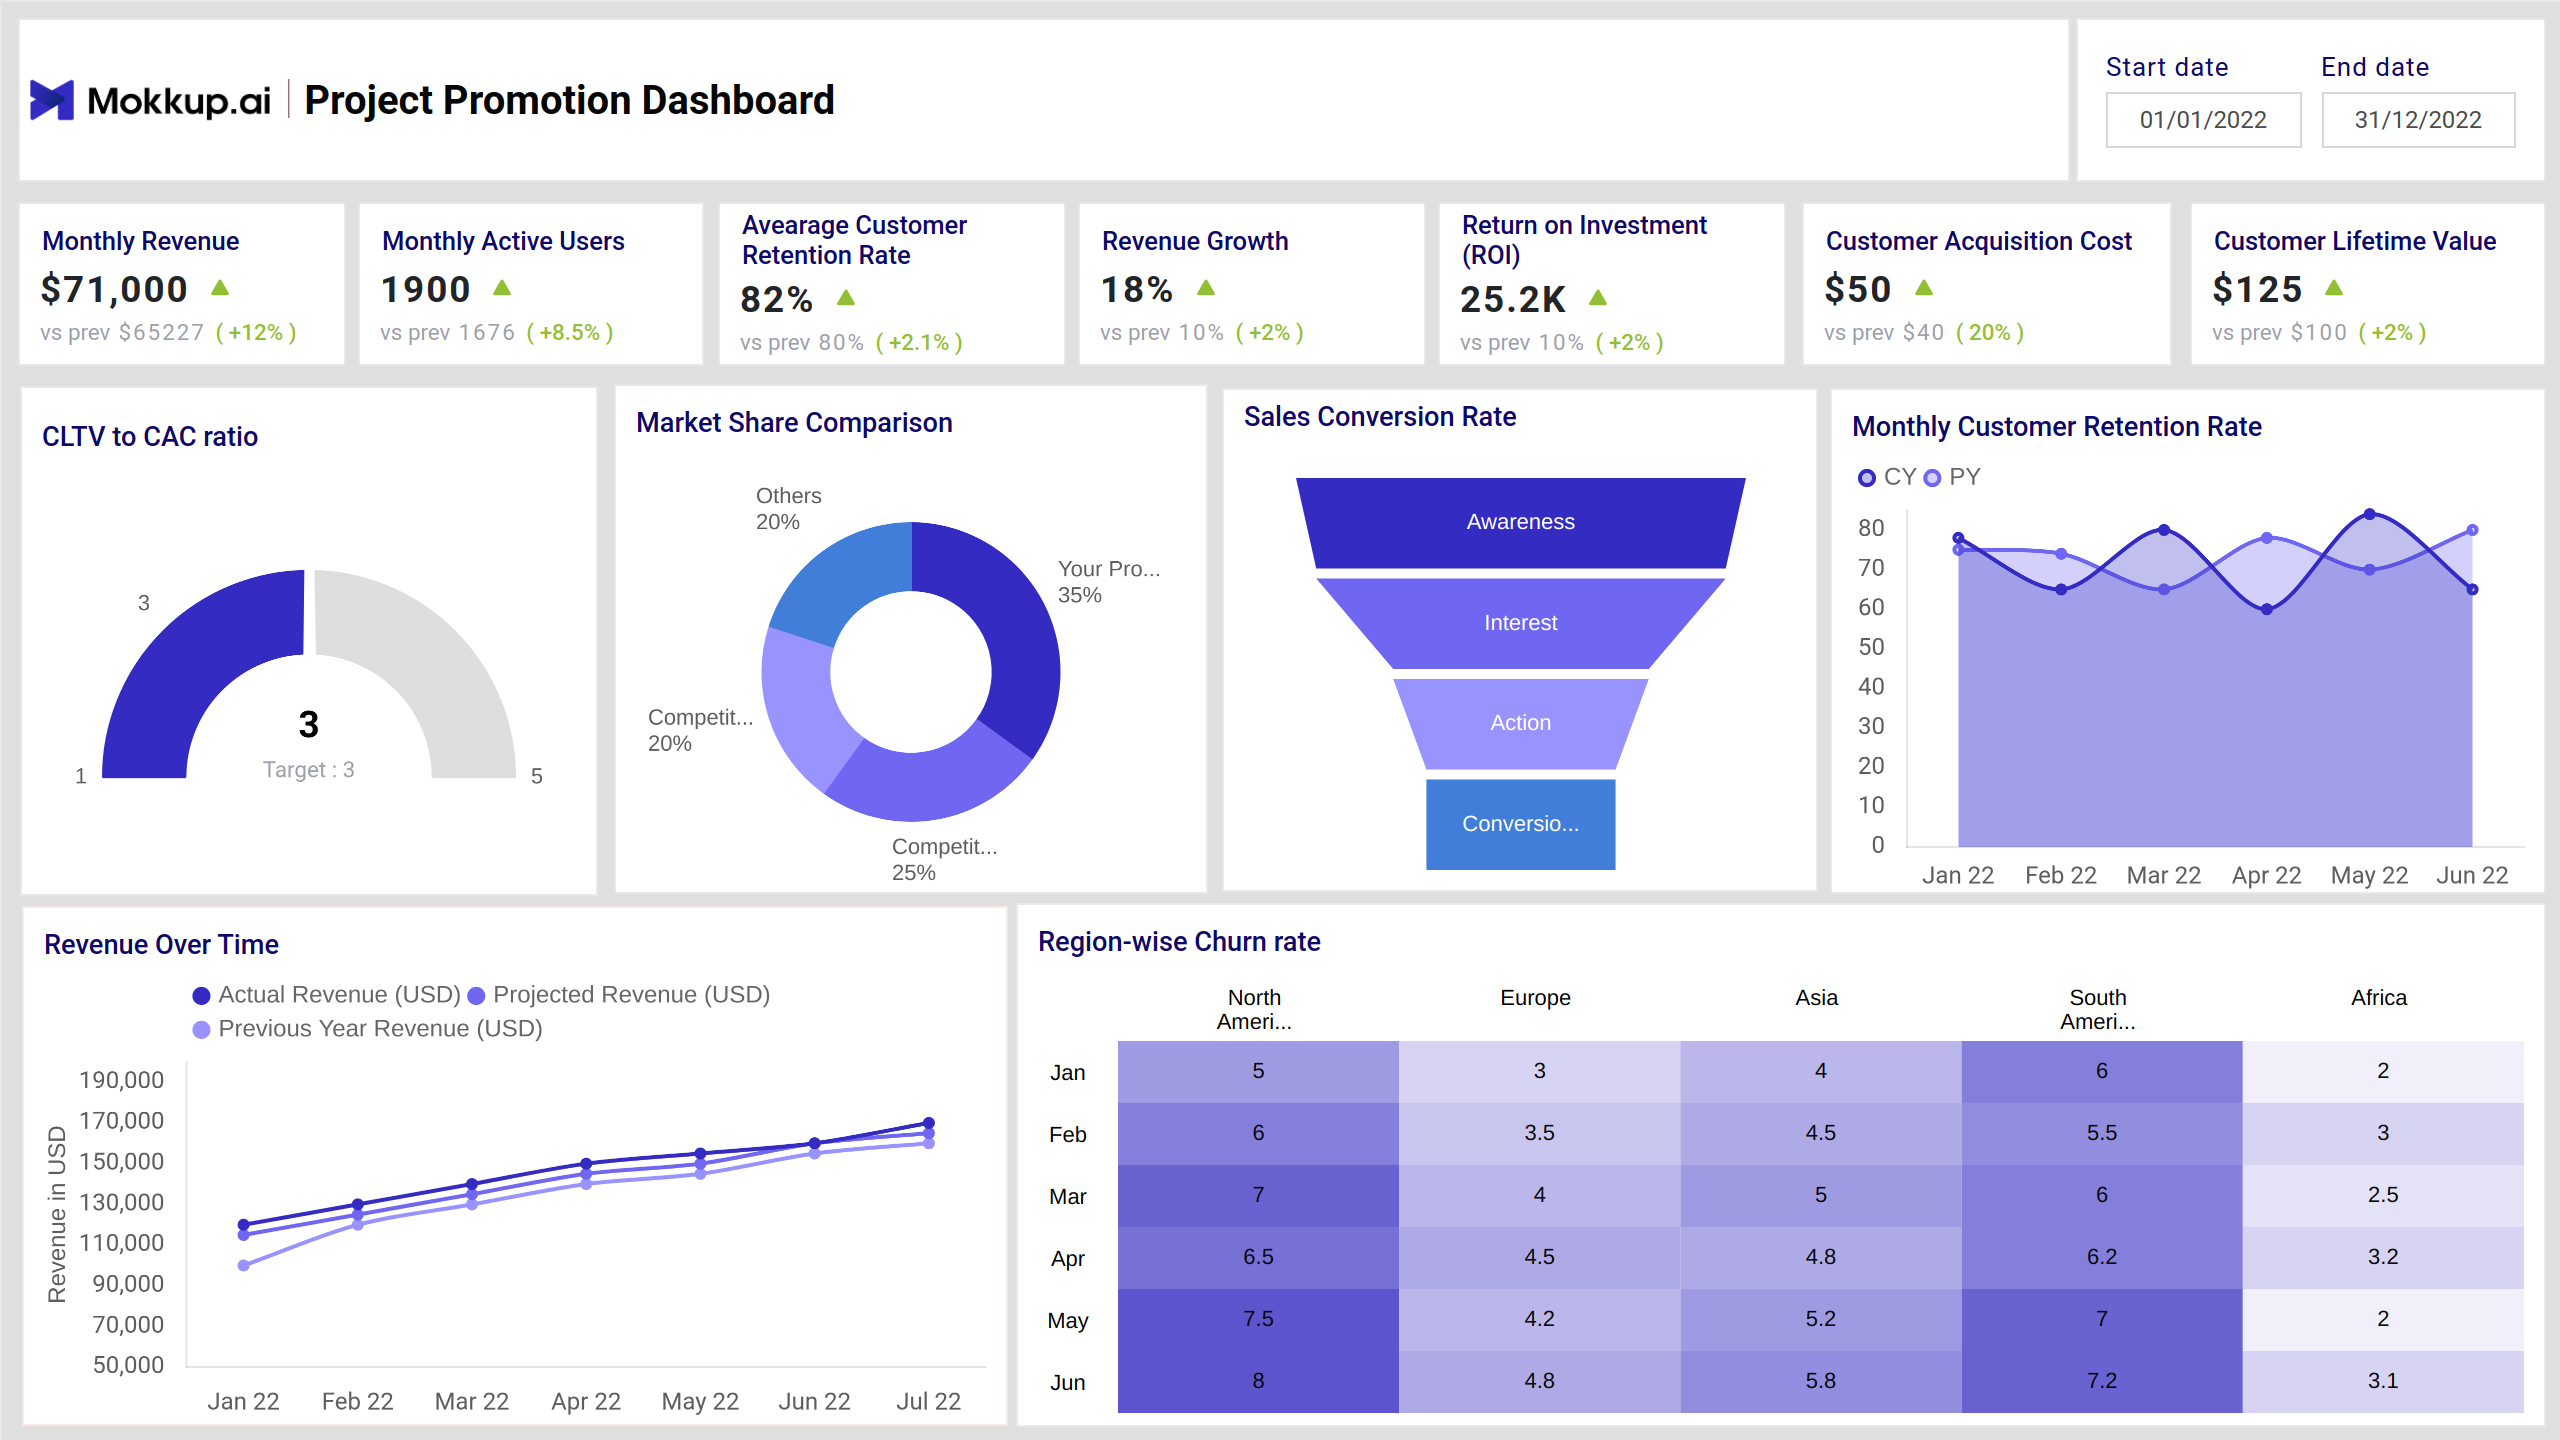
This project promotion dashboard can provide promotion data insights to the companies to make smart business decisions and maxiomize their efforts. It can help you do promotion analytics with an interpretation of real-time performance metrics like engagement, conversion rates, and ROI.
Project Promotion Dashboard
It’s a marketing KPI dashboard that appropriately tracks the promotional efforts with the help of major customer-related metrics to optimize campaign success. This dashboard wireframe is suitable for facilitating the promotion data insights that can helop you identify top-performing content and engagement trends that can give measurable outcome.
Key Terms to Know:
- Monthly Revenue: It refers to the total revenue generated from the promotion of a project within a given month.
- Monthly Active Users: It calculates the number of users who have engaged with project within the defined month.
- Average Customer Retention Rate: This metrics defines the percentage of customers who continue engaging with a project, service, or product over a specific period.
- Revenue Growth: This KPI measures an increase in the revenue generated as a result of promotional activities for a specific project.
- Retrun on Investment (ROI): It is the measurement of the profitability and effectiveness of promotional activities related to a project.
- Customer Acquisition Cost: This metric evaluates the total cost of acquiring a new customer through marketing and promotional activities related to a specific project.
- Customer Lifetime Value: This KPI measures the total revenue a business can expect from a single customer over their entire relationship with the company.
- CLTV to CAC Ratio: This ratio is used to assess the efficiency and profitability of a company's customer acquisition strategy.
- Market Share Comparison: This metric compares the market share of different projects, brands, or products within a specific industry.
- Sales Conversion Rate: It indicates the percentage of potential customers or leads who take the desired action and convert into paying customers.
- Monthly Customer Retention Rate: This KPI measures the percentage of customers who continue to use or engage with your service/product over the course of a month.
- Revenue Over Time: This metrics shows how the revenue generated from a particular promotion changes over a specified period.
- Region-Wise Churn Rate: It is the measurement of the rate at which customers or clients in different regions stop engaging with the project or service over a specific period of time.
Dashboard Template Insights
- This customizable dashboard template can act as a marketing dashboard providing an accurate snapshot of project success.
- With the centralized interface, it displays various promotion metrics that makes project tracking much smoother.
- This dashboard wireframe provides deep marketing insights that can be helpful in identifying the bottlenecks and suggest improvements with the strategies.
- It can be treated as one of the campaign tracking tools to evaluate the effectiveness of the promotion efforts.
Conclusion
The project promotion dashboard can provide real-time project analytics for measuring the performance of campaigns by identifying the patterns. With project performance tracking, Teams can align goals and track progress in one shared dashboard and easily share with the stakeholders involved.