
What is a Primary Schools Library Management Dashboard
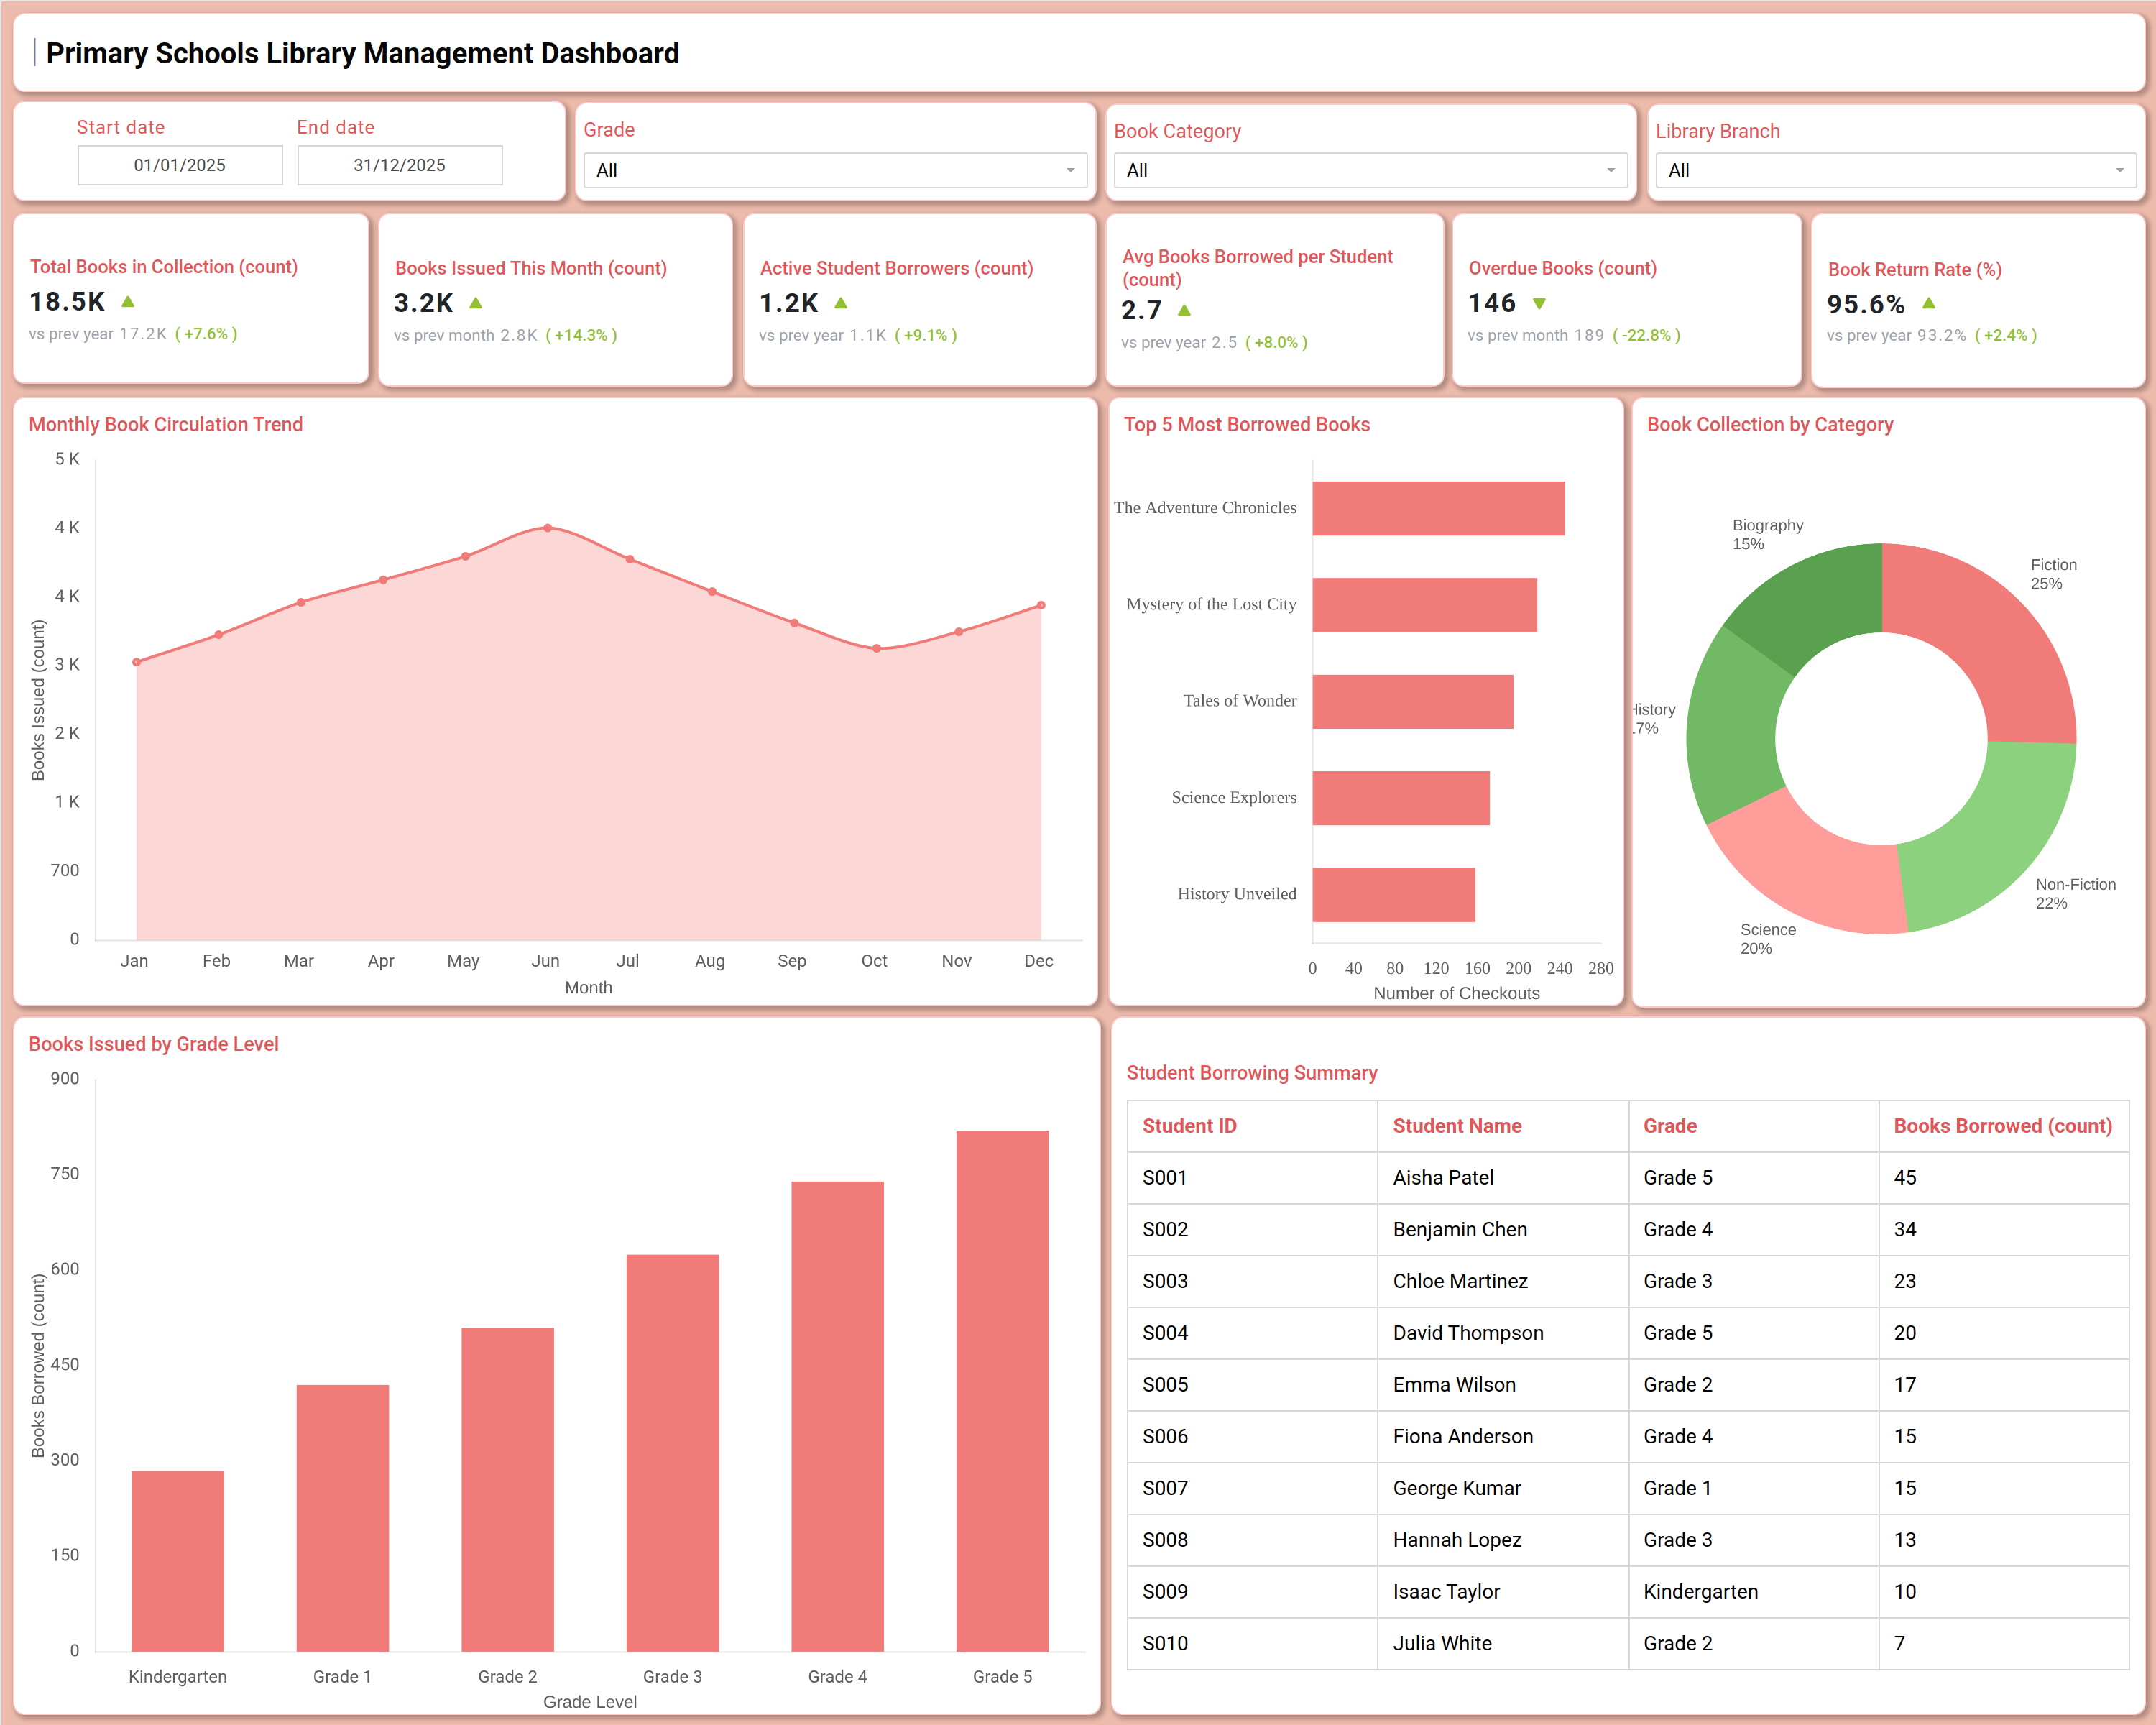
A primary school library management dashboard gives school librarians and administrators a single view of how the library collection is being used across grade levels, book categories, and library branches. This school library KPI dashboard template consolidates book circulation, borrower activity, and collection statistics that are otherwise scattered across manual registers and spreadsheets. Library staff can filter by start date, end date, grade, book category, and library branch to see how usage shifts across the school year without pulling data from multiple sources. Built for elementary and primary education settings, the dashboard connects reading habits, overdue tracking, and collection balance so that literacy programs can be planned with evidence instead of guesswork.
How to Create a Primary Schools Library Management Dashboard
You don't need to build your report from scratch; just start with a ready-to-use dashboard template from Mokkup. Add in your data and export it however you like. Here's how to do it:
1. Create or Log in to Your Mokkup Account
Start by signing up on Mokkup.ai using your email. If you already have an account, just log in, and you'll be good to go.
2. Choose and Customize Your Dashboard Template
Find the Primary Schools Library Management Dashboard template in the Templates section. Use the drag-and-drop editor to adjust KPIs, edit filters, or add elements based on your data.
3. Export to Your BI Tool
Once your dashboard wireframe is ready, use the BI Tool Export feature to send it directly to Power BI or Tableau for further analysis and enhancements. You can also download the dashboard as a PDF, PNG, or JPEG, embed it on a platform, or invite your team to collaborate.
Note: This is a Pro template. You'll need a Pro subscription on Mokkup to use and customize this dashboard wireframe. Upgrade anytime to unlock full access.
Primary Schools Library Management Dashboard Example
A school librarian typically opens this primary school library management dashboard at the start of each week to check whether reading engagement is holding steady or slipping across specific grades. Before adjusting reading programs or restocking plans, the librarian needs a clear picture of which categories, grades, and branches are driving activity, and which ones need attention. From the main screen, the librarian narrows the view using the Grade, Book Category, and Library Branch filters to isolate performance for a single class or genre.
They can identify whether circulation is rising or falling month over month, compare how different grades borrow books relative to one another, and see which titles are pulling the most checkouts. When the collection skews too heavily toward one genre, the category breakdown makes it easy to spot and correct that imbalance before it affects student choice. The result is a student book borrowing tracking dashboard that turns scattered circulation records into a single reference point for planning. Librarians can prioritize overdue book tracking for school library staff to reduce losses, teachers can target grades with lower engagement, and administrators can get a defensible view of collection health heading into budget and purchasing decisions.
How to Analyze Data in a Primary Schools Library Management Dashboard
Here is how you can analyze data from this dashboard:
- Use the Grade filter to isolate borrowing patterns for one class before comparing them against school-wide activity.
- Apply the Book Category filter to see how Fiction, Non-Fiction, Science, History, and Biography titles perform individually.
- Switch the Library Branch filter to compare circulation when the school operates more than one library location.
- Monitor the Monthly Book Circulation Trend, the core of this school library book circulation dashboard, to spot seasonal dips around holidays or exams.
- Review the Top 5 Most Borrowed Books chart to identify which titles drive the most checkouts and plan reorders accordingly.
- Check the Book Collection by Category donut chart, a book collection by category dashboard view, to confirm the collection stays balanced across genres.
- Use the Books Issued by Grade Level chart to see which grades borrow more and target reading support where it is needed.
- Scan the Student Borrowing Summary table, a student book borrowing tracking dashboard view, to flag students who need reading encouragement.
Benefits of a Primary Schools Library Management Dashboard
The following are the benefits of using this dashboard:
- Centralizes book circulation, borrower activity, and collection health in one school library book circulation dashboard template.
- Strengthens overdue books tracking school library staff rely on to reduce lost or unreturned titles.
- Highlights grade-level reading gaps so teachers can target specific classes for reading support.
- Surfaces top-performing titles to guide future purchasing and collection development decisions.
- Keeps the collection balanced across genres through a clear book collection by category dashboard view.
- Gives administrators one filterable view instead of separate spreadsheets per grade or branch.
- Turns manual reporting into a single school library KPI dashboard template that administrators can reuse every term.
KPIs to Track in a Primary Schools Library Management Dashboard
Key Performance Indicators (KPIs) are measurable values that indicate how effectively a library program is achieving its goals and form the core of any school library KPI dashboard template.
- Total Books in Collection (count) - Tracks the total size of the library's holdings and shows collection growth over time.
- Books Issued This Month (count) - Feeds this school library book circulation dashboard with current-month checkout volume to gauge short-term engagement.
- Active Student Borrowers (count) - Counts unique students who borrowed at least one book, reflecting participation across the school.
- Avg Books Borrowed per Student (count) - Shows average reading intensity per student and flags grades that need encouragement.
- Overdue Books (count) - Flags titles past their due date so staff can prioritize follow-up and reduce loss.
- Book Return Rate (%) - Measures how reliably borrowed books are returned, keeping every book collection by category dashboard view accurate.
Frequently Asked Questions
1. What industries benefit most from this Primary Schools Library Management Dashboard?
Primary and elementary schools benefit most, along with school librarians and district library administrators using a primary school library management dashboard to standardize reporting. Reading coordinators also use it to track engagement across grade levels.
2. Can this dashboard support overdue books tracking school library staff rely on across multiple branches?
Yes. The Library Branch filter combined with the Overdue Books KPI lets staff compare overdue counts branch by branch and follow up where losses are highest.
3. How does the Top 5 Most Borrowed Books chart work?
It ranks titles by number of checkouts within the selected date range, grade, and category filters. This helps librarians see which books are most in demand and plan reorders accordingly.