
What is a Secondary School Facility Management Dashboard?
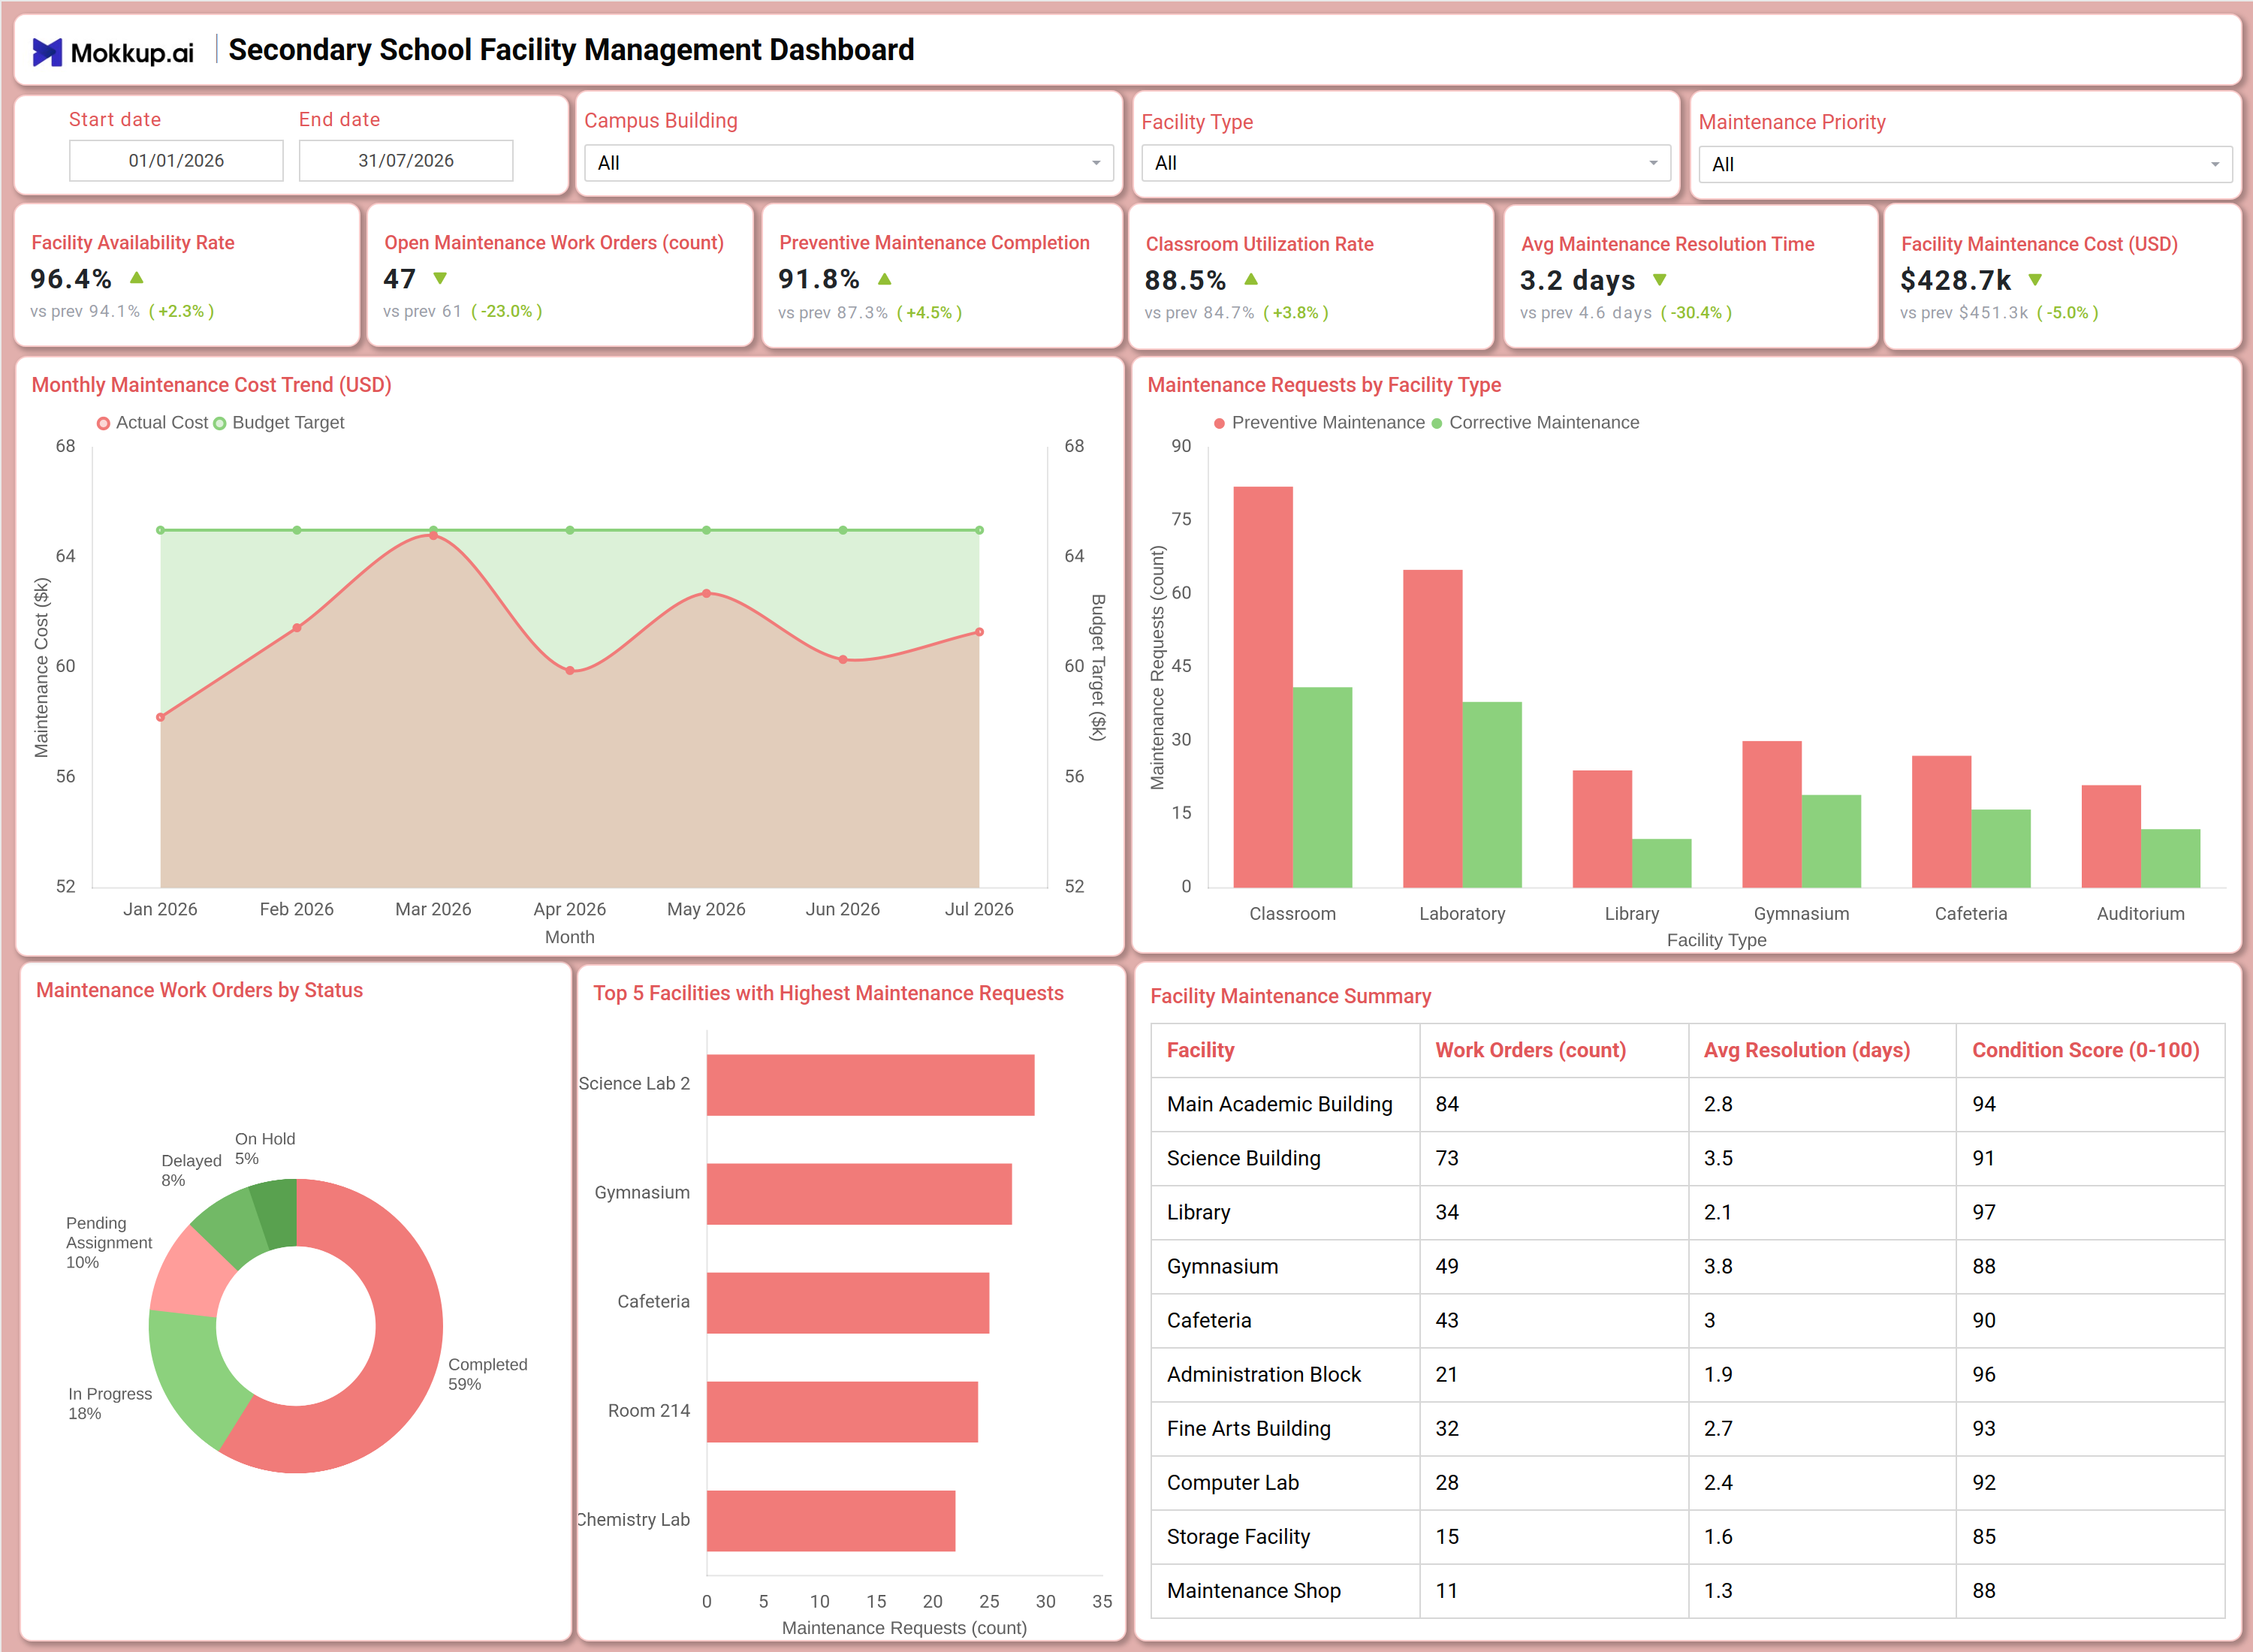
The Secondary School Facility Management Dashboard is a single-screen reporting template built for facilities directors, maintenance coordinators, and school administrators who need one consolidated view of building upkeep and maintenance operations. It brings together facility availability, preventive maintenance completion, and open work order counts so teams no longer have to piece together separate maintenance logs and spreadsheets. The template also works as a facility maintenance cost tracking dashboard, pairing budget targets against actual spend so leadership can see exactly where funds are being allocated across every campus building. By combining these views in one place, the Secondary School Facility Management Dashboard gives schools a structured way to monitor building health, maintenance backlog, and spending discipline without switching between tools.
How to Create a Secondary School Facility Management Dashboard
You don’t need to build your report from scratch; just start with a ready-to-use dashboard template from Mokkup. Add in your data and export it however you like. Here’s how to do it:
1. Create or Log in to Your Mokkup Account
Start by signing up on Mokkup.ai using your email. If you already have an account, just log in, and you'll be good to go.
2. Choose and Customize Your Dashboard Template
Find the Secondary School Facility Management Dashboard template in the Templates section. Use the drag-and-drop editor to adjust KPIs, edit filters, or add elements based on your data.
3. Export to Your BI Tool
Once your dashboard wireframe is ready, use the BI Tool Export feature to send it directly to Power BI or Tableau for further analysis and enhancements. You can also download the dashboard as a PDF, PNG, or JPEG, embed it on a platform, or invite your team to collaborate.
Note: This is a Pro template. You'll need a Pro subscription on Mokkup to use and customize this dashboard wireframe. Upgrade anytime to unlock full access.
Secondary School Facility Management Dashboard Example
A facilities director typically opens the Secondary School Facility Management Dashboard at the start of a budget cycle or maintenance review to understand how well campus buildings are being maintained and where resources are being spent. Filtering by campus building, facility type, or maintenance priority narrows the view down to a single wing, lab, or maintenance category before digging into performance trends. The question driving this session is usually straightforward: are maintenance requests being resolved fast enough, and is spending staying within budget?
Within this single screen, maintenance coordinators can compare actual maintenance spend against budget targets month over month to catch cost overruns early, rather than discovering them at year-end reconciliation. They can also assess how work orders are split between preventive and corrective maintenance across facility types, which supports preventive maintenance completion rate tracking so equipment issues get addressed before they turn into costly emergency repairs. Reviewing the breakdown of work orders by status lets a coordinator prioritize open tickets, flag anything stuck on hold or delayed, and reassign resources before backlog grows. Looking at the ranked list of facilities with the highest maintenance requests, along with the facility-level summary table, helps leadership decide which buildings need deeper investment, added staffing, or a full condition assessment.
The overall outcome is that facilities teams move from reactive firefighting to planned upkeep. Instead of waiting for a broken system or an overdue work order to force a decision, the Secondary School Facility Management Dashboard lets administrators anticipate maintenance needs, manage budgets proactively, and keep every campus building operating at a standard that supports classroom learning.
How to Analyze Data in a Secondary School Facility Management Dashboard
Here is how you can analyze data from this dashboard:
- Use the Campus Building filter to isolate maintenance performance for a specific school building.
- Filter by Facility Type to compare preventive and corrective maintenance requests across classrooms, labs, and shared spaces.
- Apply the Maintenance Priority filter to focus on the most urgent work orders first.
- Monitor the Monthly Maintenance Cost Trend chart to catch actual spend drifting away from the budget target.
- Review the Maintenance Requests by Facility Type chart to see which facility types generate the most preventive versus corrective work.
- Track the Maintenance Work Orders by Status donut for maintenance work order status tracking so delayed or on-hold tickets get reassigned quickly.
- Use the Top 5 Facilities with Highest Maintenance Requests chart to identify buildings that need deeper investigation.
- Reference the Facility Maintenance Summary table for classroom utilization rate monitoring alongside work order counts and condition scores by facility.
Benefits of a Secondary School Facility Management Dashboard
The following are the benefits of using this dashboard:
- Centralizes facility availability, work orders, and maintenance spend in one structured template.
- Reduces manual reconciliation between budget spreadsheets and maintenance logs with a single cost trend view.
- Supports maintenance work order status tracking so coordinators catch delayed or on-hold tickets before they escalate.
- Enables facility-type-level comparison of preventive versus corrective maintenance to guide staffing and budget decisions.
- Surfaces the Facility Maintenance Summary table so administrators review work orders, resolution time, and condition score by building in one place.
- Helps school leadership justify capital requests using documented facility maintenance cost tracking dashboard trends against budget targets.
- Gives facilities directors and maintenance coordinators a shared view of building performance across every campus building.
KPIs to Track in a Secondary School Facility Management Dashboard
The following key KPIs can be tracked by using this dashboard:
- Facility Availability Rate (%): Measures the percentage of time buildings and rooms are open and usable for instruction, a foundational metric for a secondary school facility management dashboard.
- Open Maintenance Work Orders (count): Tracks the number of outstanding requests awaiting action, signaling whether maintenance backlog is growing or shrinking.
- Preventive Maintenance Completion (%): Quantifies how much scheduled maintenance was finished on time, supporting preventive maintenance completion rate tracking that helps prevent equipment failure.
- Classroom Utilization Rate (%): Measures how effectively classroom space is being used, key to classroom utilization rate monitoring and space planning decisions.
- Avg Maintenance Resolution Time (days): Evaluates how quickly logged maintenance requests are closed once submitted.
- Facility Maintenance Cost (USD): Tracks actual maintenance spend against budget target, the core metric behind this facility maintenance cost tracking dashboard.
- Facility Condition Score (0-100): Found in the Facility Maintenance Summary table, this score benchmarks each building's condition and anchors this school facility condition score dashboard for investment planning.
Frequently Asked Questions
1. What industries benefit most from the Secondary School Facility Management Dashboard?
Secondary schools, school districts, and campus facilities teams use this template to track maintenance costs, work order backlog, and classroom utilization rate monitoring across multiple buildings. Facilities directors, maintenance coordinators, and school administrators are the primary audience.
2. Can this dashboard track maintenance costs against budget?
Yes. The Monthly Maintenance Cost Trend chart compares actual maintenance cost against the budget target month by month, making this a practical facility maintenance cost tracking dashboard for spotting overruns early.
3. How does the Facility Maintenance Summary table support facility planning?
The table lists work orders, average resolution time, and condition score for each building, functioning as a school facility condition score dashboard view that helps leadership prioritize which facilities need attention first.