
What is a Recycling & Reuse Water Quality Compliance Dashboard?
A Recycling & Reuse Water Quality Compliance Dashboard is a centralized analytical tool that gives water utilities, environmental agencies, and municipal treatment operators a single view of compliance health across the full recycled water lifecycle. It consolidates data from laboratory testing, regulatory audits, treatment processes, and regional monitoring programs into a structured, filterable interface built to function as a treatment plant compliance monitoring tool. At its core, the dashboard supports recycled water quality compliance tracking by surfacing key performance indicators alongside period-over-period comparisons, so compliance managers can spot deteriorating trends before they escalate into violations. Users can slice the data by region, treatment plant, and reuse category to narrow their focus without switching between disconnected systems.
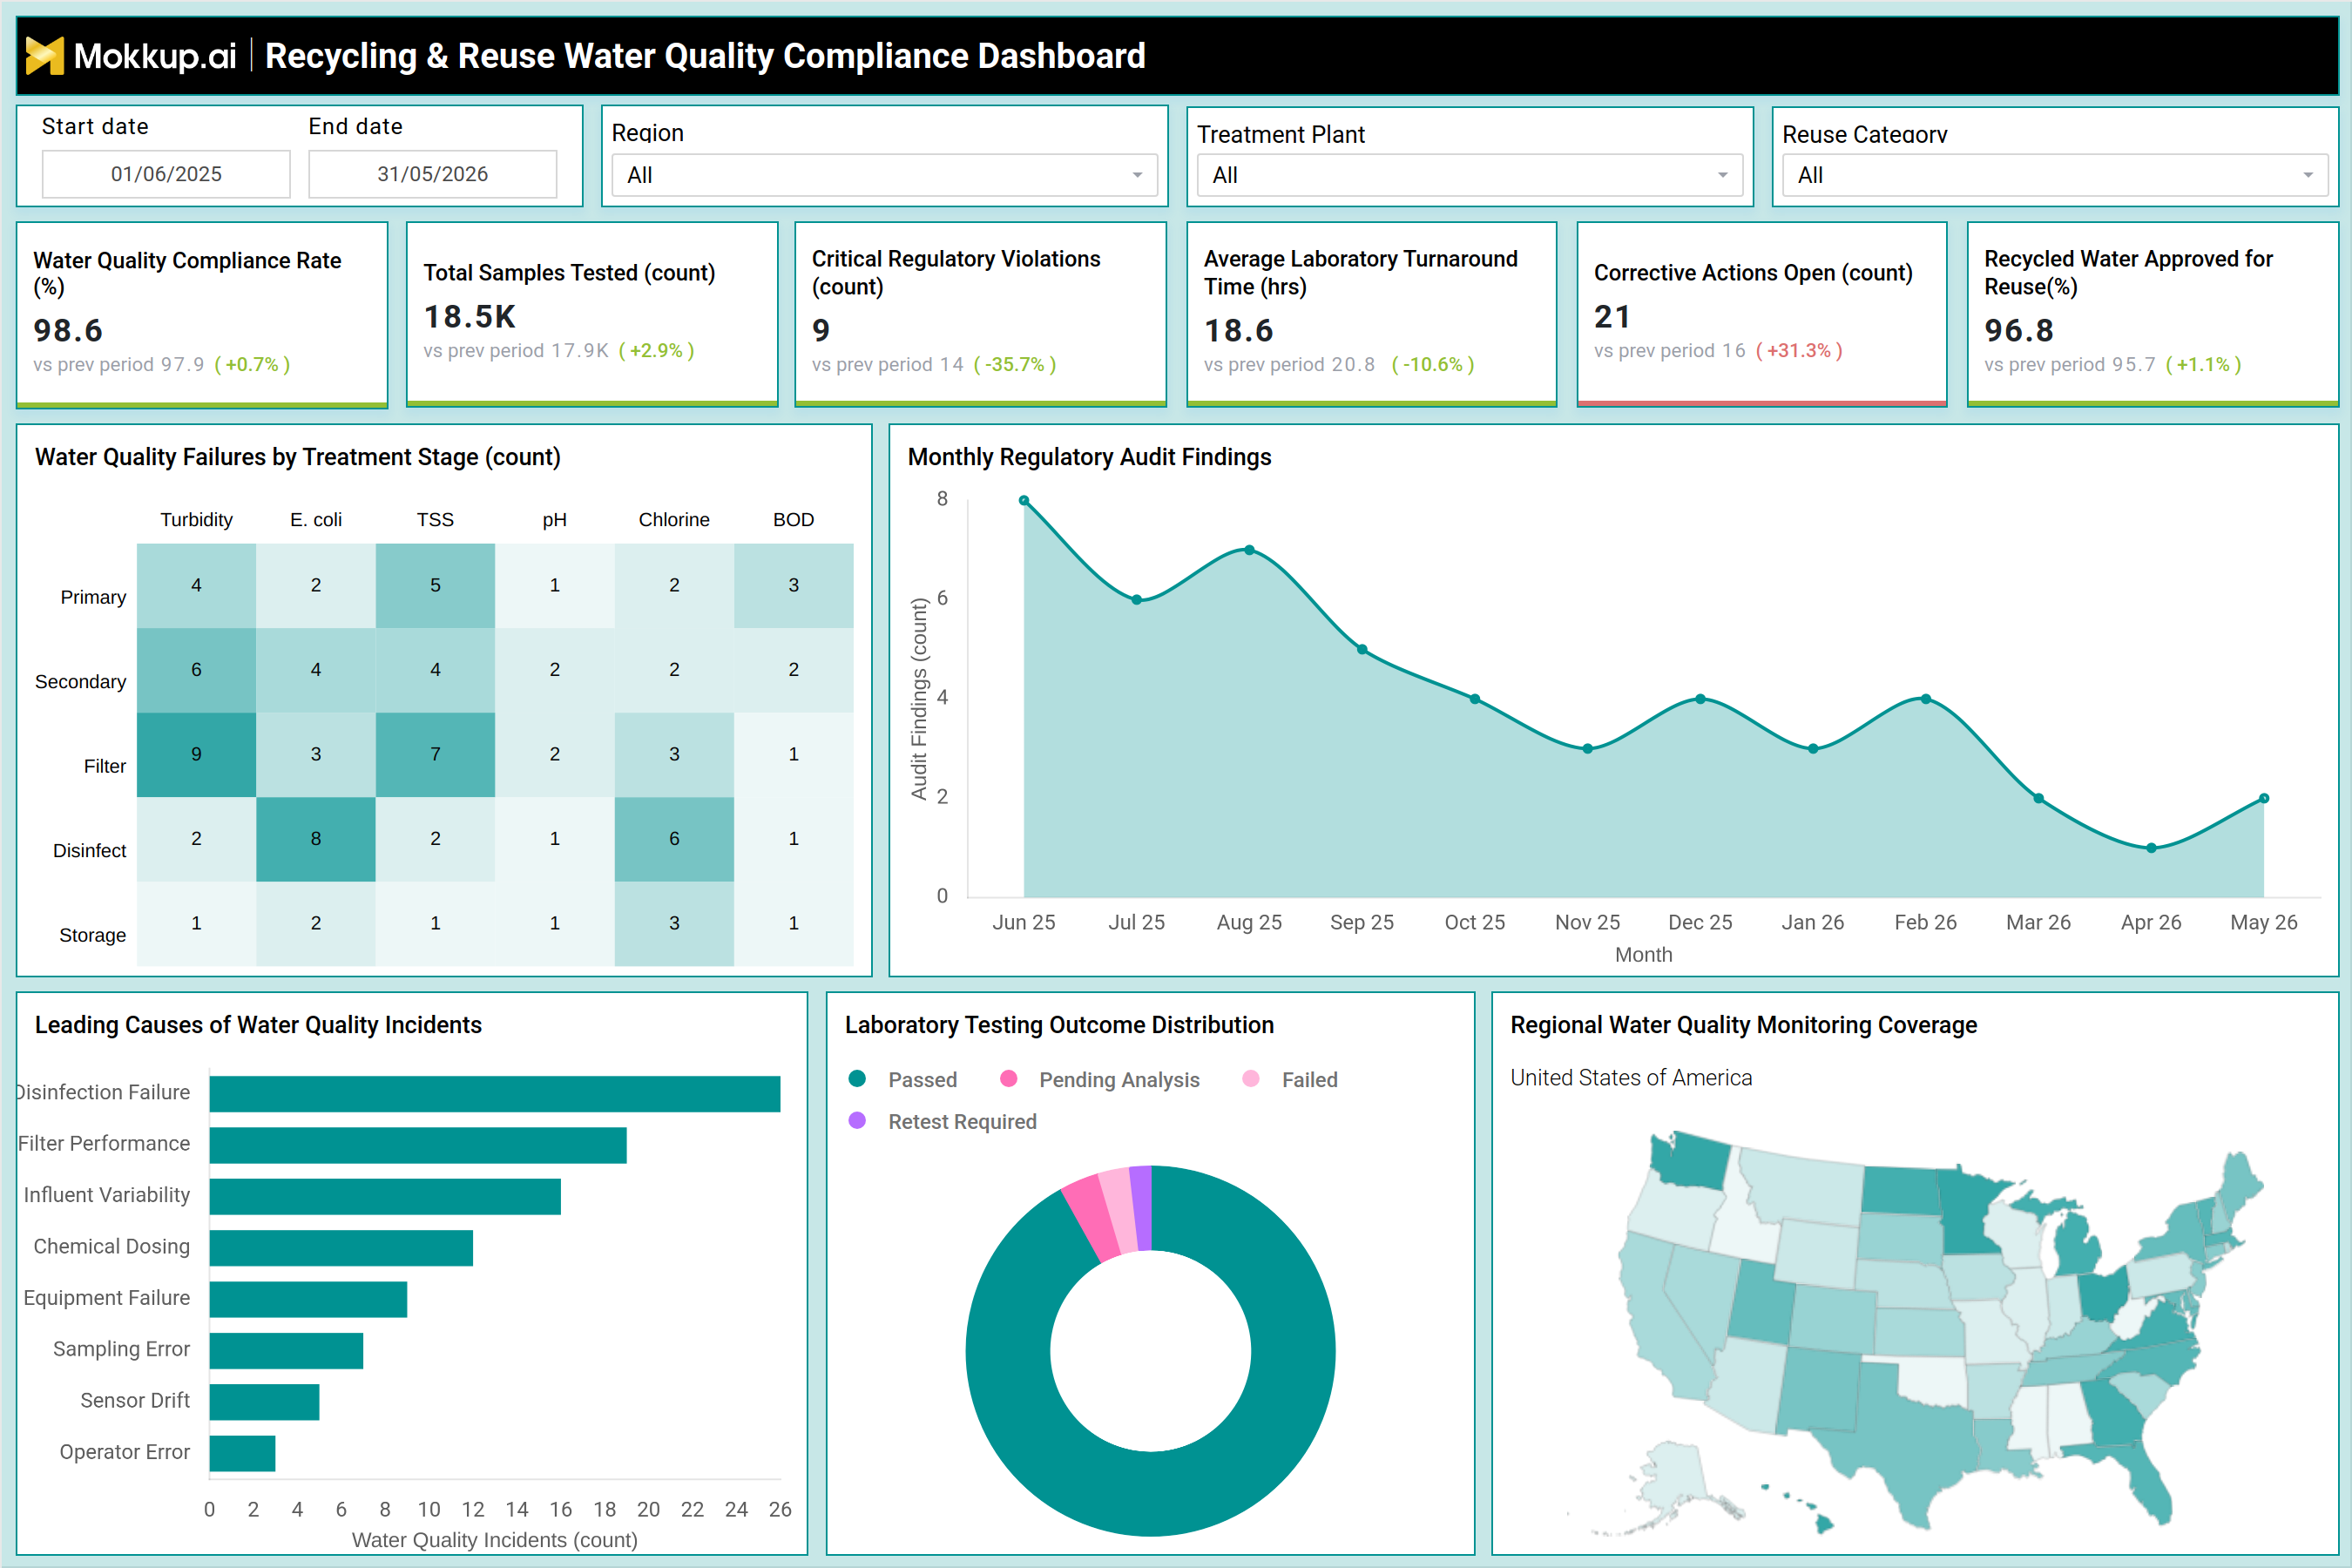
Beyond KPI tiles, the dashboard incorporates visual layers, a treatment-stage failure heatmap, a monthly audit findings trend line, a laboratory testing outcome distribution water quality chart, and a regional coverage map that together give teams a multi-dimensional picture of where recycled water approval rate monitoring stands at any given time. For organizations under regulatory scrutiny, this level of integrated visibility is essential for staying ahead of inspection cycles and maintaining public trust in recycled water programs.
How to Create a Recycling & Reuse Water Quality Compliance Dashboard
You don't need to build your report from scratch; just start with a ready-to-use dashboard template from Mokkup. Add in your data and export it however you like. Here's how to do it:
1. Create or Log in to Your Mokkup Account
Start by signing up on Mokkup.ai using your email. If you already have an account, just log in, and you'll be good to go.
2. Choose and Customize Your Dashboard Template
Find the Recycling & Reuse Water Quality Compliance Dashboard template in the Templates section. Use the drag-and-drop editor to adjust KPIs, edit filters, or add elements based on your data.
3. Export to Your BI Tool
Once your dashboard wireframe is ready, use the BI Tool Export feature to send it directly to Power BI or Tableau for further analysis and enhancements. You can also download the dashboard as a PDF, PNG, or JPEG, embed it on a platform, or invite your team to collaborate.
Note: This is a Pro template. You'll need a Pro subscription on Mokkup to use and customize this dashboard wireframe. Upgrade anytime to unlock full access.
Recycling & Reuse Water Quality Compliance Dashboard Example
Consider a regional water authority managing multiple treatment plants that supply recycled water for agricultural and industrial reuse. Compliance officers open the dashboard each morning and apply the Treatment Plant and Reuse Category filters to isolate the facilities under their direct oversight. Within seconds, the KPI tiles tell them whether the water quality compliance rate has improved or declined against the previous period and whether Corrective Actions Open has grown, a signal that unresolved issues are accumulating faster than teams are closing them. This kind of recycled water quality compliance tracking replaces hours of manual report pulling with immediate situational awareness. When the team notices an uptick in critical regulatory violations, they navigate to the Water Quality Failures by Treatment Stage heatmap.
The matrix lets them compare failure counts across Turbidity, E. coli, TSS, pH, Chlorine, and BOD parameters at each stage- Primary, Secondary, Filter, Disinfect, and Storage- so they can prioritize the stage and parameter combination driving the most incidents. Cross-referencing this with the Leading Causes of Water Quality Incidents bar chart, they identify whether disinfection failure or filter performance is the dominant driver, then assign corrective work orders accordingly. This workflow is central to any effective water quality violation management software approach and is precisely why the water reuse regulatory audit dashboard format has become standard practice in utility compliance programs. The Monthly Regulatory Audit Findings line chart helps compliance teams track whether their corrective measures are producing results over time. By observing the trajectory across twelve months, managers can distinguish between isolated spikes and persistent trends, then schedule internal audits in advance of regulatory inspections.
The water reuse regulatory audit dashboard view surfaces which months consistently show elevated findings, giving planning teams the evidence they need to request additional staffing or capital investment during peak risk periods. For utilities that rely on this as their primary treatment plant compliance monitoring tool, the audit trend line alone can justify the investment in structured dashboard infrastructure. Laboratory staff use the laboratory testing outcome distribution water quality donut chart to monitor the proportion of samples that pass, fail, require a retest, or are still pending analysis. A growing Pending Analysis segment may indicate a bottleneck in turnaround capacity; cross-referencing this with the Average Laboratory Turnaround Time KPI tile helps management decide whether to prioritize laboratory staffing changes.
The Regional Water Quality Monitoring Coverage map rounds out the picture by showing which states or districts have dense monitoring activity and which may need additional sampling stations. Teams using water quality violation management software workflows find the geographic layer essential for ensuring no region is systematically underrepresented, and the combined view keeps recycled water approval rate monitoring consistent and auditable across the full program.
How to Analyze Data in a Recycling & Reuse Water Quality Compliance Dashboard
Here is how you can analyze data from this dashboard:
- Apply Region, Treatment Plant, and Reuse Category filters to scope the data to your area of responsibility before drawing any conclusions.
- Compare Water Quality Compliance Rate and Recycled Water Approved for Reuse against their previous-period deltas to determine whether performance is trending up or down.
- Use the Water Quality Failures by Treatment Stage heatmap to identify which treatment stage and parameter combination produces the highest failure counts.
- Scan the Leading Causes of Water Quality Incidents bar chart to rank incident drivers and direct corrective resources to the most impactful categories.
- Review the Monthly Regulatory Audit Findings line chart to distinguish isolated spikes from sustained deterioration across the audit cycle.
- Cross-reference the laboratory testing outcome distribution water quality view with Average Laboratory Turnaround Time to assess whether testing capacity constraints affect compliance outcomes.
- Use the Regional Water Quality Monitoring Coverage map to identify geographic gaps in sampling and prioritize monitoring expansion — a key function of any treatment plant compliance monitoring tool.
- Track Corrective Actions Open over consecutive periods to confirm that remediation work is closing faster than new issues are opening.
Benefits of a Recycling & Reuse Water Quality Compliance Dashboard
The following are the benefits of using this dashboard:
- Provides a single source of truth for recycled water quality compliance tracking across all treatment plants and reuse categories.
- Accelerates root-cause identification by combining a treatment-stage failure heatmap with an incident-cause bar chart in one view.
- Supports water reuse regulatory audit dashboard preparation by tracking audit findings trends month over month.
- Reduces manual reporting effort by consolidating KPI tiles, charts, and geographic data into one filterable interface.
- Improves laboratory resource planning through the laboratory testing outcome distribution, water quality view, and turnaround time KPI.
- Helps compliance teams prioritize corrective actions by surfacing open counts and period-over-period changes, consistent with best practices for water quality violation management software.
- Enables geographic equity in monitoring by visualizing regional coverage gaps on a national map.
- Strengthens stakeholder communication with clear visual evidence of progress in monitoring the recycled water approval rate.
KPIs to Track in a Recycling & Reuse Water Quality Compliance Dashboard
The following key KPIs can be tracked by using this dashboard:
- KPIs (Key Performance Indicators) are quantifiable measures used to evaluate how effectively an organization is achieving its compliance and operational objectives. In recycled water management, KPIs translate complex treatment and testing data into actionable signals that guide decisions.
- Water Quality Compliance Rate (%): measures the share of tested samples or assessed parameters that meet regulatory standards within the selected period — the headline metric for recycled water quality compliance tracking programs.
- Total Samples Tested Yearly (count): tracks the volume of laboratory samples processed annually, indicating the breadth of testing coverage across the monitoring program.
- Critical Regulatory Violations (count): records the number of violations classified as critical by regulatory bodies, a direct indicator of legal and operational risk within any water quality violation management software workflow.
- Average Laboratory Turnaround Time (hrs): captures the mean time from sample collection to result reporting, relevant to the laboratory testing outcome distribution water quality analysis that depends on timely data.
- Corrective Actions Open (count): quantifies the number of unresolved corrective action items, revealing whether remediation is keeping pace with identified issues — a core metric for any treatment plant compliance monitoring tool.
- Recycled Water Approved for Reuse (%): measures the proportion of recycled water volumes cleared for agricultural, industrial, or municipal reuse, central to recycled water approval rate monitoring and reuse program accountability.
Frequently Asked Questions
1. Who typically uses a Recycling & Reuse Water Quality Compliance Dashboard?
Water utility compliance officers, environmental regulators, and treatment plant operations managers are the primary users. They rely on it to monitor laboratory results, track regulatory audit outcomes, and manage corrective actions across multiple sites.
2. How does this dashboard support treatment plant compliance monitoring across multiple facilities?
The Region and Treatment Plant filters allow users to isolate data for individual facilities or compare performance across a portfolio. This makes it straightforward to identify which plants require the most urgent attention without manually compiling separate reports.
3. Can the dashboard help prepare for regulatory inspections?
Yes. The Monthly Regulatory Audit Findings trend and Critical Regulatory Violations KPI give compliance teams an advance view of where deficiencies are concentrated. Teams can use this data to schedule internal audits and close corrective actions before an external inspection occurs.