
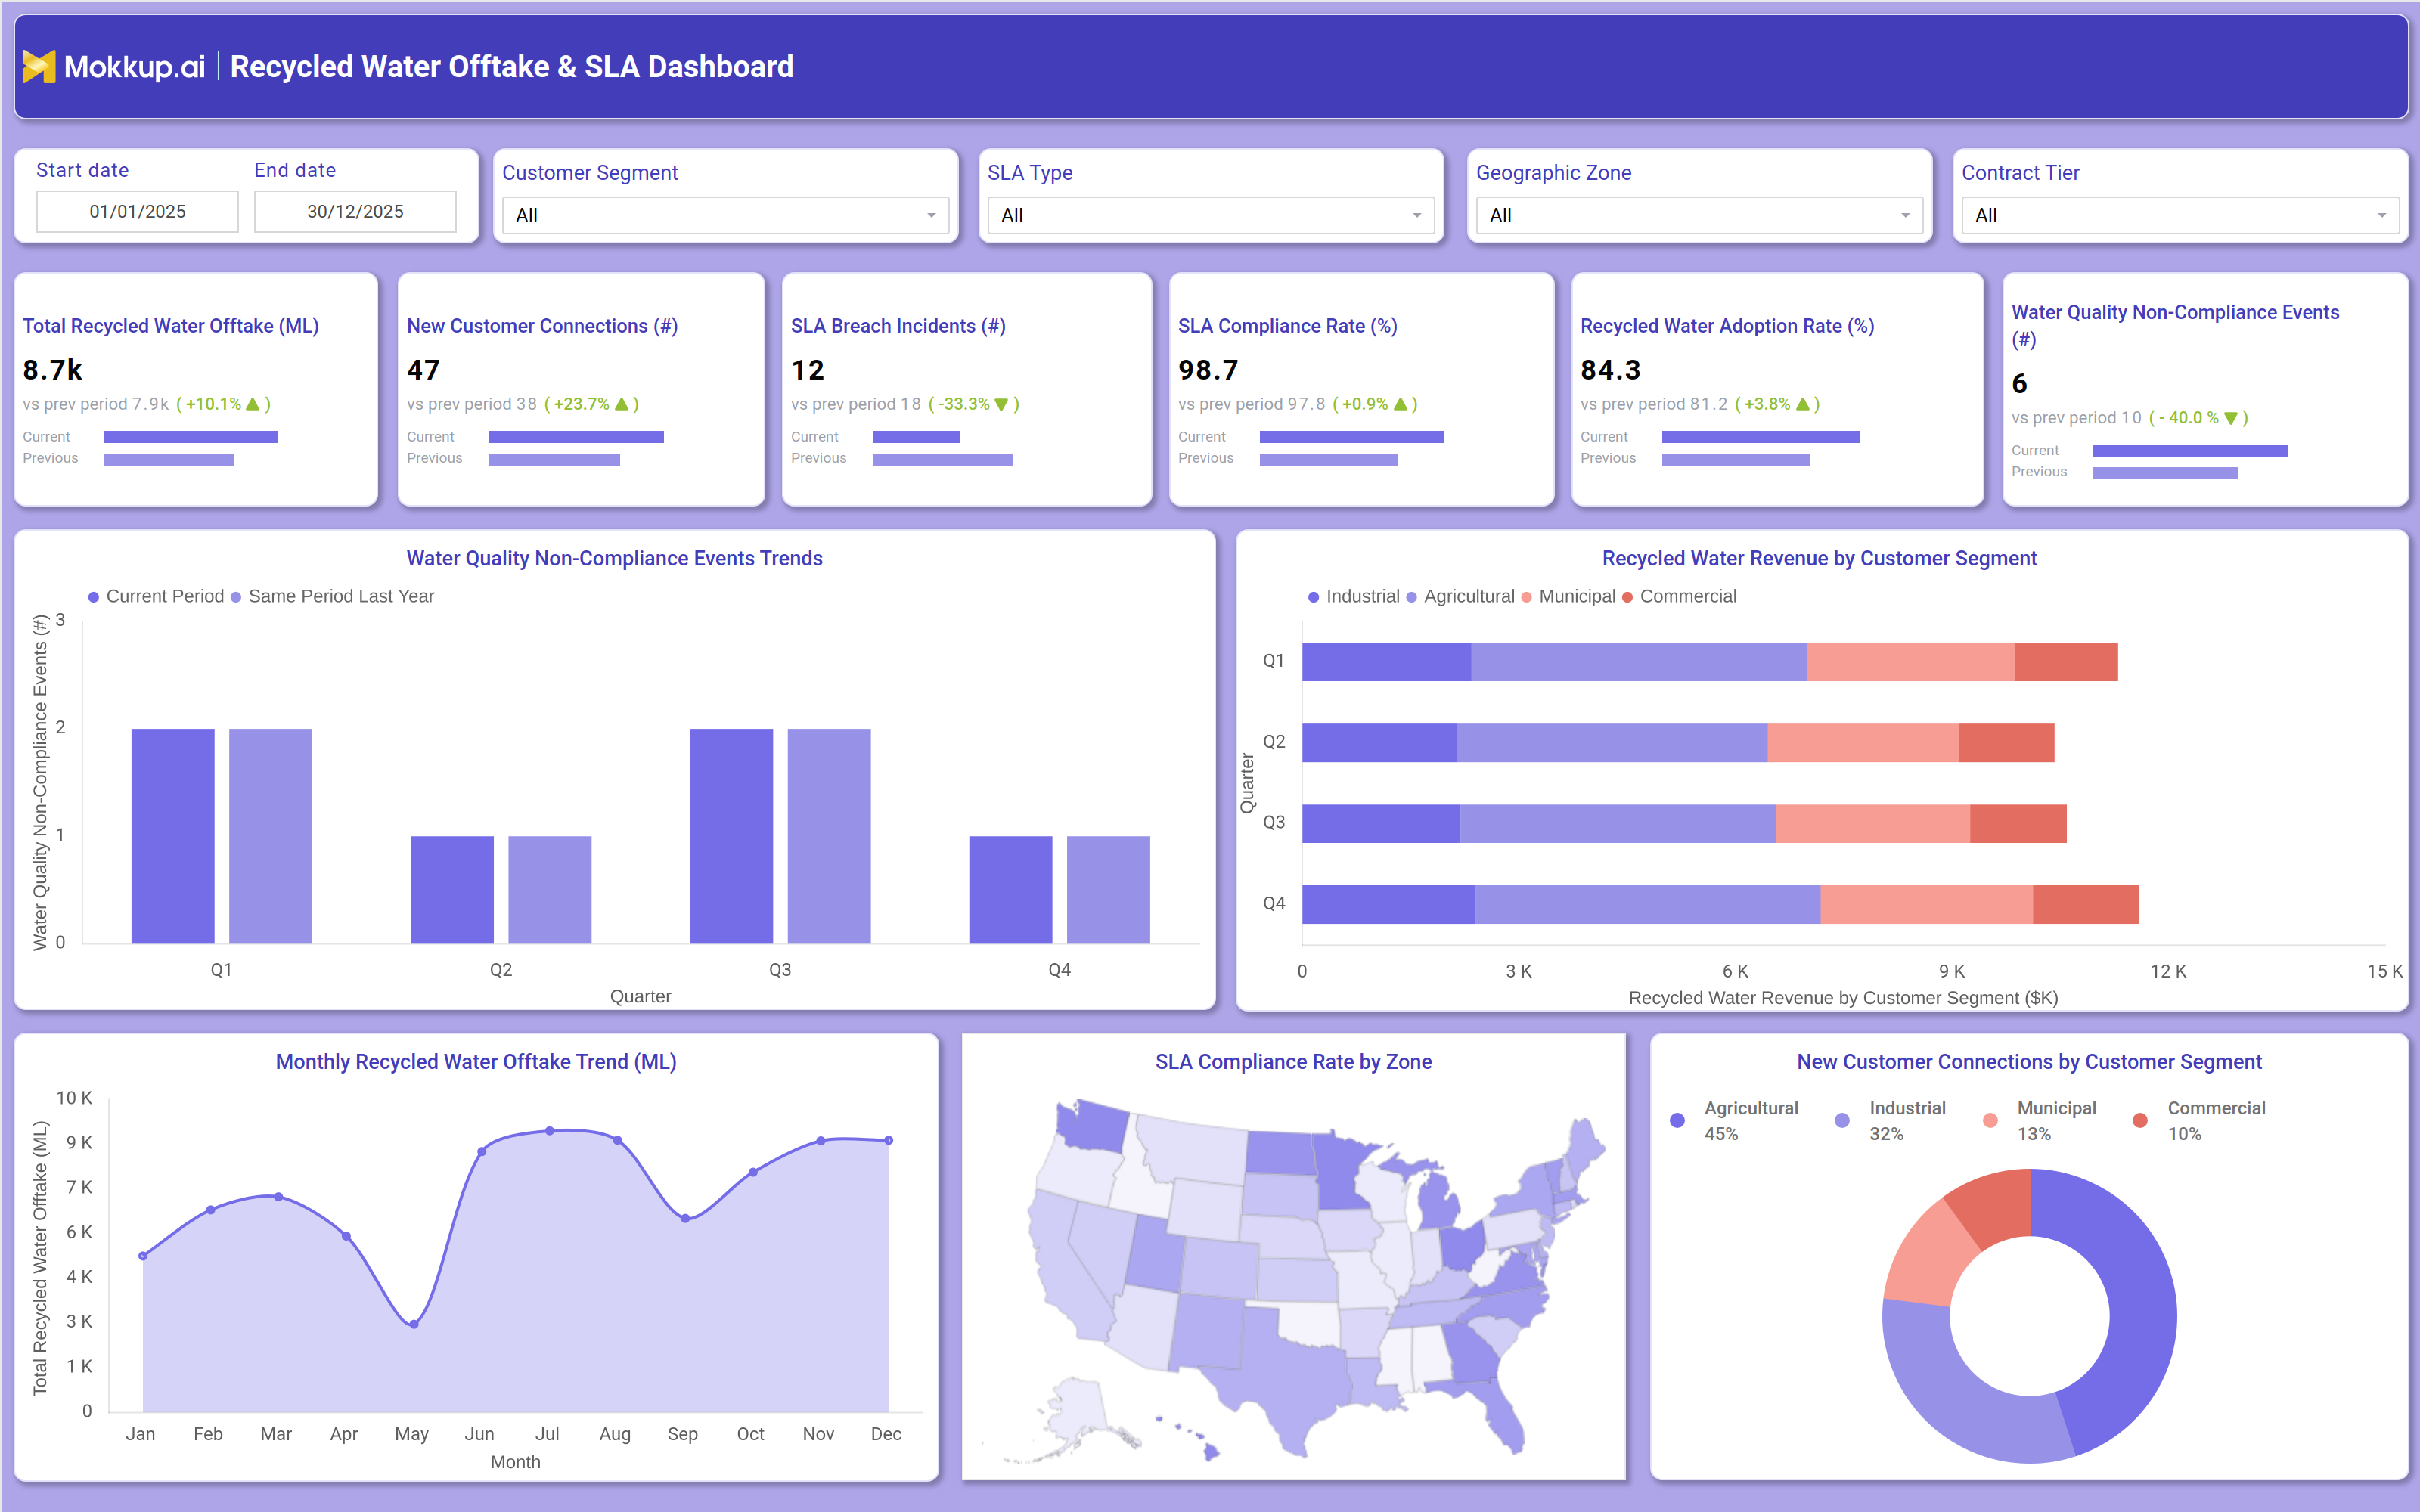
What is a Recycled Water Offtake & SLA Dashboard?
The Recycled Water Offtake & SLA Dashboard is a single-screen analytics template built for water utility teams managing recycled water distribution and service-level commitments. It consolidates offtake volumes, customer connections, and SLA performance into one view, giving utility managers a recycled water offtake dashboard that tracks how much recycled water customers are drawing against contracted terms. The dashboard pairs volume metrics with compliance tracking, so SLA compliance rate monitoring sits alongside adoption and quality indicators instead of being managed in a separate report. Built with filters for customer segment, SLA type, geographic zone, and contract tier, it lets teams narrow the view to the specific accounts or regions that matter for a given review cycle.
How to Create a Recycled Water Offtake & SLA Dashboard
You don’t need to build your report from scratch; just start with a ready-to-use Recycled Water Offtake & SLA Performance dashboard template from Mokkup. Add in your data and export it however you like. Here’s how to do it:
1. Create or Log in to Your Mokkup Account
Start by signing up on Mokkup.ai using your email. If you already have an account, just log in, and you'll be good to go.
2. Choose and Customize Your Dashboard Template
Find the Recycled Water Offtake & SLA Dashboard template in the Templates section. Use the drag-and-drop editor to adjust KPIs, edit filters, or add elements based on your data.
3. Export to Your BI Tool
Once your dashboard wireframe is ready, use the BI Tool Export feature to send it directly to Power BI or Tableau for further analysis and enhancements. You can also download the dashboard as a PDF, PNG, or JPEG, embed it on a platform, or invite your team to collaborate.
Note: This is a Pro template. You'll need a Pro subscription on Mokkup to use and customize this dashboard wireframe. Upgrade anytime to unlock full access.
Recycled Water Offtake & SLA Dashboard Example
A utility operations manager typically opens this dashboard at the start of a review cycle to check whether recycled water offtake is tracking against expectations and whether service commitments to customers are being met. Rather than pulling data from separate billing, compliance, and customer systems, they land on one screen that ties offtake volume, new connections, and SLA performance together for the period selected, using the recycled water offtake dashboard as the single source instead of stitching reports from multiple tools. From there, the manager can filter by customer segment or geographic zone to see where offtake is growing fastest and where new connections are concentrated, supporting a water reuse customer segment analysis that informs where to prioritize outreach or capacity planning.
Reviewing the monthly offtake trend alongside the compliance map, they can spot months where volume dipped and cross-check whether that coincided with any zone falling behind on service commitments, helping them decide whether the issue is seasonal or tied to a specific region's infrastructure. When breach counts or quality events trend upward in a particular quarter, the manager can drill into the revenue-by-segment view to assess which customer segment is most exposed and prioritize corrective action before it affects contract renewals. Used this way, the dashboard keeps offtake volume, service quality, and customer growth aligned in one place, so the recycled water program is managed proactively instead of reactively across scattered spreadsheets.
How to Analyze Data in a Recycled Water Offtake & SLA Dashboard
Here is how you can analyze data from this dashboard:
- Use the Start date and End date filters to isolate a specific reporting period before comparing offtake against prior periods.
- Filter by Customer Segment to run a water reuse customer segment analysis and identify which segment drives the most volume and revenue.
- Apply the SLA Type filter to isolate specific service commitments when reviewing SLA breach incident tracking trends.
- Switch the Geographic Zone filter to compare compliance performance across regions on the map view.
- Use the Contract Tier filter to separate high-value accounts from standard accounts when reviewing adoption trends.
- Cross-reference the monthly offtake trend with the quality events trend to spot correlated dips.
- Review the donut chart alongside the revenue bar chart to connect growth with revenue contribution by segment.
Benefits of a Recycled Water Offtake & SLA Dashboard
The following are the benefits of using this dashboard:
- Centralizes offtake, SLA, and customer data so utility teams stop switching between billing and compliance systems.
- Supports faster SLA breach incident tracking by surfacing breach counts next to compliance rate trends.
- Helps utility teams monitor recycled water adoption rate tracking across customer segments in one view.
- Improves accountability by showing compliance rate performance by zone instead of a single blended number.
- Speeds up quarterly reviews with pre-built filters instead of manual data pulls.
- Gives customer success and operations teams a shared view of growth and service quality.
KPIs to Track in a Recycled Water Offtake & SLA Dashboard
The following key KPIs can be tracked by using this dashboard:
- Total Recycled Water Offtake (ML): measures the total volume of recycled water delivered to customers over the selected period.
- New Customer Connections (#): tracks how many new accounts have started drawing recycled water, indicating program growth.
- SLA Breach Incidents (#): counts the number of times service commitments were not met, a direct input for SLA breach incident tracking.
- SLA Compliance Rate (%): shows the percentage of service commitments met, the core metric for SLA compliance rate monitoring across the utility.
- Recycled Water Adoption Rate (%): reflects the share of eligible customers actively using recycled water, supporting recycled water adoption rate tracking over time.
- Water Quality Non-Compliance Events (#): counts instances where recycled water quality fell outside standards, feeding into water quality non-compliance monitoring efforts.
Frequently Asked Questions
1. What does this dashboard track for water utilities?
It tracks recycled water offtake volume, SLA compliance rate monitoring, customer connections, and quality events in one screen. Utility teams use it to review performance without pulling reports from separate systems.
2. Can I customize this dashboard for my utility's SLA structure?
Yes, the template can be edited in Mokkup's drag-and-drop editor to match your SLA types, contract tiers, and geographic zones. You can adjust KPIs, filters, and chart labels before exporting to your BI tool.
3. How does this dashboard support water quality non-compliance monitoring?
It surfaces water quality non-compliance monitoring data next to SLA and offtake metrics, so teams can see whether quality issues coincide with breach incidents or specific zones. This helps prioritize corrective action for the segments most at risk.