
What is a wastewater treatment effluent compliance dashboard?
The Wastewater Treatment Effluent Compliance Dashboard is a structured analytics template designed for wastewater plant managers, environmental compliance engineers, and regulatory affairs teams who need to monitor discharge quality across multiple treatment facilities. This wastewater treatment effluent compliance dashboard consolidates six core performance indicators, including BOD removal efficiency, TSS compliance rate, nutrient compliance rate, pH compliance, laboratory QA pass rate, and exceedance incident count, into a single, unified view. It tracks effluent quality across conventional, advanced nutrient removal, and membrane bioreactor plant types, giving teams visibility into how each technology type performs against discharge permit thresholds. By supporting wastewater exceedance incidents tracking alongside monthly compliance trends and regional plant comparisons, this template helps compliance officers detect permit violations early and align operational response with regulatory requirements.
How to Create a Wastewater Treatment Effluent Compliance Dashboard
You don't need to build your report from scratch; just start with a ready-to-use dashboard template from Mokkup. Add in your data and export it however you like. Here's how to do it:
1. Create or Log in to Your Mokkup Account
Start by signing up on Mokkup.ai using your email. If you already have an account, just log in, and you'll be good to go.
2. Choose and Customize Your Dashboard Template
Find the Wastewater Treatment Effluent Compliance Dashboard template in the Templates section. Use the drag-and-drop editor to adjust KPIs, edit filters, or add elements based on your data.
3. Export to Your BI Tool
Once your dashboard wireframe is ready, use the BI Tool Export feature to send it directly to Power BI or Tableau for further analysis and enhancements. You can also download the dashboard as a PDF, PNG, or JPEG, embed it on a platform, or invite your team to collaborate.
Note: This is a Pro template. You'll need a Pro subscription on Mokkup to use and customize this dashboard wireframe. Upgrade anytime to unlock full access.
Wastewater Treatment Effluent Compliance Dashboard Example
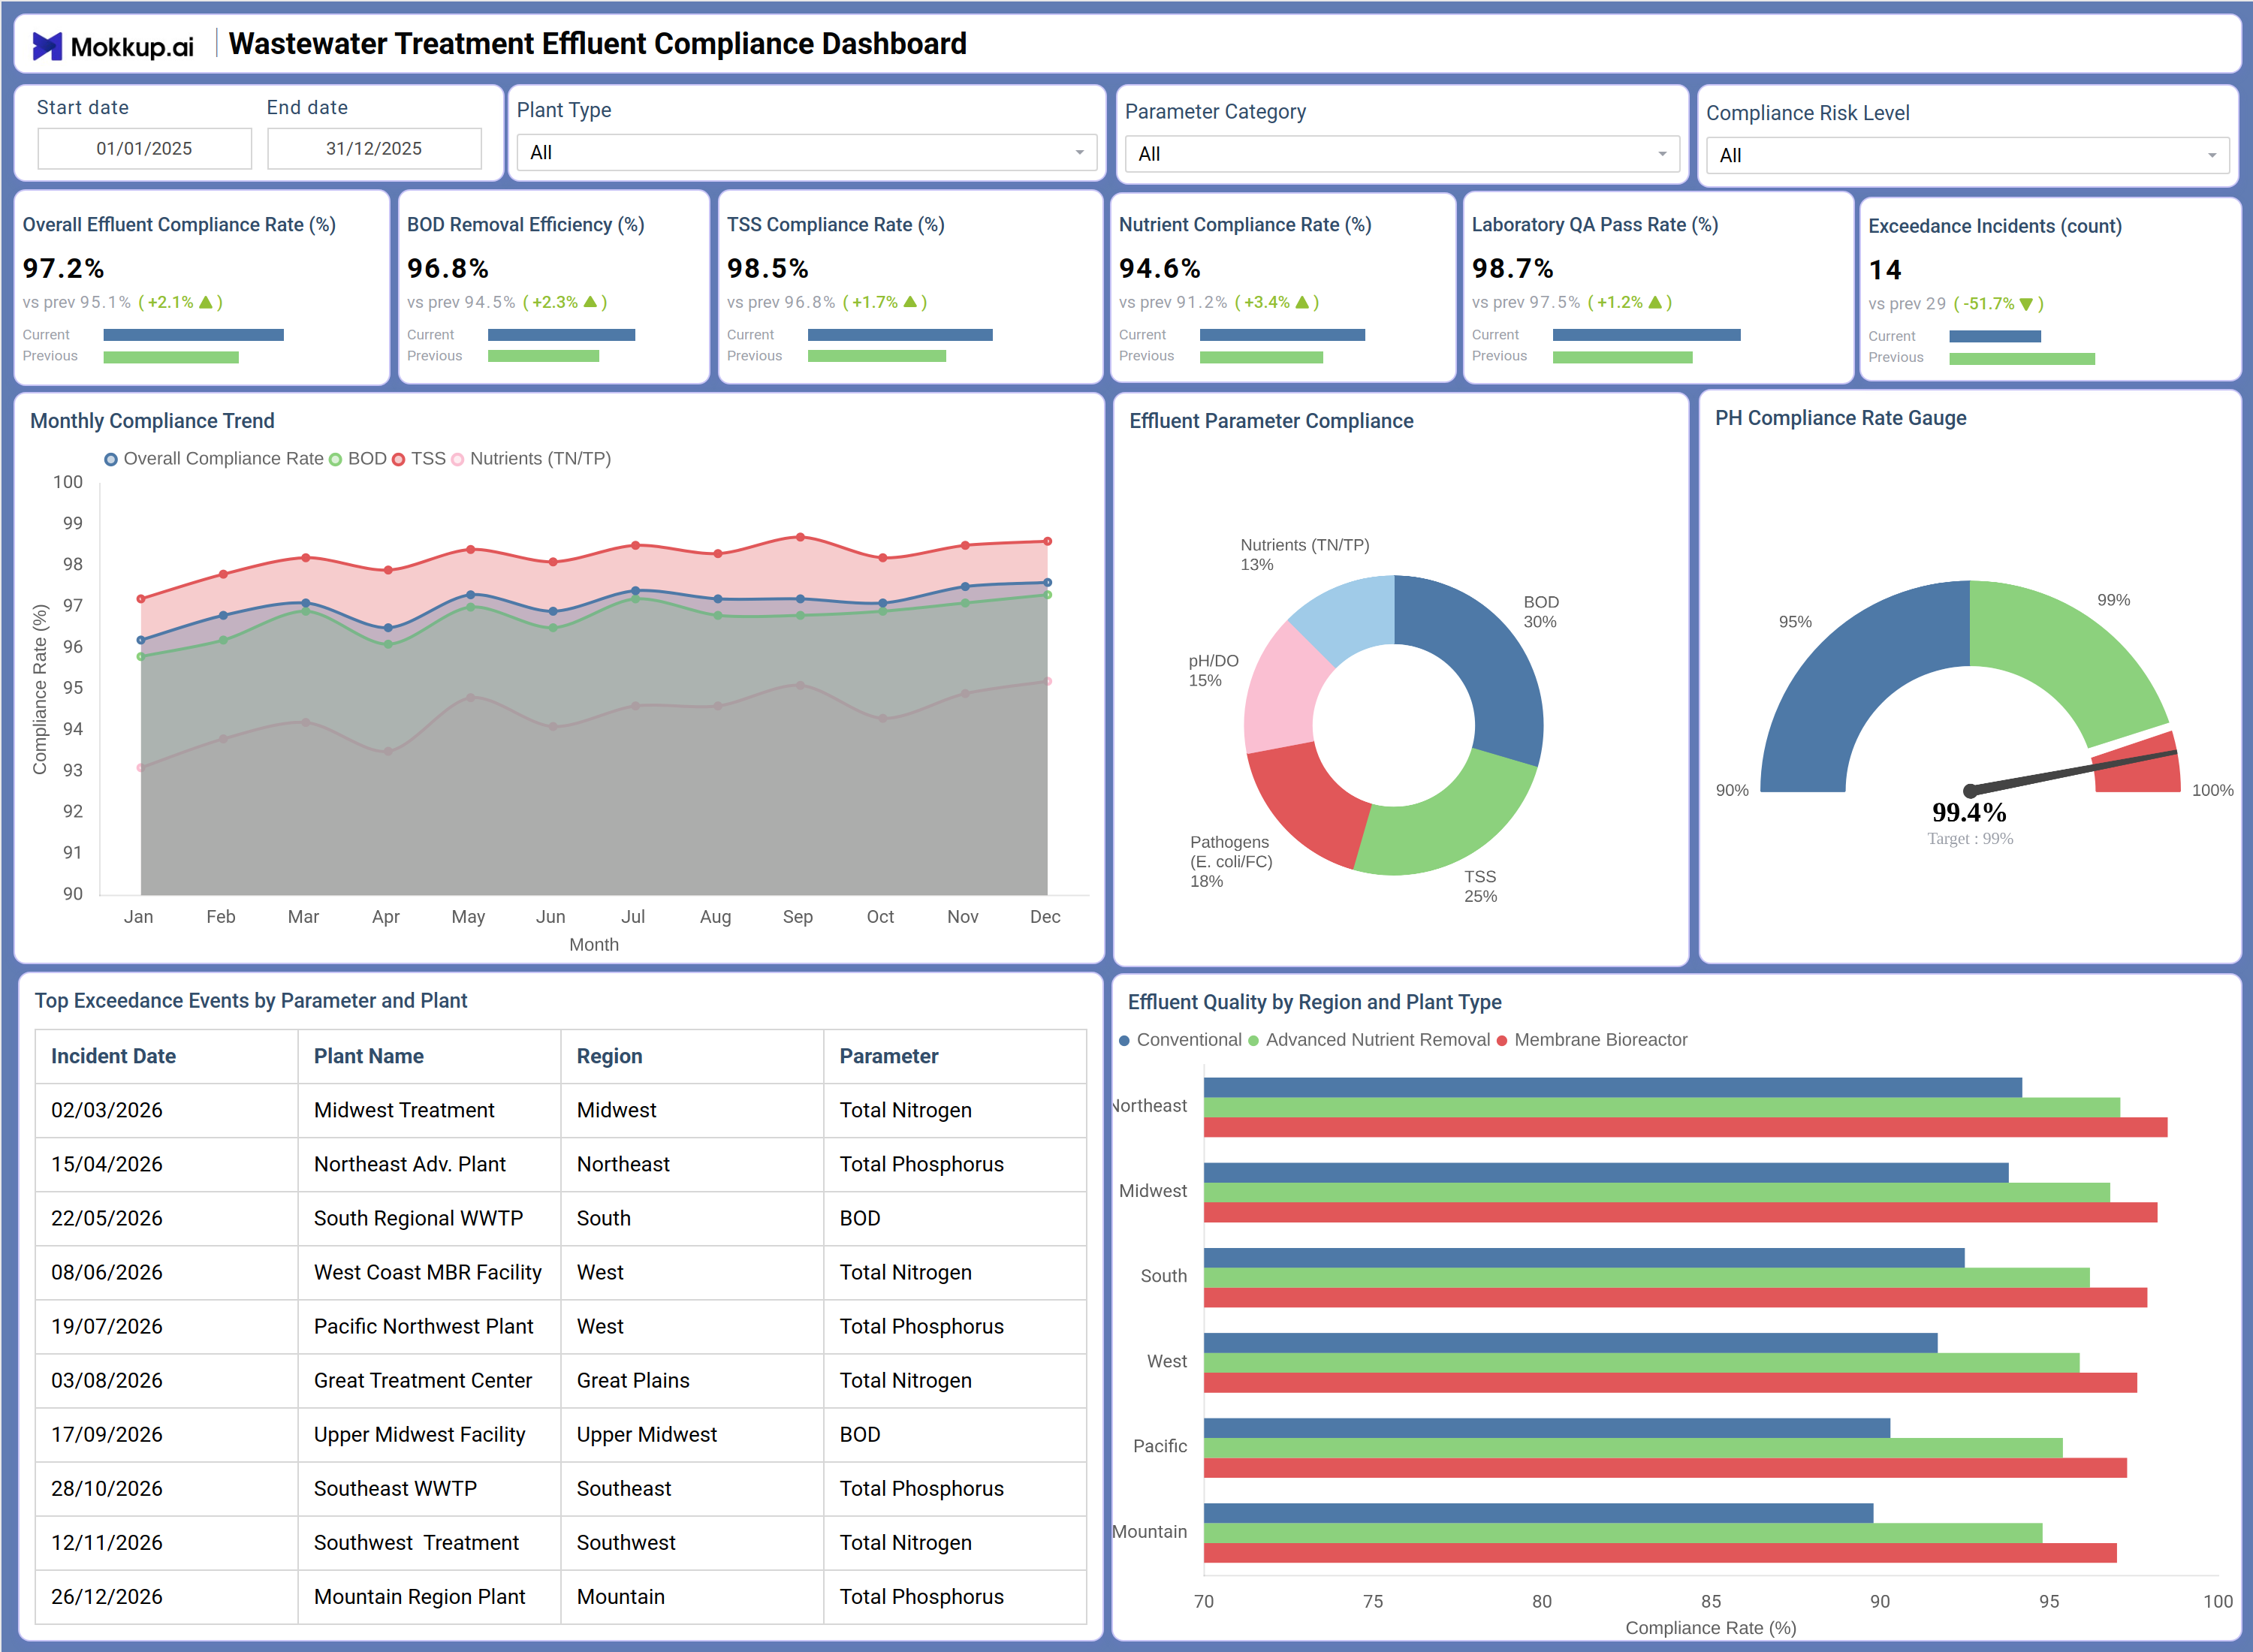
The dashboard opens with six KPI tiles displaying Overall Effluent Compliance Rate, BOD Removal Efficiency, TSS Compliance Rate, Nutrient Compliance Rate, Laboratory QA Pass Rate, and Exceedance Incident count for the selected period. Below the KPIs, the Monthly Compliance Trend area chart plots Overall Compliance Rate, BOD, TSS, and Nutrients (TN/TP) across twelve months, providing a full-year view of parameter-level compliance patterns. The BOD removal efficiency tracking and nutrient compliance rate wastewater performance are further broken down in the Effluent Parameter Compliance donut chart, which distributes non-conformance share across Nutrients (TN/TP), BOD, TSS, pathogens (E. coli/FC), and pH/DO. A pH compliance rate gauge displays pH-specific performance at a glance, while the Top Exceedance Events by Parameter and Plant Yearly table lists each permit violation by incident date, plant name, region, and parameter. The Effluent Quality by Region and Plant Type horizontal bar chart then compares Conventional, Advanced Nutrient Removal, and Membrane Bioreactor compliance rates across six regions: Northeast, Midwest, South, West, Pacific, and Mountain.
How to Analyze Data in a Wastewater Treatment Effluent Compliance Dashboard
Here is how you can analyze data from this dashboard:
- Use the Parameter Category filter to isolate specific pollutant types such as BOD, TSS, or nutrients for targeted compliance review.
- Monitor the Monthly Compliance Trend chart to detect seasonal dips in BOD or nutrient compliance before they escalate to permit violations.
- Review the Effluent Parameter Compliance donut chart to assess parameter-level distribution and track nutrient compliance rate wastewater trends across treatment cycles.
- Use the Effluent Quality by Region and Plant Type bar chart to identify which technology types — Conventional, Advanced Nutrient Removal, or Membrane Bioreactor — are near the compliance threshold.
- Compare the Top Exceedance Events by Parameter and Plant – Yearly table to find plant locations with the highest frequency of permit violations.
- Analyze the Monthly Compliance Trend to identify which parameter — BOD, TSS, or nutrients — drives the most non-compliance events across the year.
- Filter by Compliance Risk Level to align audit priorities with high-risk treatment plants.
- Track Exceedance Incidents count over time to measure progress in reducing permit breaches.
Benefits of a Wastewater Treatment Effluent Compliance Dashboard
The following are the benefits of using this dashboard:
- Centralizes BOD removal efficiency, TSS compliance, nutrient discharge, and exceedance data across all wastewater treatment facilities in one structured template.
- Supports effluent parameter compliance monitoring across Conventional, Advanced Nutrient Removal, and Membrane Bioreactor plant types simultaneously.
- Reduces manual data compilation for discharge permit reporting with pre-built KPI tiles and chart layouts.
- Enables region-level wastewater exceedance incidents tracking to guide infrastructure investment and corrective action decisions.
- Provides a donut chart breakdown of non-conformance share by parameter for operational efficiency planning.
- Helps environmental engineers align with multiple regulatory discharge frameworks without rebuilding compliance reports from scratch.
- Gives plant operators and compliance officers a shared view of effluent quality performance across all regions.
KPIs to Track in a Wastewater Treatment Effluent Compliance Dashboard
The following key KPIs can be tracked by using this dashboard:
- Overall Effluent Compliance Rate (%): Central to any wastewater treatment effluent compliance dashboard — measures the percentage of effluent samples meeting all regulatory discharge limits across all parameters and plant types.
- BOD Removal Efficiency (%): A core BOD removal efficiency tracking metric that quantifies the percentage of biochemical oxygen demand removed during treatment, indicating organic pollutant control effectiveness.
- TSS Compliance Rate (%): This TSS compliance rate dashboard metric measures the share of total suspended solids samples within permitted limits, a primary indicator of nutrient compliance rate wastewater quality outcomes.
- Nutrient Compliance Rate (%): Measures total nitrogen (TN) and total phosphorus (TP) discharge against permit thresholds — key to effluent parameter compliance monitoring for eutrophication risk management.
- Laboratory QA Pass Rate (%): Evaluates the percentage of lab samples passing internal quality assurance protocols — supporting audit readiness and data integrity across all compliance reporting cycles.
- Exceedance Incidents (count): Tracks the number of permit violations across all parameters and plant types as listed in the Top Exceedance Events by Parameter and Plant – Yearly table, supporting wastewater exceedance incidents tracking at the facility level.
Frequently Asked Questions
1. What industries benefit most from this wastewater treatment effluent compliance dashboard?
Municipal wastewater utilities, industrial effluent treatment operators, and environmental compliance teams benefit most. It is especially valuable for plant managers overseeing multiple treatment technologies and regulatory affairs officers responsible for discharge permit compliance reporting.
2. Can this dashboard track exceedance events by specific plant and region?
Yes. The Top Exceedance Events by Parameter and Plant – Yearly table lists each incident by date, plant name, region, and parameter, giving compliance teams a clear audit trail for all permit violations across the year.
3. Is this dashboard suitable for comparing different treatment technologies?
Yes. The Effluent Quality by Region and Plant Type bar chart directly compares Conventional, Advanced Nutrient Removal, and Membrane Bioreactor technologies across six regions, making it ideal for technology benchmarking and capital investment planning.
4. How does the Monthly Compliance Trend chart work?
The Monthly Compliance Trend is an area chart that plots the Overall Compliance Rate alongside BOD, TSS, and Nutrients (TN/TP) across twelve months. It highlights seasonal patterns and helps identify which periods carry the highest non-compliance risk for targeted operational response.
5. What does the nutrient compliance rate measure?
Nutrient Compliance Rate tracks the percentage of total nitrogen and total phosphorus discharge samples that meet regulatory permit limits. It is a core nutrient compliance rate wastewater metric used to manage eutrophication risk in receiving water bodies and to assess the effectiveness of nutrient removal technologies.