
What is a Primary Schools Procurement Operations Dashboard
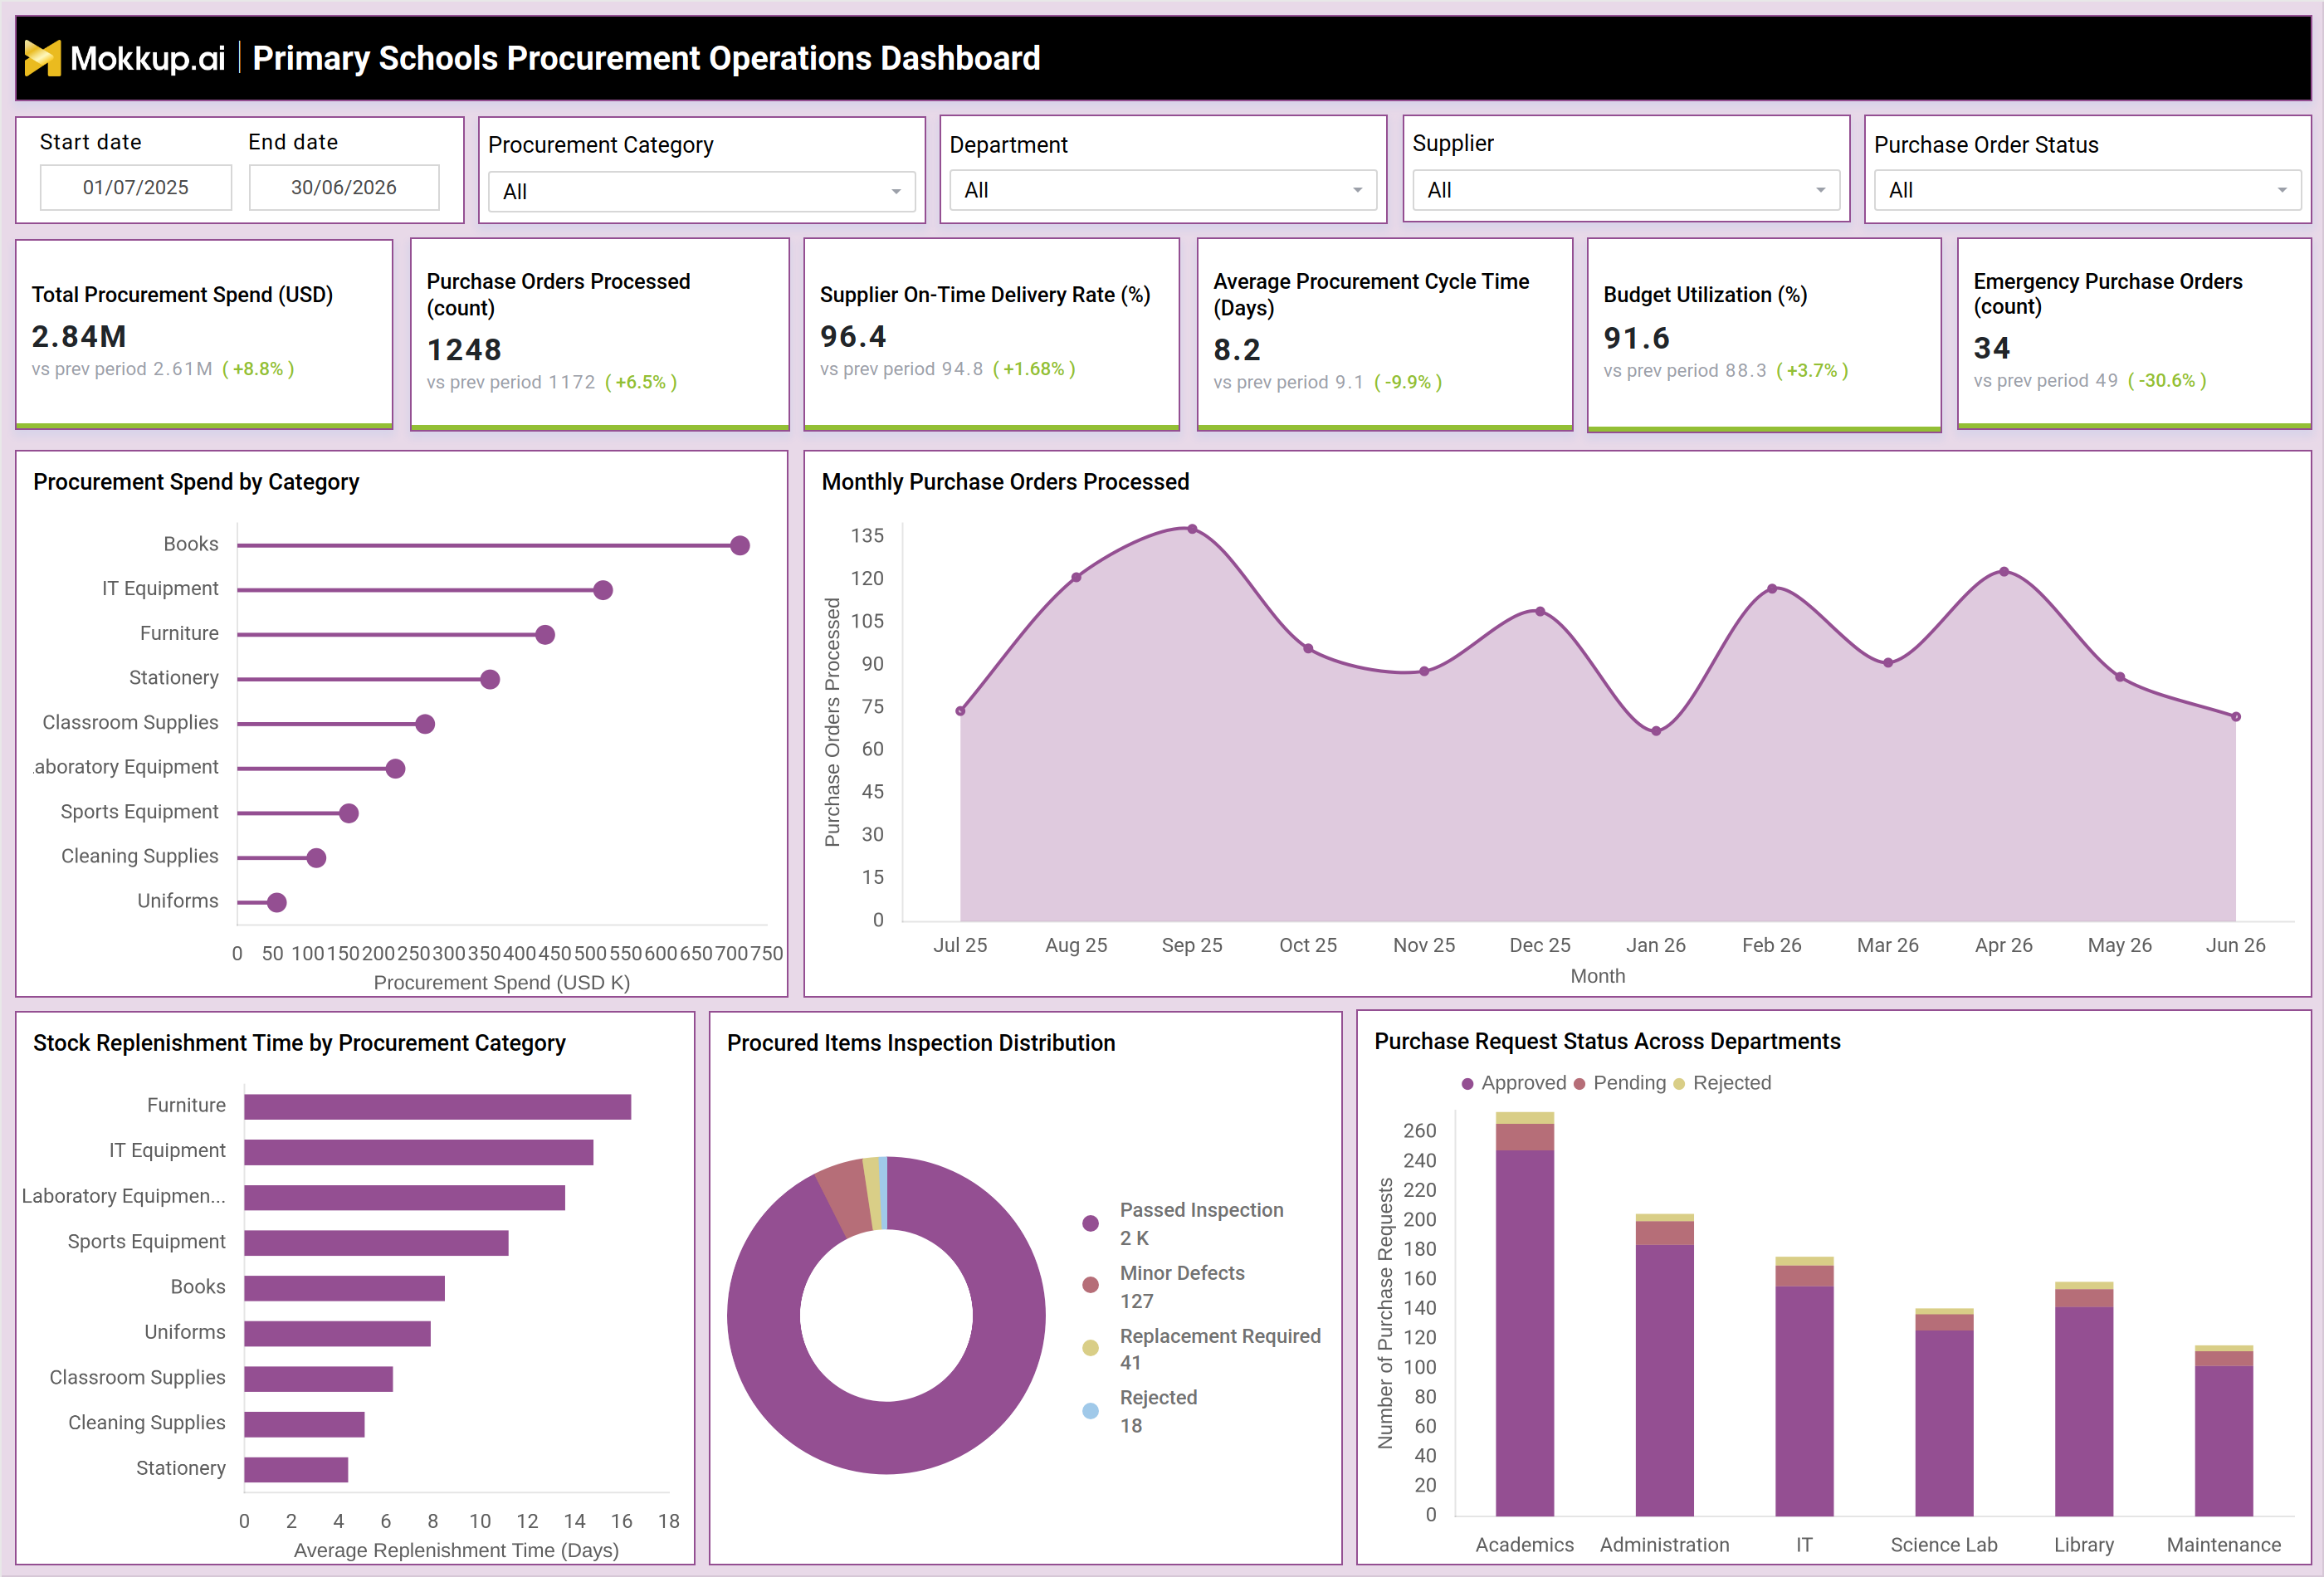
The Primary Schools Procurement Operations Dashboard gives school administrators and procurement teams a single view of how supplies, equipment, and services are purchased across a school or group of campuses. Built as a primary school procurement dashboard template, it consolidates spend, purchase orders, supplier performance, and inspection outcomes into a single workspace, so finance and operations staff no longer need to piece together separate spreadsheets. Filters for date range, procurement category, department, supplier, and purchase order status let users narrow the view to a specific term, subject area, or vendor relationship.
Because procurement touches everything from books and furniture to lab equipment and cleaning supplies, this dashboard also supports school purchase order tracking, allowing administrators to see where each request stands from submission through approval and delivery. Whether reviewing a single semester or comparing across academic years, the dashboard helps schools keep procurement transparent, accountable, and aligned with budget targets, making procurement spend analysis for schools a routine part of academic planning rather than a year-end scramble.
How to Create a Primary Schools Procurement Operations Dashboard
You don't need to build your report from scratch, just start with a ready-to-use dashboard template from Mokkup. Add in your data and export it however you like. Here's how to do it:
1. Create or Log in to Your Mokkup Account
Start by signing up on Mokkup.ai using your email. If you already have an account, just log in, and you'll be good to go.
2. Choose and Customize Your Dashboard Template
Find the Primary Schools Procurement Operations Dashboard template in the Templates section. Use the drag-and-drop editor to adjust KPIs, edit filters, or add elements based on your data.
3. Export to Your BI Tool
Once your dashboard wireframe is ready, use the BI Tool Export feature to send it directly to Power BI or Tableau for further analysis and enhancements. You can also download the dashboard as a PDF, PNG, or JPEG, embed it on a platform, or invite your team to collaborate.
Note: This is a Pro template. You'll need a Pro subscription on Mokkup to use and customize this dashboard wireframe. Upgrade anytime to unlock full access.
Primary Schools Procurement Operations Dashboard Example
A school procurement officer typically opens this dashboard at the start of a budget review cycle to understand how spending is tracking against expectations for the term. Before looking at individual purchase orders, they check whether overall spend and order volume look consistent with prior periods and whether supplier performance remains dependable enough to support upcoming classroom needs. From there, procurement teams can identify which categories, such as books, technology, or furniture, are consuming the largest share of the budget, and compare that against how quickly those categories are typically replenished.
Officers can also run supplier on-time delivery tracking to decide whether a vendor relationship needs renegotiation or whether sourcing should shift ahead of a new term. When inspection results flag a rise in defective or rejected shipments, teams can dig into which suppliers or categories are driving the issue before it disrupts classroom readiness. Reviewing monthly ordering patterns lets planners anticipate seasonal spikes in activity, such as the start of a term, and prepare budgets and supplier commitments in advance rather than reacting afterward. This forward view also helps finance teams flag any unusual jump in emergency purchases, prompting a closer look at whether planning gaps are driving unplanned spend.
Department heads can review how purchase requests are moving through approval, spotting where requests are piling up as pending so procurement staff can step in before delays affect academic operations. Together, these views help school administrators keep procurement predictable: spend stays within budget, suppliers are held accountable, and purchase requests move through approval without unnecessary delay, so classrooms get what they need when they need it.
How to Analyze Data in a Primary Schools Procurement Operations Dashboard
Here is how you can analyze data from this dashboard:
- Monitor budget utilization: Review Total Procurement Spend against budget utilization to ensure spending stays on track for the reporting period.
- Track purchasing trends: Compare Purchase Orders Processed month over month to identify seasonal spikes in school procurement activity.
- Evaluate supplier performance: Monitor Supplier On-Time Delivery Rate to identify vendors that require performance improvements.
- Measure procurement efficiency: Track Average Procurement Cycle Time to pinpoint delays in approval or order fulfillment.
- Analyze category spending: Filter by Procurement Category to identify high-spend categories and those with slower replenishment cycles.
- Monitor request approvals: Use the Purchase Request Status view to identify requests that remain pending across departments.
- Ensure procurement quality: Review the Procured Items Inspection Distribution to detect quality issues before supplies reach classrooms.
Benefits of a Primary Schools Procurement Operations Dashboard
The following are the benefits of using this dashboard:
- Centralize procurement reporting: Replace scattered spreadsheets with a single primary school procurement dashboard for spend analysis.
- Improve supplier accountability: Monitor supplier on-time delivery performance to identify and address vendor issues.
- Support budget planning: Track procurement budget utilization and cycle time trends to make more informed budgeting decisions.
- Reduce emergency purchases: Identify replenishment delays early to prevent last-minute procurement.
- Streamline approval workflows: Give department heads a shared view of purchase request status to reduce approval bottlenecks.
- Strengthen audit readiness: Maintain a documented record of procurement activity by category and supplier for easier audits.
KPIs to Track in a Primary Schools Procurement Operations Dashboard
The following key KPIs can be tracked by using this dashboard:
- Total Procurement Spend (USD) - the total value of purchases made across all categories in the selected period.
- Purchase Orders Processed - the count of purchase orders completed, indicating procurement throughput.
- Supplier On-Time Delivery Rate (%) - the share of orders delivered within the agreed timeline, reflecting vendor reliability.
- Average Procurement Cycle Time (Days) - the average time from purchase request to order fulfillment.
- Budget Utilization (%) - the portion of allocated procurement budget spent, core to school procurement budget utilization tracking.
- Emergency Purchase Orders (count) - the number of unplanned or rush orders placed, signaling gaps in demand planning.
Frequently Asked Questions
1. What is a Primary Schools Procurement Operations Dashboard used for?
It is used to track school procurement activity in one place, covering spend, purchase orders, supplier performance, and inspection outcomes. Administrators use it to keep purchasing aligned with budget and academic timelines.
2. How does this dashboard support purchase request approval tracking?
The Purchase Request Status view shows how requests move through approval by department, making purchase request approval tracking straightforward and highlighting where requests are stuck pending. This helps procurement staff intervene before delays affect classroom needs.
3. Can I customize this dashboard for my school's procurement categories?
Yes. Built on Mokkup's drag-and-drop editor, you can adjust categories, departments, and suppliers to match your school's structure before exporting to Power BI or Tableau.