
What is a Primary Schools Student Academic Performance Dashboard?
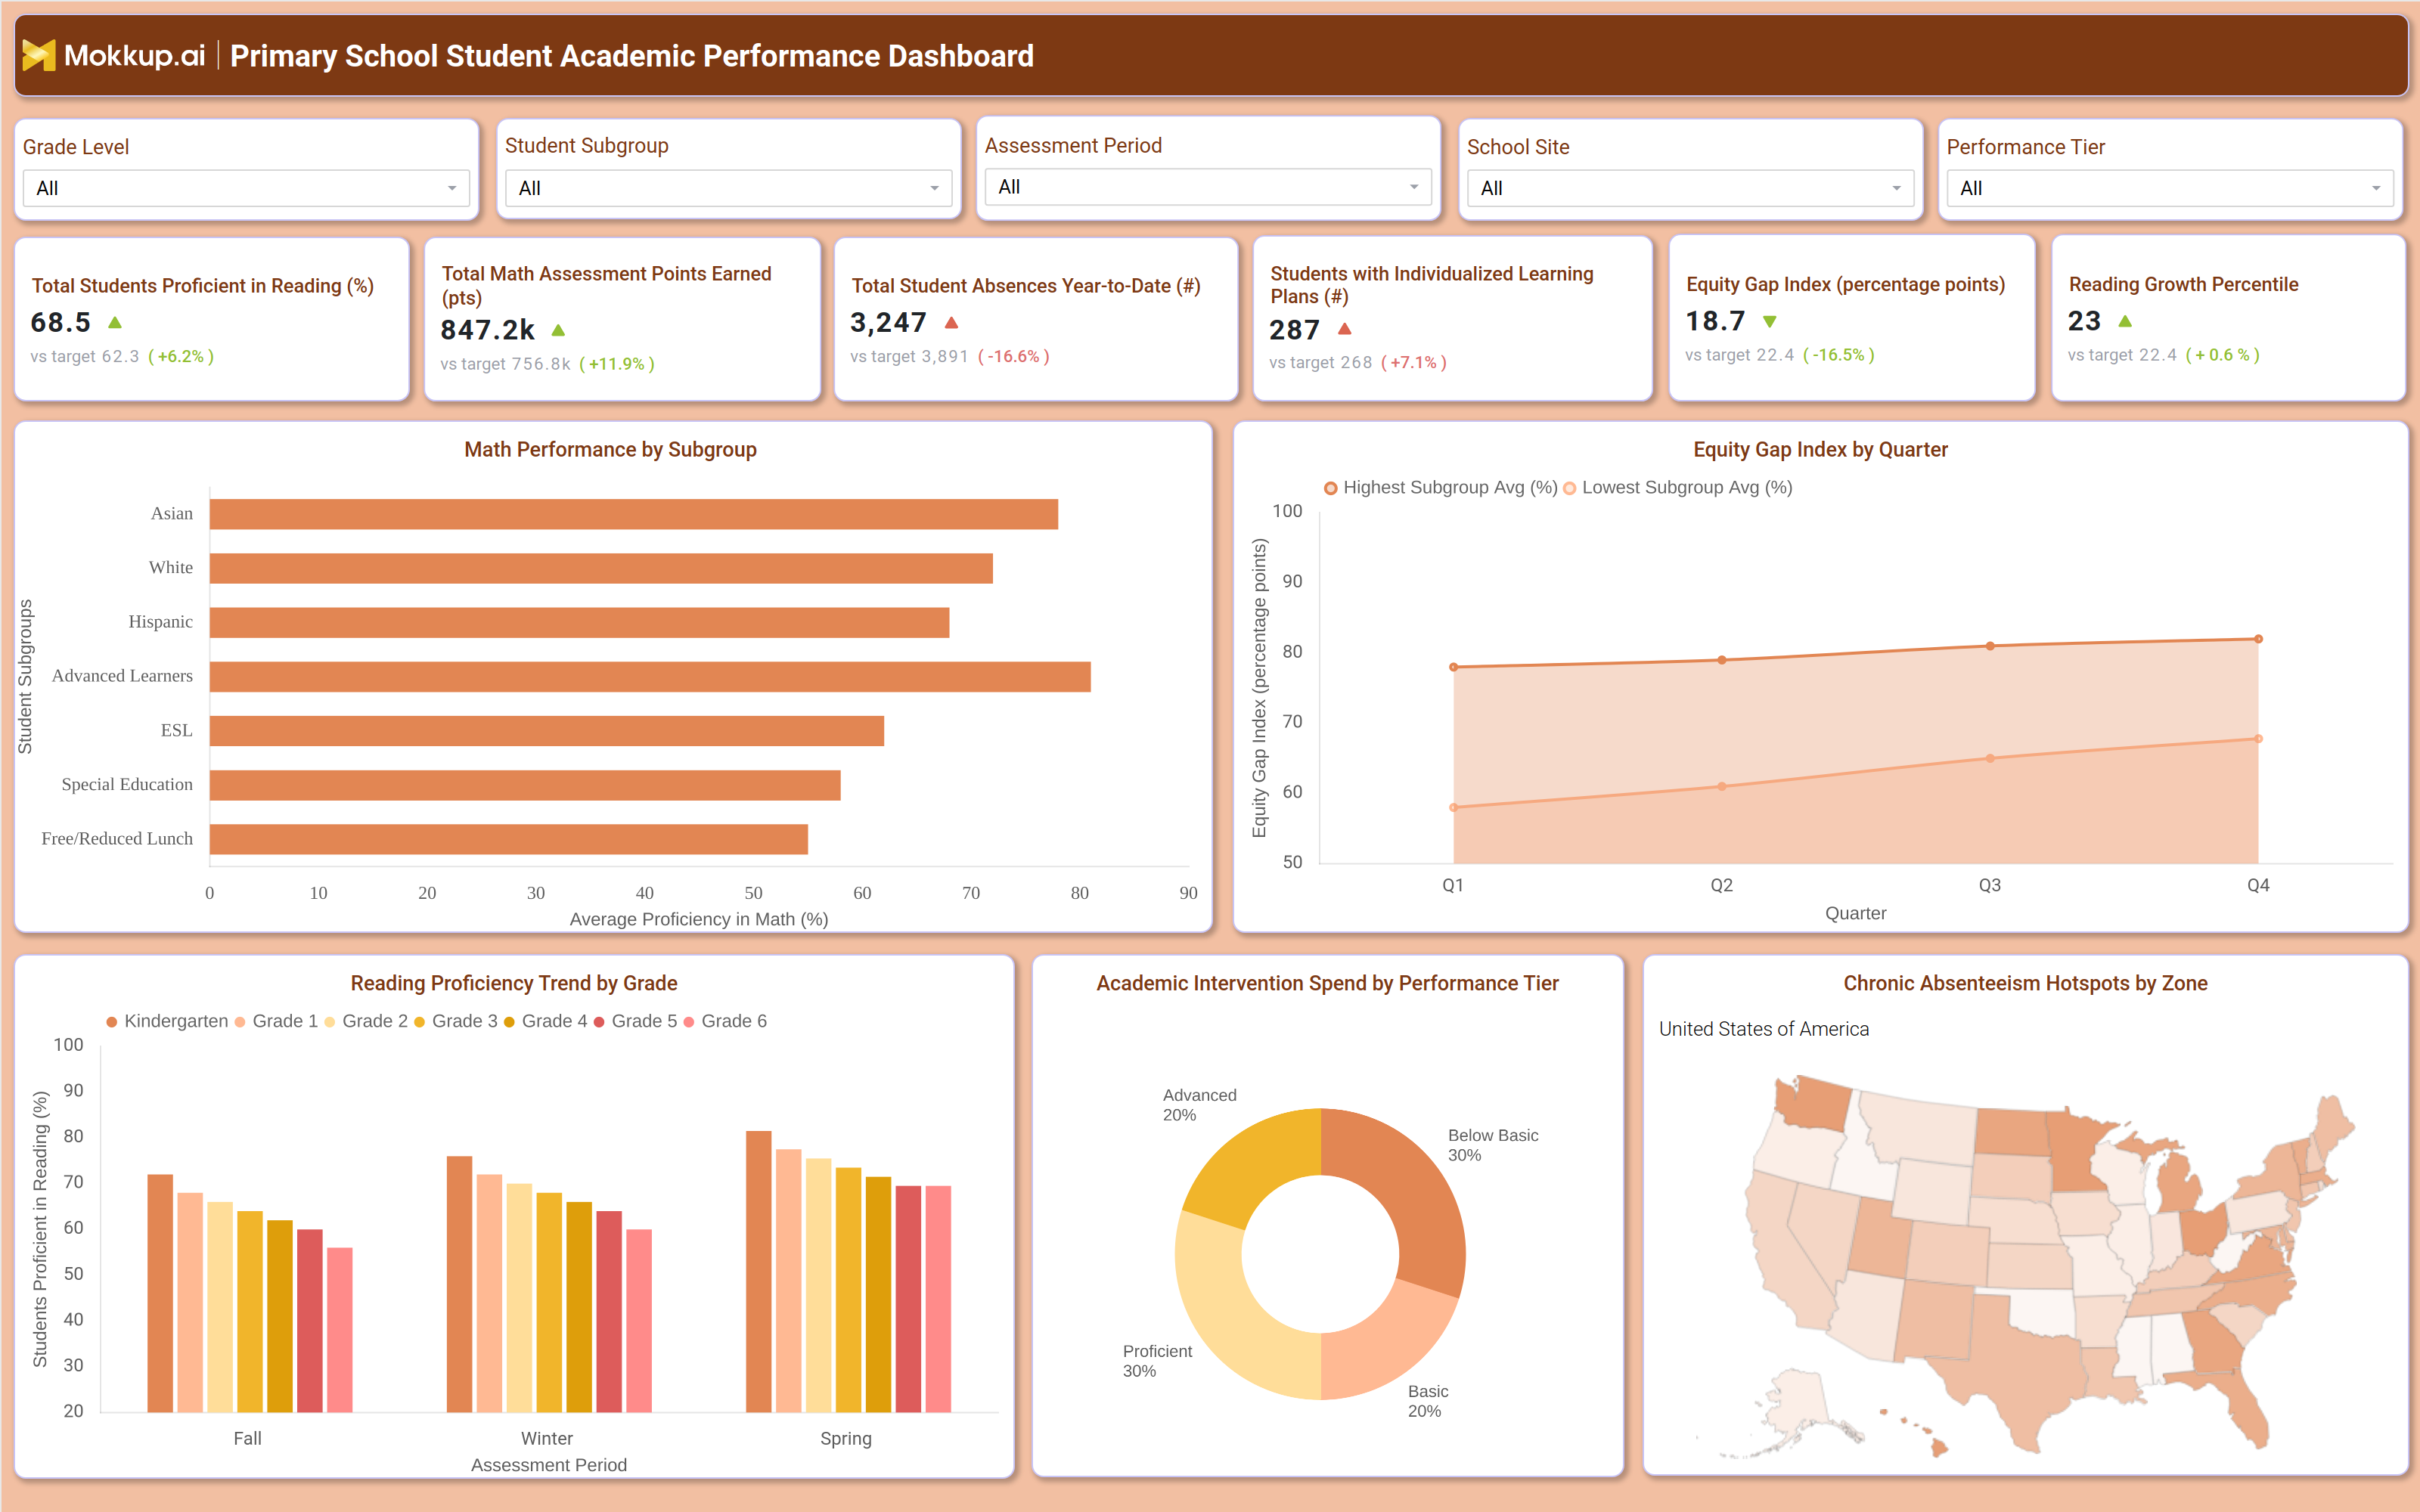
The Primary Schools Student Academic Performance Dashboard is a wireframe template built for elementary leadership teams who need one consolidated view of reading, math, and equity outcomes. It brings assessment results, absence patterns, and intervention into a single screen so principals, instructional coaches, and district administrators do not have to reconcile separate spreadsheets from different grade levels or school sites. Filters for Grade Level, Student Subgroup, Assessment Period, School Site, and Performance Tier narrow the view to a specific cohort without losing the full-school context. Because it groups KPI tiles, subgroup comparisons, grade-level trends, and geographic absenteeism data on one canvas, it functions as a primary school's student academic performance dashboard that instructional teams return to every reporting cycle instead of rebuilding analysis from separate exports.
How to Create a Primary Schools Student Academic Performance Dashboard
You don’t need to build your report from scratch; just start with a ready-to-use dashboard template from Mokkup. Add in your data and export it however you like. Here’s how to do it:
1. Create or Log in to Your Mokkup Account
Start by signing up on Mokkup.ai using your email. If you already have an account, just log in, and you'll be good to go.
2. Choose and Customize Your Dashboard Template
Find the Primary Schools Student Academic Performance Dashboard template in the Templates section. Use the drag-and-drop editor to adjust KPIs, edit filters, or add elements based on your data.
3. Export to Your BI Tool
Once your dashboard wireframe is ready, use the BI Tool Export feature to send it directly to Power BI or Tableau for further analysis and enhancements. You can also download the dashboard as a PDF, PNG, or JPEG, embed it on a platform, or invite your team to collaborate.
Note: This is a Pro template. You'll need a Pro subscription on Mokkup to use and customize this dashboard wireframe. Upgrade anytime to unlock full access.
Primary Schools Student Academic Performance Dashboard Example
A primary school instructional coordinator typically opens this dashboard at the start of a grading period to understand where reading and math outcomes stand before planning intervention groups. Rather than scanning multiple exported reports, the coordinator narrows the view using the Grade Level, Student Subgroup, or Assessment Period filters to isolate the cohort in question, whether that is a single grade, an English learner subgroup, or a specific school site. From there, the coordinator can run a math performance by student subgroup analysis to identify which groups are trailing the schoolwide average and need targeted support before the next assessment window. Reviewing reading proficiency trends across Fall, Winter, and Spring lets teams confirm whether earlier interventions are closing gaps or flattening out in upper grades.
Tracking the equity gap index by quarter shows whether the spread between the highest and lowest performing subgroups is widening, prompting a resourcing conversation before it becomes a compliance concern. When absenteeism data flags certain zones as chronic hotspots, attendance staff can prioritize outreach there instead of spreading effort evenly. Reviewing intervention spend across performance tiers also lets budget owners confirm funding reaches students furthest below grade level. Taken together, this primary schools student academic performance dashboard template helps instructional leaders replace fragmented, backward-looking reporting with a shared reference point the whole team can act on together, so conversations about grade-level performance, subgroup equity, and intervention funding start from the same set of facts.
How to Analyze Data in a Primary Schools Student Academic Performance Dashboard
Here is how you can analyze data from this dashboard:
- Filter by Grade Level and Assessment Period to run reading proficiency tracking by grade dashboard reviews across Fall, Winter, and Spring.
- Use the Student Subgroup filter to run a math performance by student subgroup analysis and pinpoint which groups lag the schoolwide average.
- Apply the Performance Tier filter to review academic intervention spend by performance tier across Below Basic, Basic, Proficient, and Advanced tiers.
- Review the Equity Gap Index by Quarter chart to track whether subgroup performance gaps are narrowing or widening.
- Cross-reference the School Site filter with the chronic absenteeism hotspot tracking dashboard map to prioritize outreach by zone.
- Monitor Students with Individualized Learning Plans alongside subgroup proficiency to confirm support plans are producing results.
Benefits of a Primary Schools Student Academic Performance Dashboard
The following are the benefits of using this Primary School dashboard:
- Consolidates reading, math, attendance, and intervention data into one wireframe instead of scattered spreadsheets.
- Functions as a ready equity gap index monitoring tool for tracking subgroup performance spread every quarter.
- Supports a reliable chronic absenteeism hotspot tracking dashboard so attendance teams act before patterns become entrenched.
- Speeds up grading-period reviews with pre-built filters for Grade Level, Subgroup, Assessment Period, School Site, and Performance Tier.
- Standardizes reporting across school sites so district leadership sees comparable metrics.
- Supports data-informed conversations between principals, coaches, and district administrators without manual reconciliation.
KPIs to Track in a Primary Schools Student Academic Performance Dashboard
The following key KPIs can be tracked by using this dashboard:
- Total Students Proficient in Reading (%) - share of students meeting grade-level reading proficiency, tracked against target to flag whether literacy instruction is on pace.
- Total Math Assessment Points Earned (pts) - cumulative math assessment score for the selected cohort, benchmarked against a target point total.
- Total Student Absences Year-to-Date (count) - running count of student absences, used to catch attendance issues before they affect proficiency.
- Students with Individualized Learning Plans (count) - count of students on individualized learning plans, tracked to confirm support coverage matches need.
- Equity Gap Index (percentage points) - spread between the highest and lowest performing student subgroups, the core equity gap index monitoring tool metric for this dashboard.
- Reading Growth Percentile - a cohort's reading growth relative to academic peers, used to judge whether gains are keeping pace with expectations.
- Average Proficiency in Math (%) - percentage of students meeting grade-level math proficiency standards across the selected cohort.
- Academic Intervention Spend - total financial investment in intervention programs allocated by student performance tier
- Chronic Absenteeism Hotspots - geographic zones or school sites with persistently high absence rates, visualized as a map overlay
Frequently Asked Questions
1. What does the Primary Schools Student Academic Performance Dashboard track?
This primary schools student academic performance dashboard template tracks reading and math proficiency, absenteeism, individualized learning plan coverage, and the equity gap index across grade levels and student subgroups. It also surfaces academic intervention spend by performance tier so leaders can confirm funding matches student need.
.2. Can I customize this dashboard for my school district?
Yes. The template can be edited in Mokkup's drag-and-drop editor to adjust KPIs, filters, and chart types before adding your own data. Once finalized, it exports directly to Power BI or Tableau, or as a PDF, PNG, or JPEG.
3. Who should use this dashboard?
Principals, instructional coaches, and district administrators use this dashboard to review academic performance, attendance, and intervention spend without combining separate reports. It is built for teams that need a repeatable view every grading period, not a one-time analysis.