
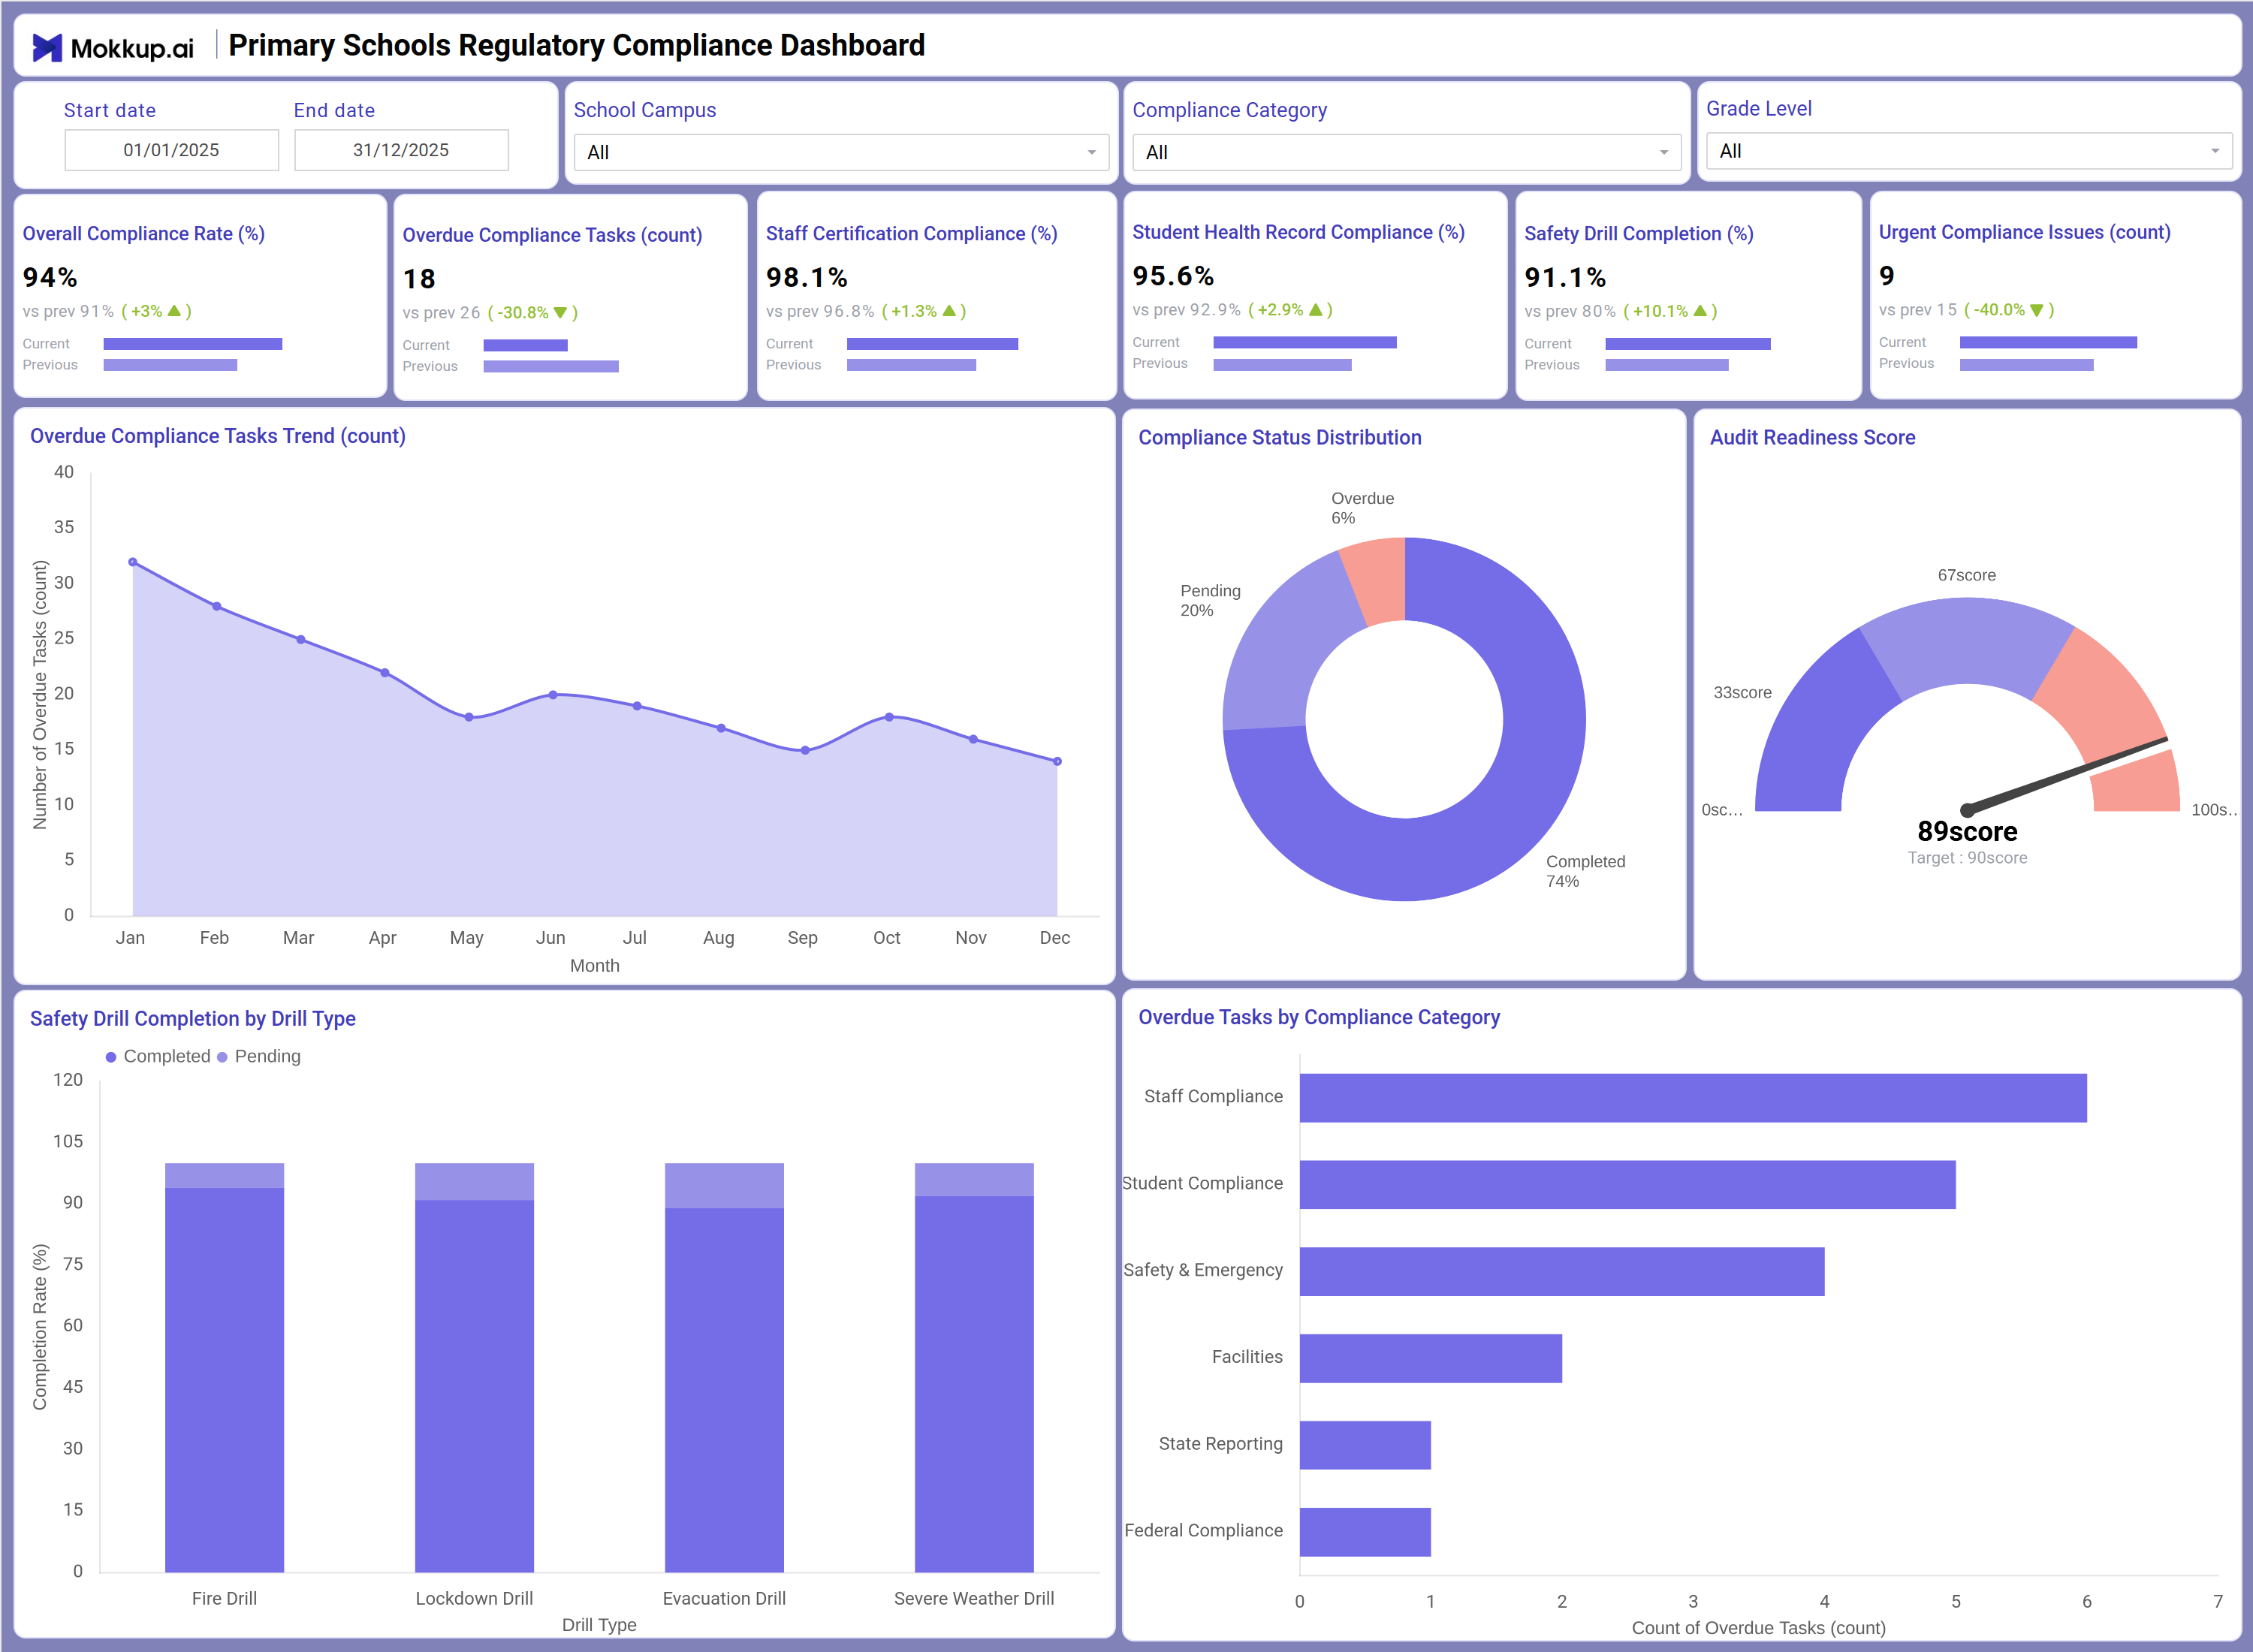
What is a Primary School Regulatory Compliance Dashboard
The Primary School Regulatory Compliance Dashboard is a monitoring template built for school administrators, compliance officers, and district oversight teams who need a single view of regulatory adherence across campuses. It consolidates compliance rates, overdue tasks, staff certifications, student health records, and safety drill outcomes into one structured layout, replacing scattered spreadsheets and manual audit checklists. As a school compliance rate tracking dashboard, it lets administrators filter data by school campus, compliance category, and grade level to isolate performance across specific sites or programs. Teams responsible for overdue compliance task tracking use it to catch lapses before state or federal reviews, making it a practical primary school regulatory compliance dashboard for any team that needs audit readiness year-round.
How to Create a Primary School Regulatory Compliance Dashboard
You don't need to build your report from scratch; just start with a ready-to-use dashboard template from Mokkup. Add in your data and export it however you like. Here's how to do it:
1. Create or Log in to Your Mokkup Account
Start by signing up on Mokkup.ai using your email. If you already have an account, just log in, and you'll be good to go.
2. Choose and Customize Your Dashboard Template
Find the Primary School Regulatory Compliance Dashboard template in the Templates section. Use the drag-and-drop editor to adjust KPIs, edit filters, or add elements based on your data.
3. Export to Your BI Tool
Once your dashboard wireframe is ready, use the BI Tool Export feature to send it directly to Power BI or Tableau for further analysis and enhancements. You can also download the dashboard as a PDF, PNG, or JPEG, embed it on a platform, or invite your team to collaborate.
Note: This is a Pro template. You'll need a Pro subscription on Mokkup to use and customize this dashboard wireframe. Upgrade anytime to unlock full access.
Primary School Regulatory Compliance Dashboard Example
A school compliance officer preparing for an upcoming district audit opens this dashboard to answer one question: Is the school ready for review right now? Instead of pulling data from multiple systems, they set a date range and select a school campus to view compliance standing without digging through separate compliance logs. From here, the officer can identify whether overall compliance is trending upward or slipping compared to the prior period and whether overdue tasks are piling up in a specific area such as staff certifications or student health records. Reviewing the audit readiness score dashboard view against its stated target helps the team gauge how close they are to full audit preparedness before an inspector arrives.
If overdue compliance task tracking flags a spike in a particular month, administrators can trace which compliance category is driving it and reassign staff to close the gap. Safety officers can also compare completion across different drill types to confirm that fire, lockdown, evacuation, and severe weather protocols are all being practiced consistently, not just the ones that are easiest to schedule. Used this way, this primary school regulatory compliance dashboard turns fragmented compliance records into one accountable view that school leaders can act on before problems become violations, giving administrators the confidence to walk into an audit prepared, rather than reconstructing compliance history the week before.
How to Analyze Data in a Primary School Regulatory Compliance Dashboard
Here is how you can analyze data from this dashboard:
- Set the Start date and End date filters to compare compliance performance across a specific reporting period.
- Use the School Campus filter to isolate compliance standing for an individual site instead of the district as a whole.
- Filter by Compliance Category to focus analysis on staff, student, safety, facilities, state, or federal requirements.
- Apply the Grade Level filter to check whether compliance gaps are concentrated in specific grade bands.
- Monitor the Overdue Compliance Tasks Trend to spot months where backlog is rising instead of clearing.
- Review the Compliance Status Distribution donut chart to see the split between completed, pending, and overdue items.
- Track the Audit Readiness Score gauge against its target to measure how close the school is to full readiness.
- Compare the Safety Drill Completion by Drill Type chart to confirm every drill type is completed, not just the easiest ones.
- Use the Overdue Tasks by Compliance Category bar chart to identify whether staff certification compliance tracking or another category needs the most attention.
Benefits of a Primary School Regulatory Compliance Dashboard
The following are the benefits of using this dashboard:
- Centralizes overall compliance rate, staff certification compliance, and student health record compliance in one school compliance rate tracking dashboard.
- Reduces manual audit prep by surfacing overdue compliance task tracking data in a single trend view.
- Supports safety drill completion tracking dashboard needs across fire, lockdown, evacuation, and severe weather drills.
- Highlights urgent compliance issues early so administrators can act before they escalate into violations.
- Gives district oversight teams a shared, filterable view of compliance across every school campus.
- Improves audit preparation with a dedicated audit readiness score dashboard view measured against a set target.
- Breaks down overdue tasks by compliance category to guide where staff attention is needed most.
KPIs to Track in a Primary School Regulatory Compliance Dashboard
KPIs, or Key Performance Indicators, are measurable values that show how well a school is meeting its regulatory compliance goals, and this school compliance rate tracking dashboard uses the following KPIs to summarize performance at a glance:
- Overall Compliance Rate (%) - Measures the share of all compliance requirements currently met across the school.
- Overdue Compliance Tasks (count) - Tracks the number of tasks past their due date, central to overdue compliance task tracking.
- Staff Certification Compliance (%) - Supports staff certification compliance tracking by measuring the share of staff with current, valid certifications.
- Student Health Record Compliance (%) - Measures the percentage of student health records that meet documentation requirements.
- Safety Drill Completion (%) - Feeds safety drill completion tracking dashboard views by measuring drills completed against those scheduled.
- Urgent Compliance Issues (count) - Tracks open issues flagged as high priority that need immediate resolution.
- Audit Readiness Score - A composite score used in the audit readiness score dashboard view to indicate overall preparedness against a target benchmark.
Frequently Asked Questions
1. What industries benefit most from this Primary School Regulatory Compliance Dashboard?
Primary schools, school districts, and education compliance teams benefit most, along with facilities and safety officers who track drills and audits. It also supports state reporting teams that need a consolidated view of overdue and completed tasks.
2. Can this dashboard track overdue tasks by category?
Yes. The Overdue Tasks by Compliance Category chart breaks down overdue items across staff, student, safety, facilities, state, and federal compliance so teams know exactly where to focus.
3. What does the Audit Readiness Score measure?
The Audit Readiness Score is a single composite score that reflects how prepared a school is for a regulatory audit against a defined target. It helps administrators track progress at a glance without reviewing every individual metric.