
What is a Natural Gas Transmission Workforce Productivity & Safety Certification Dashboard?
Natural gas transmission relies on a skilled workforce to maintain pipeline integrity, ensure safety compliance, and optimize operational efficiency. A Natural Gas Transmission Workforce Productivity & Safety Certification Dashboard provides utility managers, safety officers, and operations leaders with a centralized platform to monitor workforce performance, certification status, and safety metrics. This dashboard integrates data from field operations, training records, incident reports, and compliance logs to deliver actionable insights. By tracking key performance indicators (KPIs) such as field crew hours worked, certification completion rates, near-miss incidents, and workforce utilization, utilities can identify productivity gaps, mitigate risks, and ensure regulatory compliance. The dashboard also helps in workforce planning by highlighting certification expiry risks, regional coverage gaps, and crew efficiency trends.
How to Create a Natural Gas Transmission Workforce Productivity & Safety Certification Dashboard
You don’t need to build your report from scratch, just start with a ready-to-use dashboard template from Mokkup. Add in your data and export it however you like. Here’s how to do it:
1. Create or Log in to Your Mokkup Account
Start by signing up on Mokkup.ai using your email. If you already have an account, just log in, and you’ll be good to go.
2. Choose and Customize Your Dashboard Template
Find the Natural Gas Transmission Workforce Productivity & Safety Certification Dashboard template in the Templates section. Use the drag-and-drop editor to adjust KPIs, edit filters, or add elements based on your data.
3. Export to Your BI Tool
Once your dashboard wireframe is ready, use the BI Tool Export feature to send it directly to Power BI or Tableau for further analysis and enhancements. You can also download the dashboard as a PDF, PNG, or JPEG, embed it on a platform, or invite your team to collaborate.
Note: This is a Pro template. You’ll need a Pro subscription on Mokkup to use and customize this dashboard wireframe. Upgrade anytime to unlock full access.
Natural Gas Transmission Workforce Productivity & Safety Certification Dashboard Example
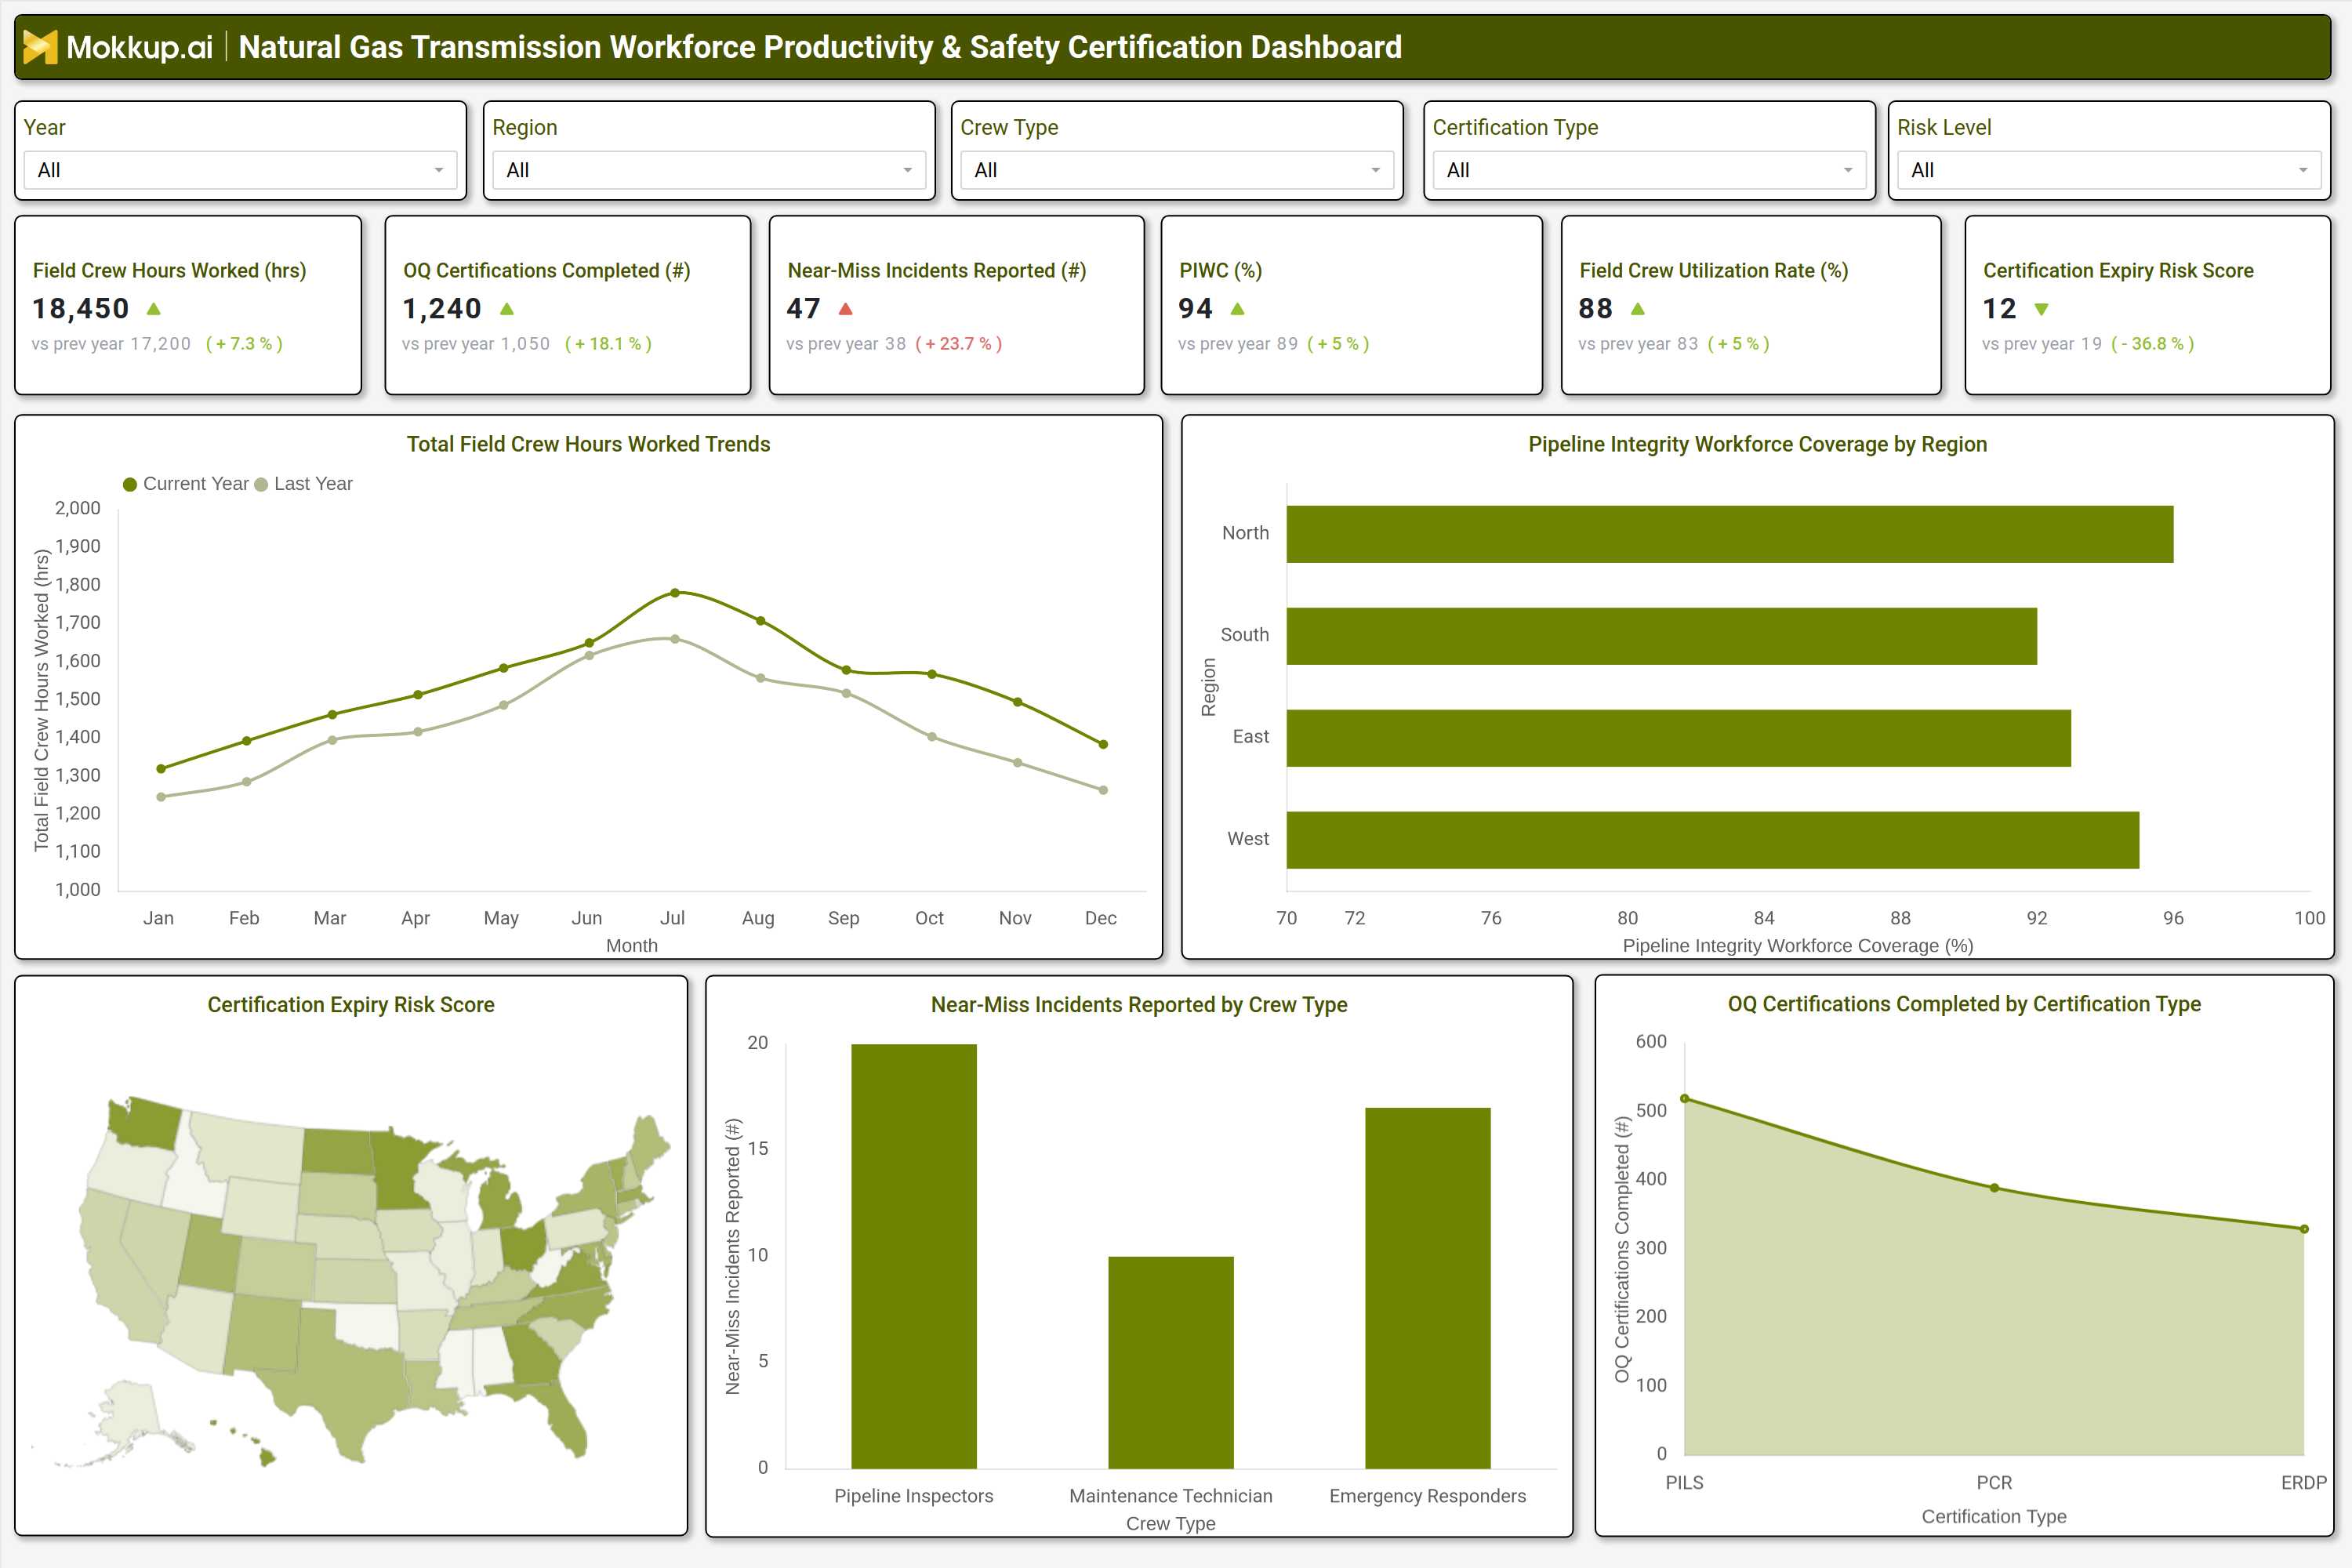
A well-designed pipeline integrity workforce coverage dashboard includes interactive filters for year, region, crew type, certification type, and risk level, allowing users to drill down into specific data segments. Key metrics displayed in the dashboard include total field crew hours worked, operational qualifications (OQ) certifications completed, near-miss incidents reported, pipeline integrity workforce coverage, field crew utilization rate, and certification expiry risk scores. Trend charts compare current-year performance against previous periods, showing improvements or declines in productivity and safety. Regional breakdowns highlight workforce coverage and certification compliance across different service territories. A geographic heatmap visualizes certification expiry risks by state, while bar charts compare near-miss incidents by crew type, such as pipeline inspectors, maintenance technicians, and emergency responders. Stacked area charts track monthly field crew hours worked, segmented by job role, to identify workload distribution patterns. Together, these components create a pipeline workforce compliance and safety analytics tool that enables data-driven decision-making for workforce optimization and risk management.
How to Analyze Data in a Natural Gas Transmission Workforce Productivity & Safety Certification Dashboard
Here is how you can analyze data from this dashboard:
- Review total field crew hours worked to assess workforce capacity and identify seasonal or regional workload variations.
- Monitor OQ certifications completed to ensure compliance with pipeline safety regulations and track training program effectiveness.
- Analyze near-miss incidents by crew type to pinpoint high-risk roles and improve safety protocols.
- Evaluate pipeline integrity workforce coverage by region to identify understaffed areas and optimize crew deployment.
- Track field crew utilization rates to measure workforce efficiency and prevent overstaffing or underutilization.
- Assess certification expiry risk scores to prioritize recertification efforts and avoid compliance violations.
- Compare current-year trends with historical data to detect improvements or declines in productivity and safety performance.
- Use regional heatmaps to visualize workforce readiness and certification risks across different service territories.
Benefits of a Natural Gas Transmission Workforce Productivity & Safety Certification Dashboard
The following are the benefits of using this dashboard:
- Enhances workforce productivity tracking by providing visibility into field crew performance and utilization.
- Improves safety compliance through certification monitoring and near-miss incident analysis.
- Reduces operational risks by identifying workforce gaps and certification expiry risks before they impact pipeline integrity.
- Optimizes crew deployment by analyzing regional coverage and workload distribution.
- Supports regulatory compliance with automated tracking of OQ certifications and safety training.
- Enables data-driven workforce planning by forecasting staffing needs based on historical trends.
- Lowers training costs by prioritizing recertification for high-risk roles and regions.
- Increases operational efficiency by streamlining workforce management and reducing downtime.
KPIs to Track in a Natural Gas Transmission Workforce Productivity & Safety Certification Dashboard
The following key KPIs can be tracked by using this OQ certification expiry risk dashboard:
- Total Field Crew Hours Worked (Hrs): Measures the total labor hours invested by field crews in pipeline operations and maintenance.
- OQ Certifications Completed (count): Tracks the number of operational qualifications certifications completed by workforce members.
- Near-Miss Incidents Reported (count): Counts safety incidents that could have resulted in workplace accidents, helping identify high-risk activities.
- Pipeline Integrity Workforce Coverage (%): Evaluates the percentage of pipeline segments covered by certified workforce members.
- Field Crew Utilization Rate (%): Measures workforce efficiency by comparing actual hours worked to available capacity.
- Certification Expiry Risk Score: Quantifies the risk of certification lapses based on upcoming expiry dates and compliance deadlines.
Frequently Asked Questions
1. Can this natural gas workforce productivity dashboard help reduce operational costs?
Yes. By optimizing field crew utilization, reducing certification lapses, and minimizing safety incidents, utilities can lower training costs, overtime expenses, and regulatory fines.
2. Who should use a pipeline safety certification compliance dashboard?
This dashboard is essential for natural gas transmission operators, safety managers, HR teams, and operations leaders responsible for workforce planning, training, and pipeline integrity.
3. What data sources feed into this field crew utilization tracking dashboard?
The dashboard integrates data from workforce management systems, training records, safety incident logs, compliance databases, and field operation reports.