
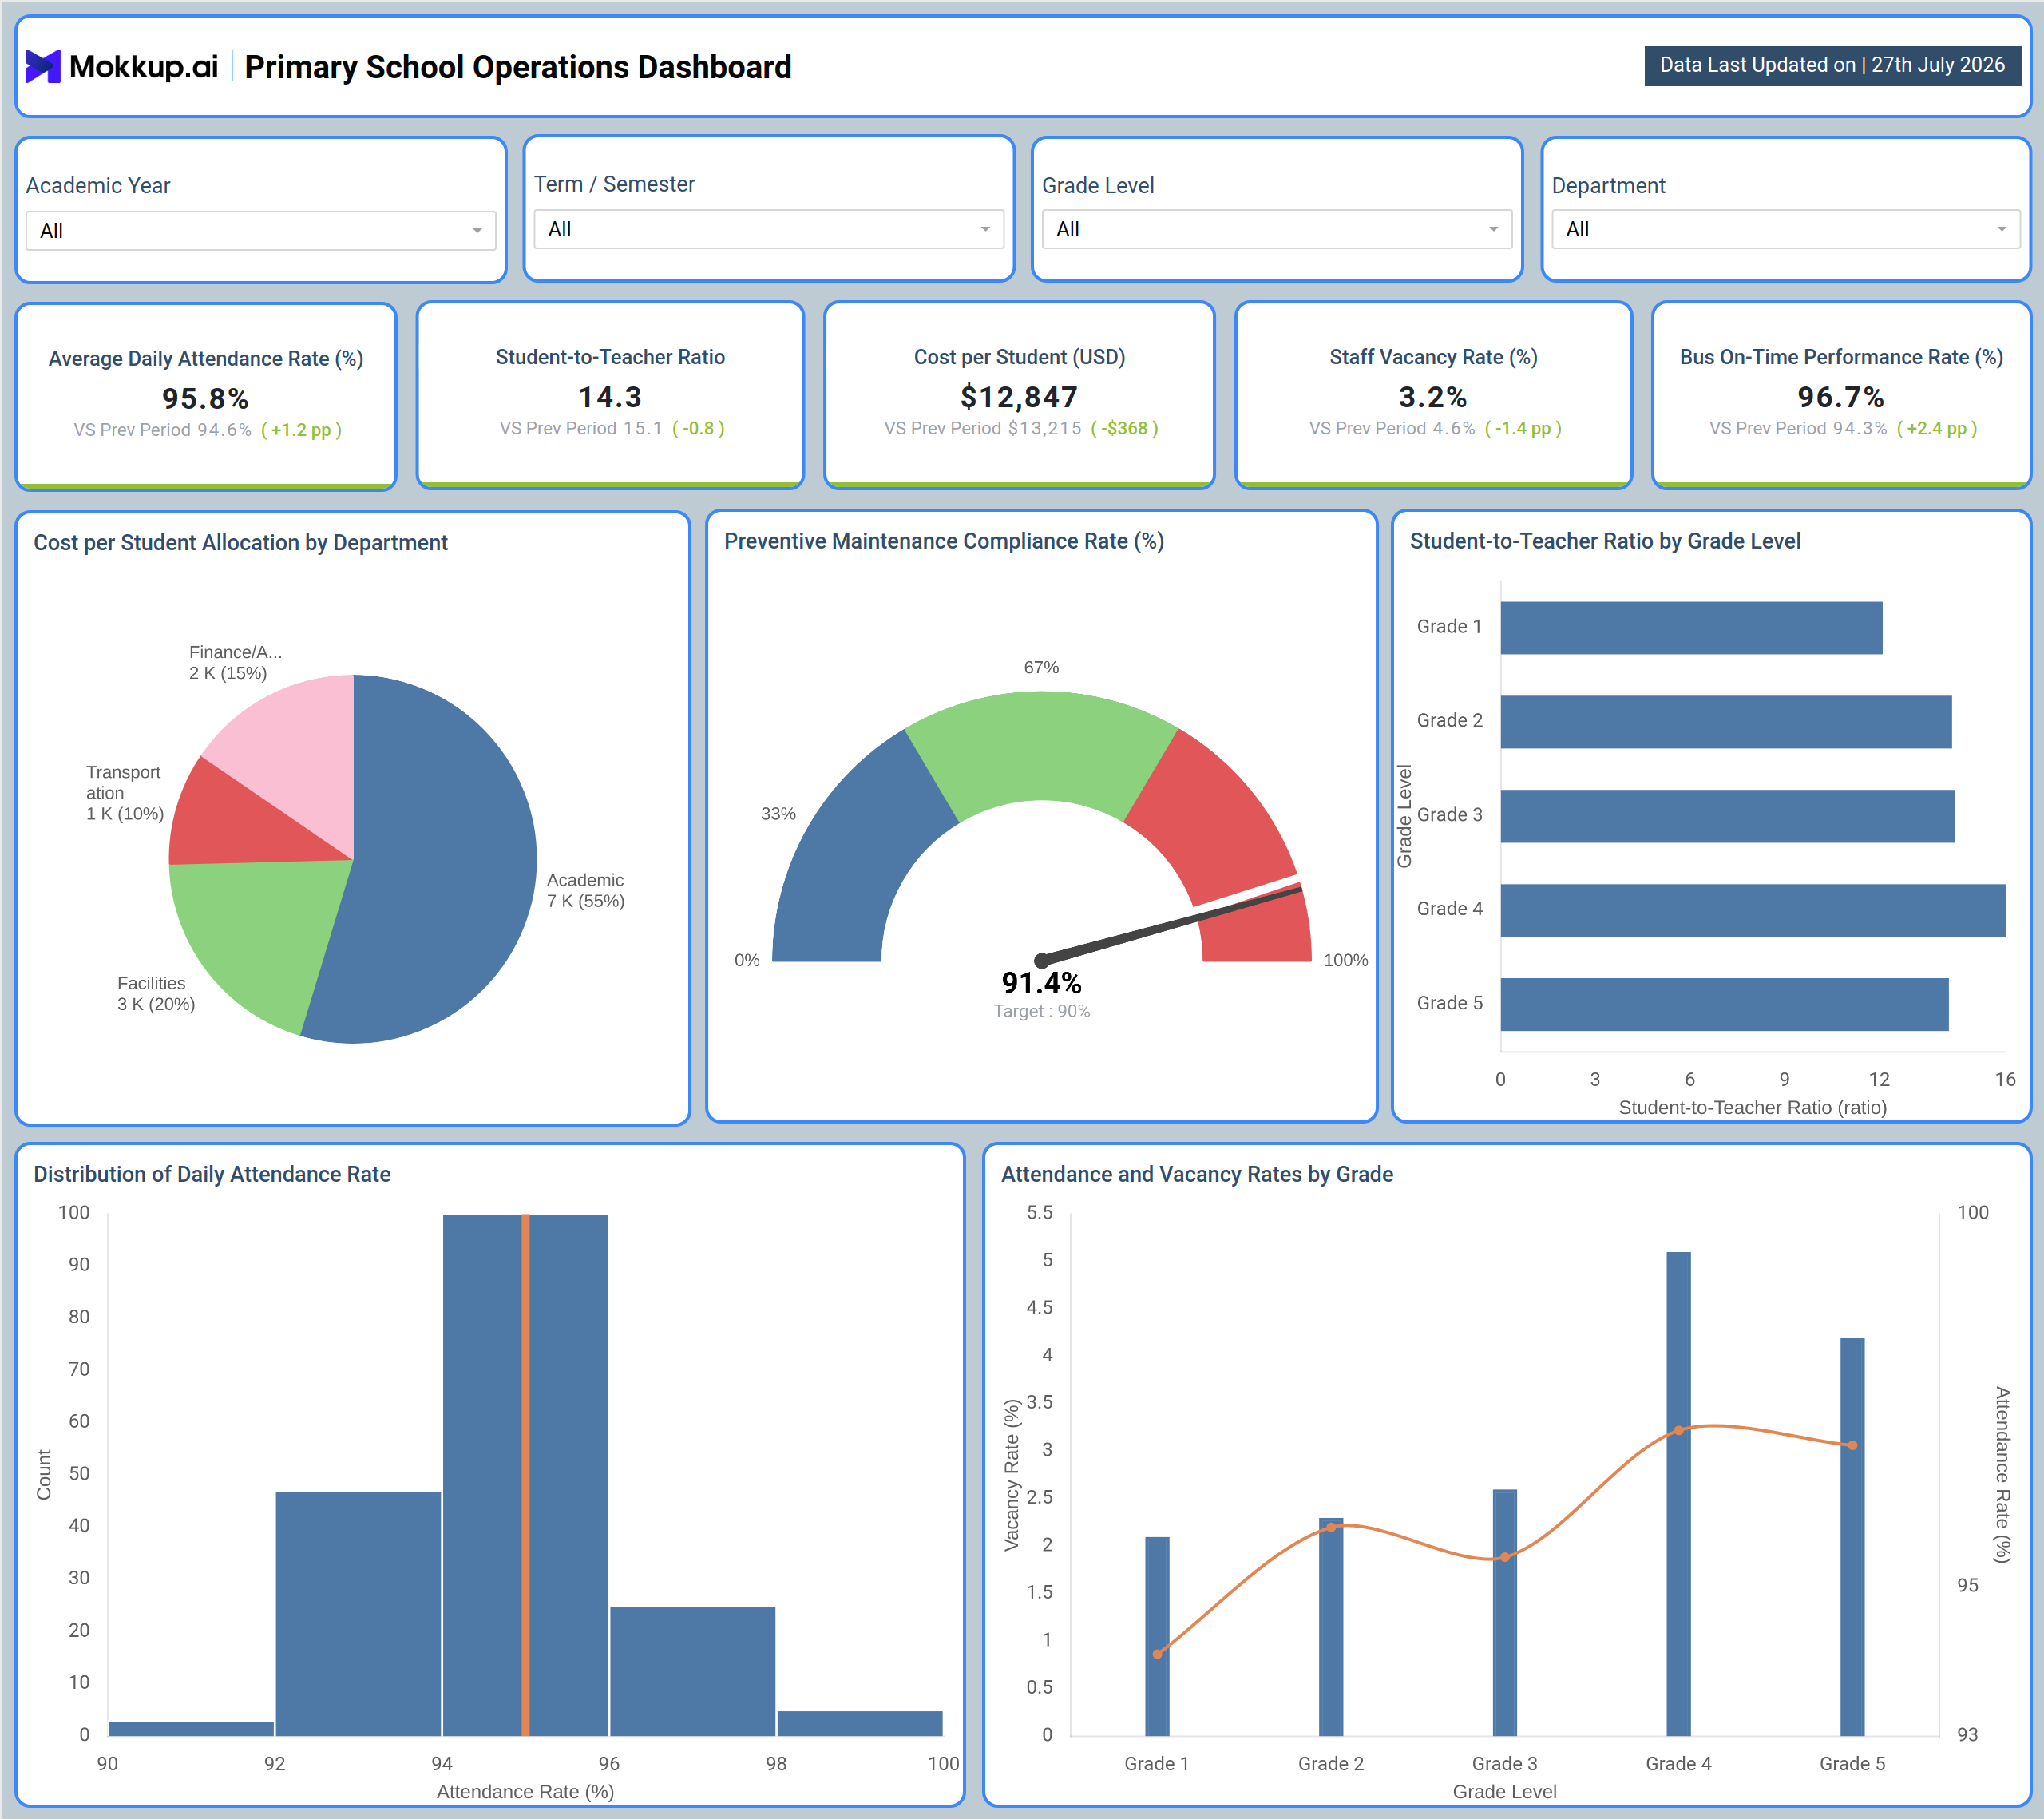
What is a Primary School Operations Dashboard
The Primary School Operations Dashboard gives school administrators a single view of the operational metrics that keep a primary school running day to day. Instead of pulling numbers from separate attendance registers, maintenance logs, transportation logs, and budget sheets, this primary school operations dashboard consolidates everything behind filters for Academic Year, Term/Semester, Grade Level, and Department. Administrators can move between school-wide summaries and grade-level detail without switching tools, making it easier to spot where attendance, staffing, facilities, or transportation need attention. Because the dashboard functions as a student attendance rate tracking tool alongside staffing and facility monitoring, principals, operations managers, and school boards can rely on the same source of truth when reviewing performance, planning budgets, or preparing for board meetings.
How to Create a Primary School Operations Dashboard
You don't need to build your report from scratch; just start with a ready-to-use dashboard template from Mokkup. Add in your data and export it however you like. Here's how to do it:
1. Create or Log in to Your Mokkup Account
Start by signing up on Mokkup.ai using your email. If you already have an account, just log in, and you'll be good to go.
2. Choose and Customize Your Dashboard Template
Find the Primary School Operations Dashboard template in the Templates section. Use the drag-and-drop editor to adjust KPIs, edit filters, or add elements based on your data.
3. Export to Your BI Tool
Once your dashboard wireframe is ready, use the BI Tool Export feature to send it directly to Power BI or Tableau for further analysis and enhancements. You can also download the dashboard as a PDF, PNG, or JPEG, embed it on a platform, or invite your team to collaborate.
Note: This is a Pro template. You'll need a Pro subscription on Mokkup to use and customize this dashboard wireframe. Upgrade anytime to unlock full access.
Primary School Operations Dashboard Example
A school operations manager preparing for a monthly leadership review opens the Primary School Operations Dashboard to understand how the school performed across attendance, staffing, facilities, and transportation over the selected term. Rather than requesting separate reports from each department, they filter by academic year and grade level to see how this period compares with the one before it. On this single screen, administrators can identify whether attendance is holding steady or slipping, and whether that shift is isolated to specific grades or affecting the school broadly.
Facilities staff can compare planned maintenance work against what has actually been completed to judge whether the school is on pace with its compliance target, and where risk is building. Finance leaders can review how cost per student allocation tracking breaks spending across academic, facilities, transportation, and administrative functions, helping them judge whether resources match the school's priorities. Staffing leads can review vacancy levels and student-to-teacher ratio by grade level to decide where hiring or reallocation should be prioritized before it affects classroom quality, while transportation coordinators can check whether buses are arriving on schedule to determine if route adjustments are needed.
Together, this primary school operations dashboard replaces disconnected department reports, giving school leadership one place to confirm what is working, flag what needs intervention, and prioritize where to act next before small issues affect students.
How to Analyze Data in a Primary School Operations Dashboard
Here is how you can analyze data from this dashboard:
- Compare performance over time: Filter by Academic Year and Term/Semester to evaluate performance across different reporting periods.
- Analyze grade-level trends: Use the Grade Level filter to isolate attendance, staffing, and vacancy patterns for each grade.
- Review department spending: Apply the Department filter to analyze cost allocation across Academic, Facilities, Transportation, and Finance/Admin.
- Monitor attendance consistency: Review the attendance distribution histogram to understand how student attendance varies across the school.
- Identify staffing impacts: Cross-reference Attendance and Vacancy Rates by Grade to determine where staffing gaps are affecting attendance.
- Track maintenance compliance: Monitor the Preventive Maintenance Compliance Rate gauge to ensure facility upkeep remains on schedule.
- Evaluate staffing levels: Compare the student-to-teacher ratio by grade level to identify grades that require additional teaching support.
Benefits of a Primary School Operations Dashboard
The following are the benefits of using this dashboard:
- Centralize school operations: Bring attendance, staffing, facilities, transportation, and budget data into a single primary school operations dashboard.
- Identify performance issues early: Monitor attendance and vacancy trends at the grade level to detect emerging issues quickly.
- Track facility compliance: Monitor preventive maintenance compliance against defined targets to keep school facilities in good condition.
- Improve budget visibility: Track cost per student across departments to support financial planning and resource allocation.
- Monitor transportation performance: Track school bus on-time performance to identify route delays and operational issues.
- Standardize reporting: Ensure administrators, department heads, and leadership review the same operational metrics during planning and board meetings.
- Accelerate performance reviews: Replace manual data compilation with interactive filtered views for faster monthly and term-level reporting.
KPIs to Track in a Primary School Operations Dashboard
The following key KPIs can be tracked by using this dashboard:
- Average Daily Attendance Rate (%) - measures the share of enrolled students present on a typical school day.
- Student-to-Teacher Ratio - tracks students per teacher across grades, a core input for evaluating student-to-teacher ratio by grade level trends.
- Cost per Student (USD) - measures average operating spend allocated per enrolled student.
- Staff Vacancy Rate (%) - tracks the share of teaching or staff positions currently unfilled.
- Bus On-Time Performance Rate (%) - measures how consistently school buses arrive on schedule, supporting school bus on-time performance monitoring.
Frequently Asked Questions
1. What does the Primary School Operations Dashboard track?
It tracks attendance, staffing ratios, cost per student, facility maintenance compliance, and transportation performance in one view. Administrators can filter by academic year, term, grade level, and department to review any of these areas in detail.
2. Who uses this dashboard?
School principals, operations managers, finance teams, and facilities staff use it to monitor day-to-day school performance. It also supports board-level reporting by standardizing the metrics reviewed across departments.
3. Can I customize this dashboard for my school's data?
Yes. Mokkup's drag-and-drop editor lets you adjust KPIs, filters, and chart elements to match your school's own data before exporting to your BI tool.