What is a Student Attendance & Engagement Dashboard?
A Student Attendance and Engagement Dashboard is an analytics solution for schools and universities that systematically monitors student presence, punctuality, and involvement in academic activities. These dashboards combine attendance metrics with engagement tracking to provide actionable insights that help educators and administrators improve student outcomes and academic performance.
How to Create a Student Attendance & Engagement Dashboard
You don’t need to build your report from scratch—just start with a ready-to-use dashboard template from Mokkup. Add in your data and export it however you like. Here’s how to do it:
1. Create or Log in to Your Mokkup Account
Start by signing up on Mokkup.ai using your email. If you already have an account, just log in, and you’ll be good to go.
2. Choose and Customize Your Dashboard Template
Find the Attendance Tracking Dashboard template in the Templates section. Use the drag-and-drop editor to adjust KPIs, edit filters, or add elements based on your data.
3. Export to Your BI Tool
Once your dashboard wireframe is ready, use the BI Tool Export feature to send it directly to Power BI or Tableau for further analysis and enhancements. You can also download the dashboard as a PDF, PNG, or JPEG, embed it on a platform, or invite your team to collaborate.
Note: This is a Pro template. To use and customize this dashboard wireframe, you’ll need a Pro subscription on Mokkup. Upgrade anytime to unlock full access.
Student Attendance & Engagement Dashboard Example
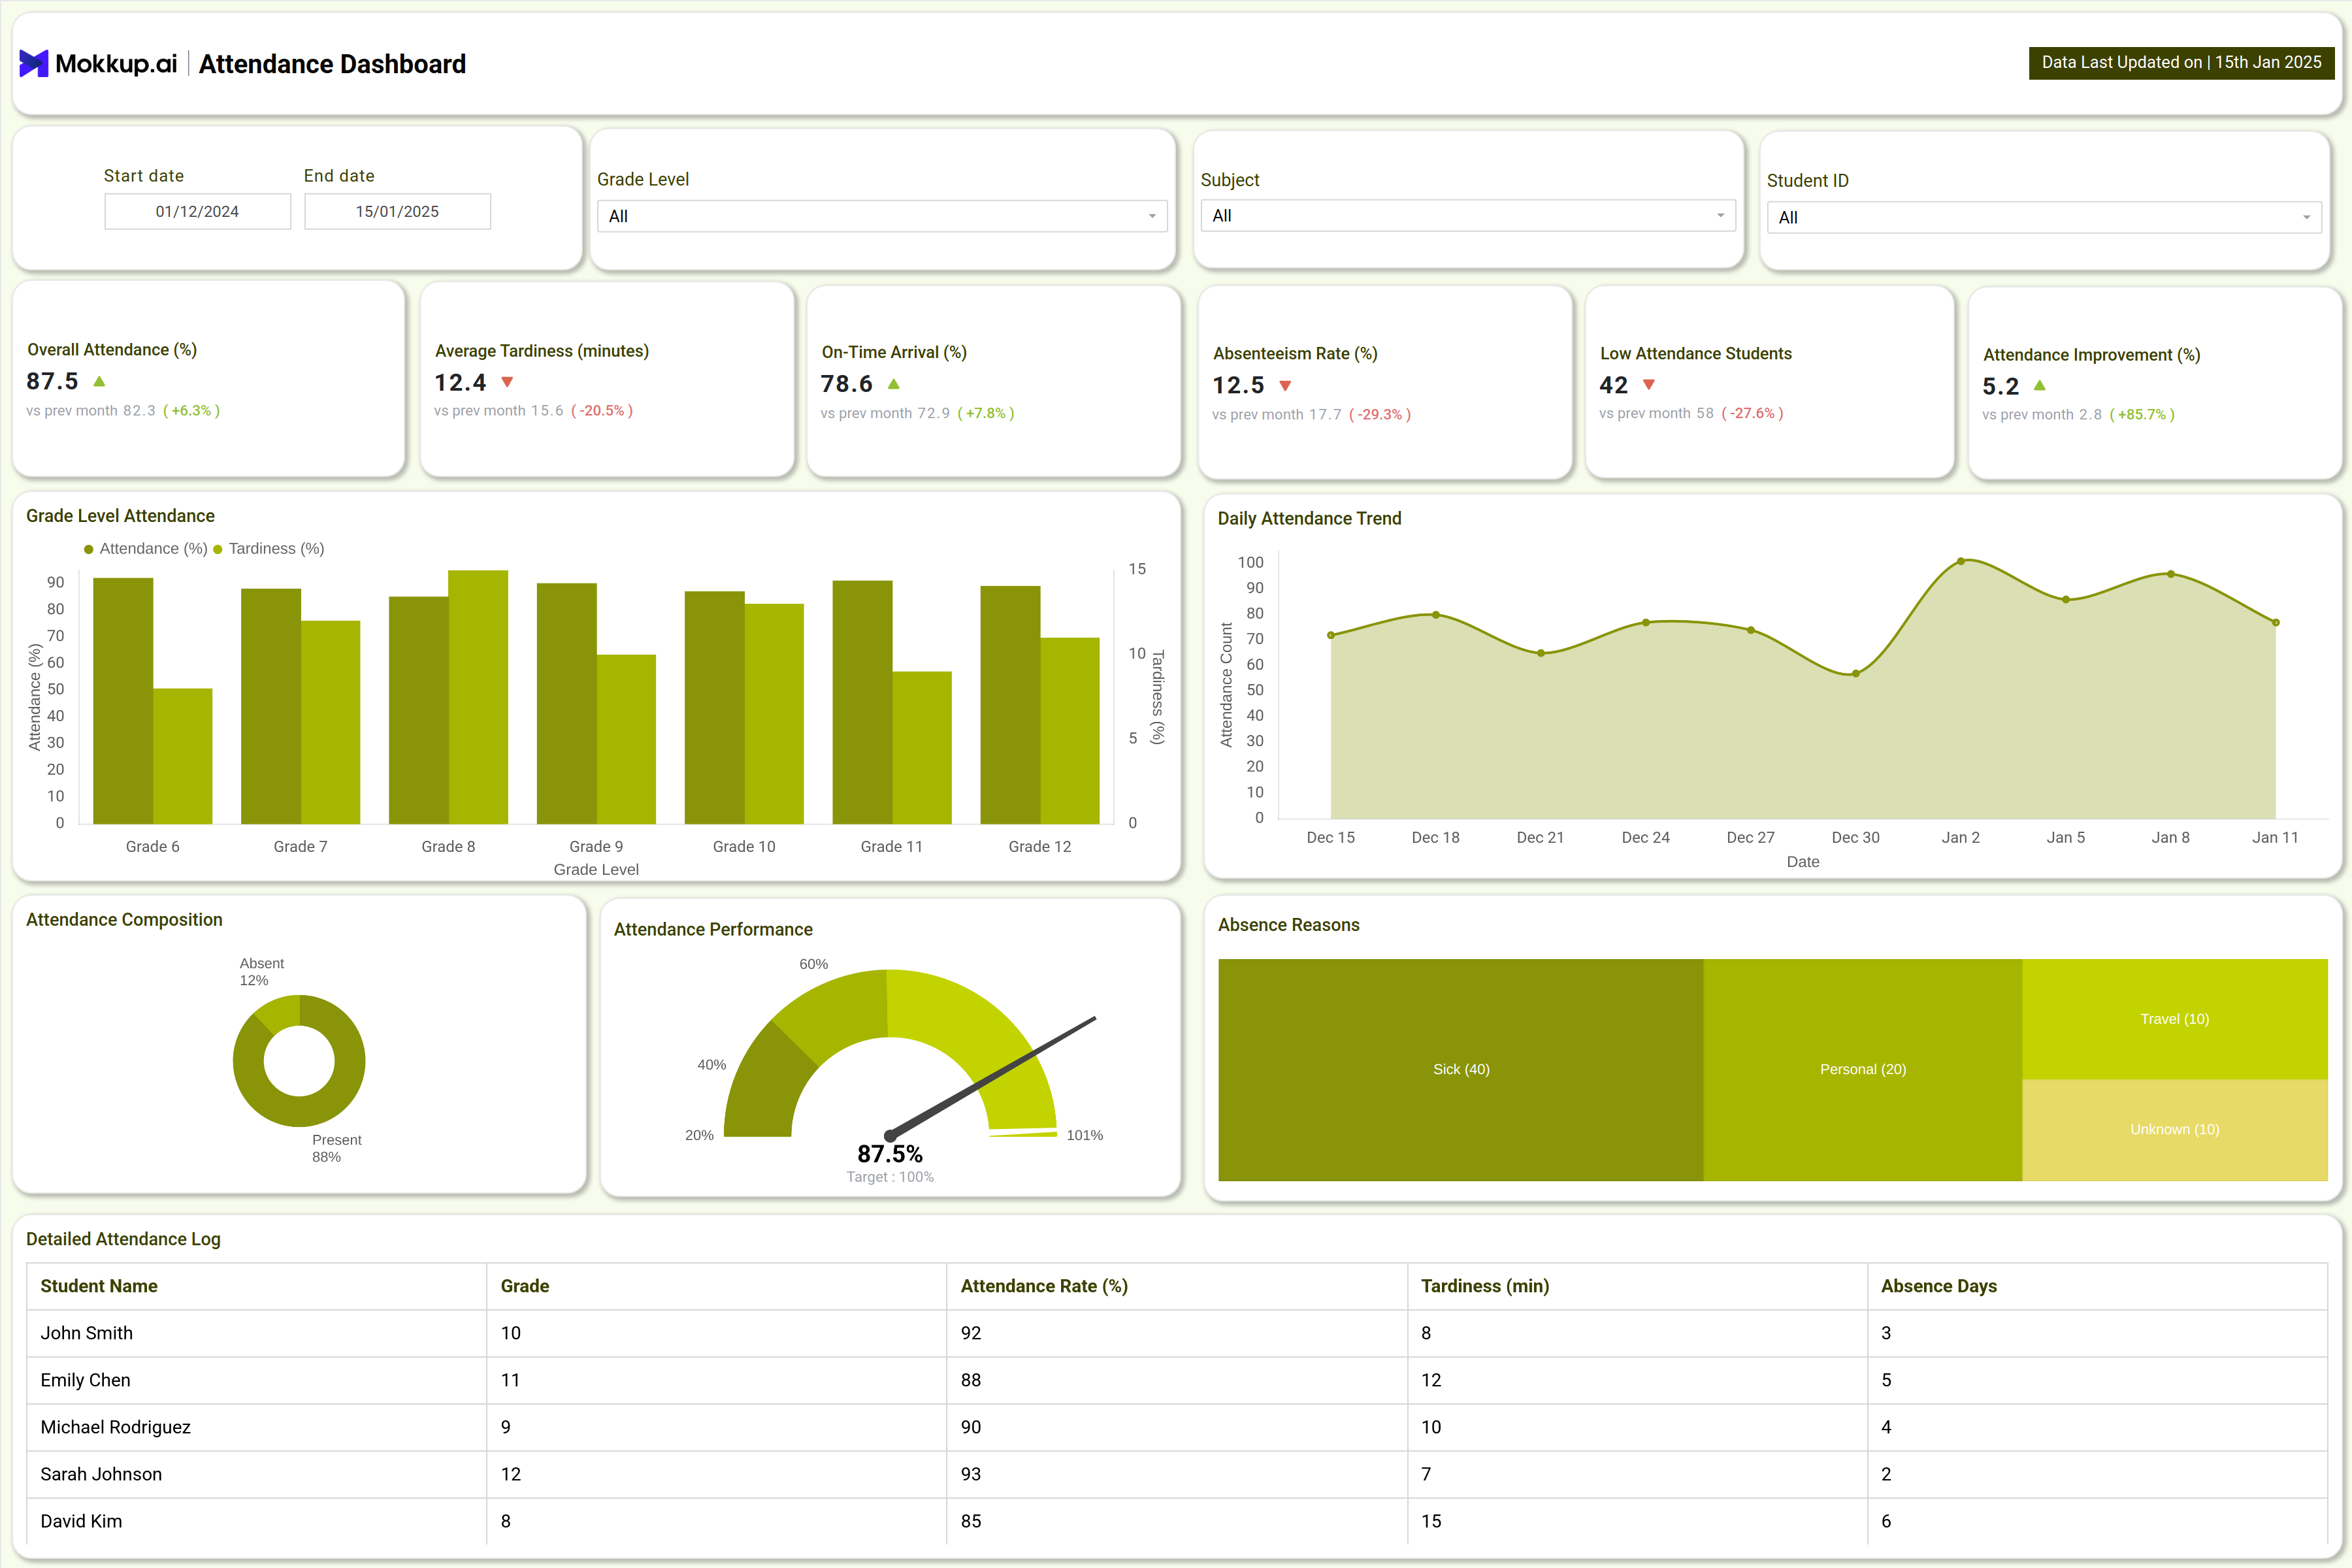
The dashboard template is designed with two main screens: the Attendance Dashboard and the Student Engagement Dashboard. The Attendance Dashboard provides insights into attendance rates, tardiness, absenteeism, grade-wise breakdowns, and the key causes of absence, such as sick leave, travel, or personal reasons. It uses a variety of visuals, including bar graphs, heatmaps, daily trend lines, and pie charts, to make the data easy to interpret. The Student Engagement Dashboard, on the other hand, focuses on tracking participation in class, online logins, forum activity, and meetings. It also highlights engagement drop-off rates and presents the information through visuals such as participation distribution charts, engagement hour trends, quadrant analysis, and participation maps.
How to Analyze Data in Student Attendance & Engagement Dashboards
- Start with top-level metrics: Overall attendance %, average tardiness, absenteeism rate, participation scores, online activity
- Use filters: Segment data by grade and demographics
- Spot trends: Look for spikes in absenteeism or declining engagement
- Visual cues:
- Heatmaps → highlight class periods or days needing attention
- Quadrants & distribution charts → show active vs disengaged students
- Combine insights: attendance + engagement metrics → guide holistic intervention strategies
Benefits of Student Attendance & Engagement Dashboards
- Centralizes academic KPIs for instant monitoring and faster decision-making.
- Enables data-driven identification of at-risk students due to absences or low engagement.
- Improves communication between faculty and administration with visual reporting.
- Supports targeted interventions and resource allocation for improved student success.
- Automates reporting, saving administrative effort and reducing errors.
- Encourages accountability and transparency in academic processes.
KPIs to Track in Student Attendance & Engagement Dashboards
Below are essential KPIs for maximizing academic performance and student retention:
- Overall Attendance (%) – Percentage of students present over a period
- Average Tardiness (min) – Average minutes late per student
- On-Time Arrival (%) – Percentage of students arriving punctually
- Absenteeism Rate (%) – Proportion of students absent in the given timeframe
- Low Attendance Students – Number of students consistently below the attendance threshold
- Attendance Improvement (%) – Change in attendance rates compared to previous periods
Frequently Asked Questions
1. Who should use Attendance & Engagement Dashboards?
Administrators, faculty, and student support services use these dashboards for efficient monitoring, early detection of issues, and continuous improvement.
2. How frequently is data updated?
Most dashboards update daily or weekly, integrating real-time attendance and engagement logs.
3. Can the dashboard segment students by class, grade, or activity level?
Yes, filters allow data drilling across grade, gender, extracurriculars, class subjects, and participation levels.