
What is a Preschools & Daycare Operations Performance Dashboard?
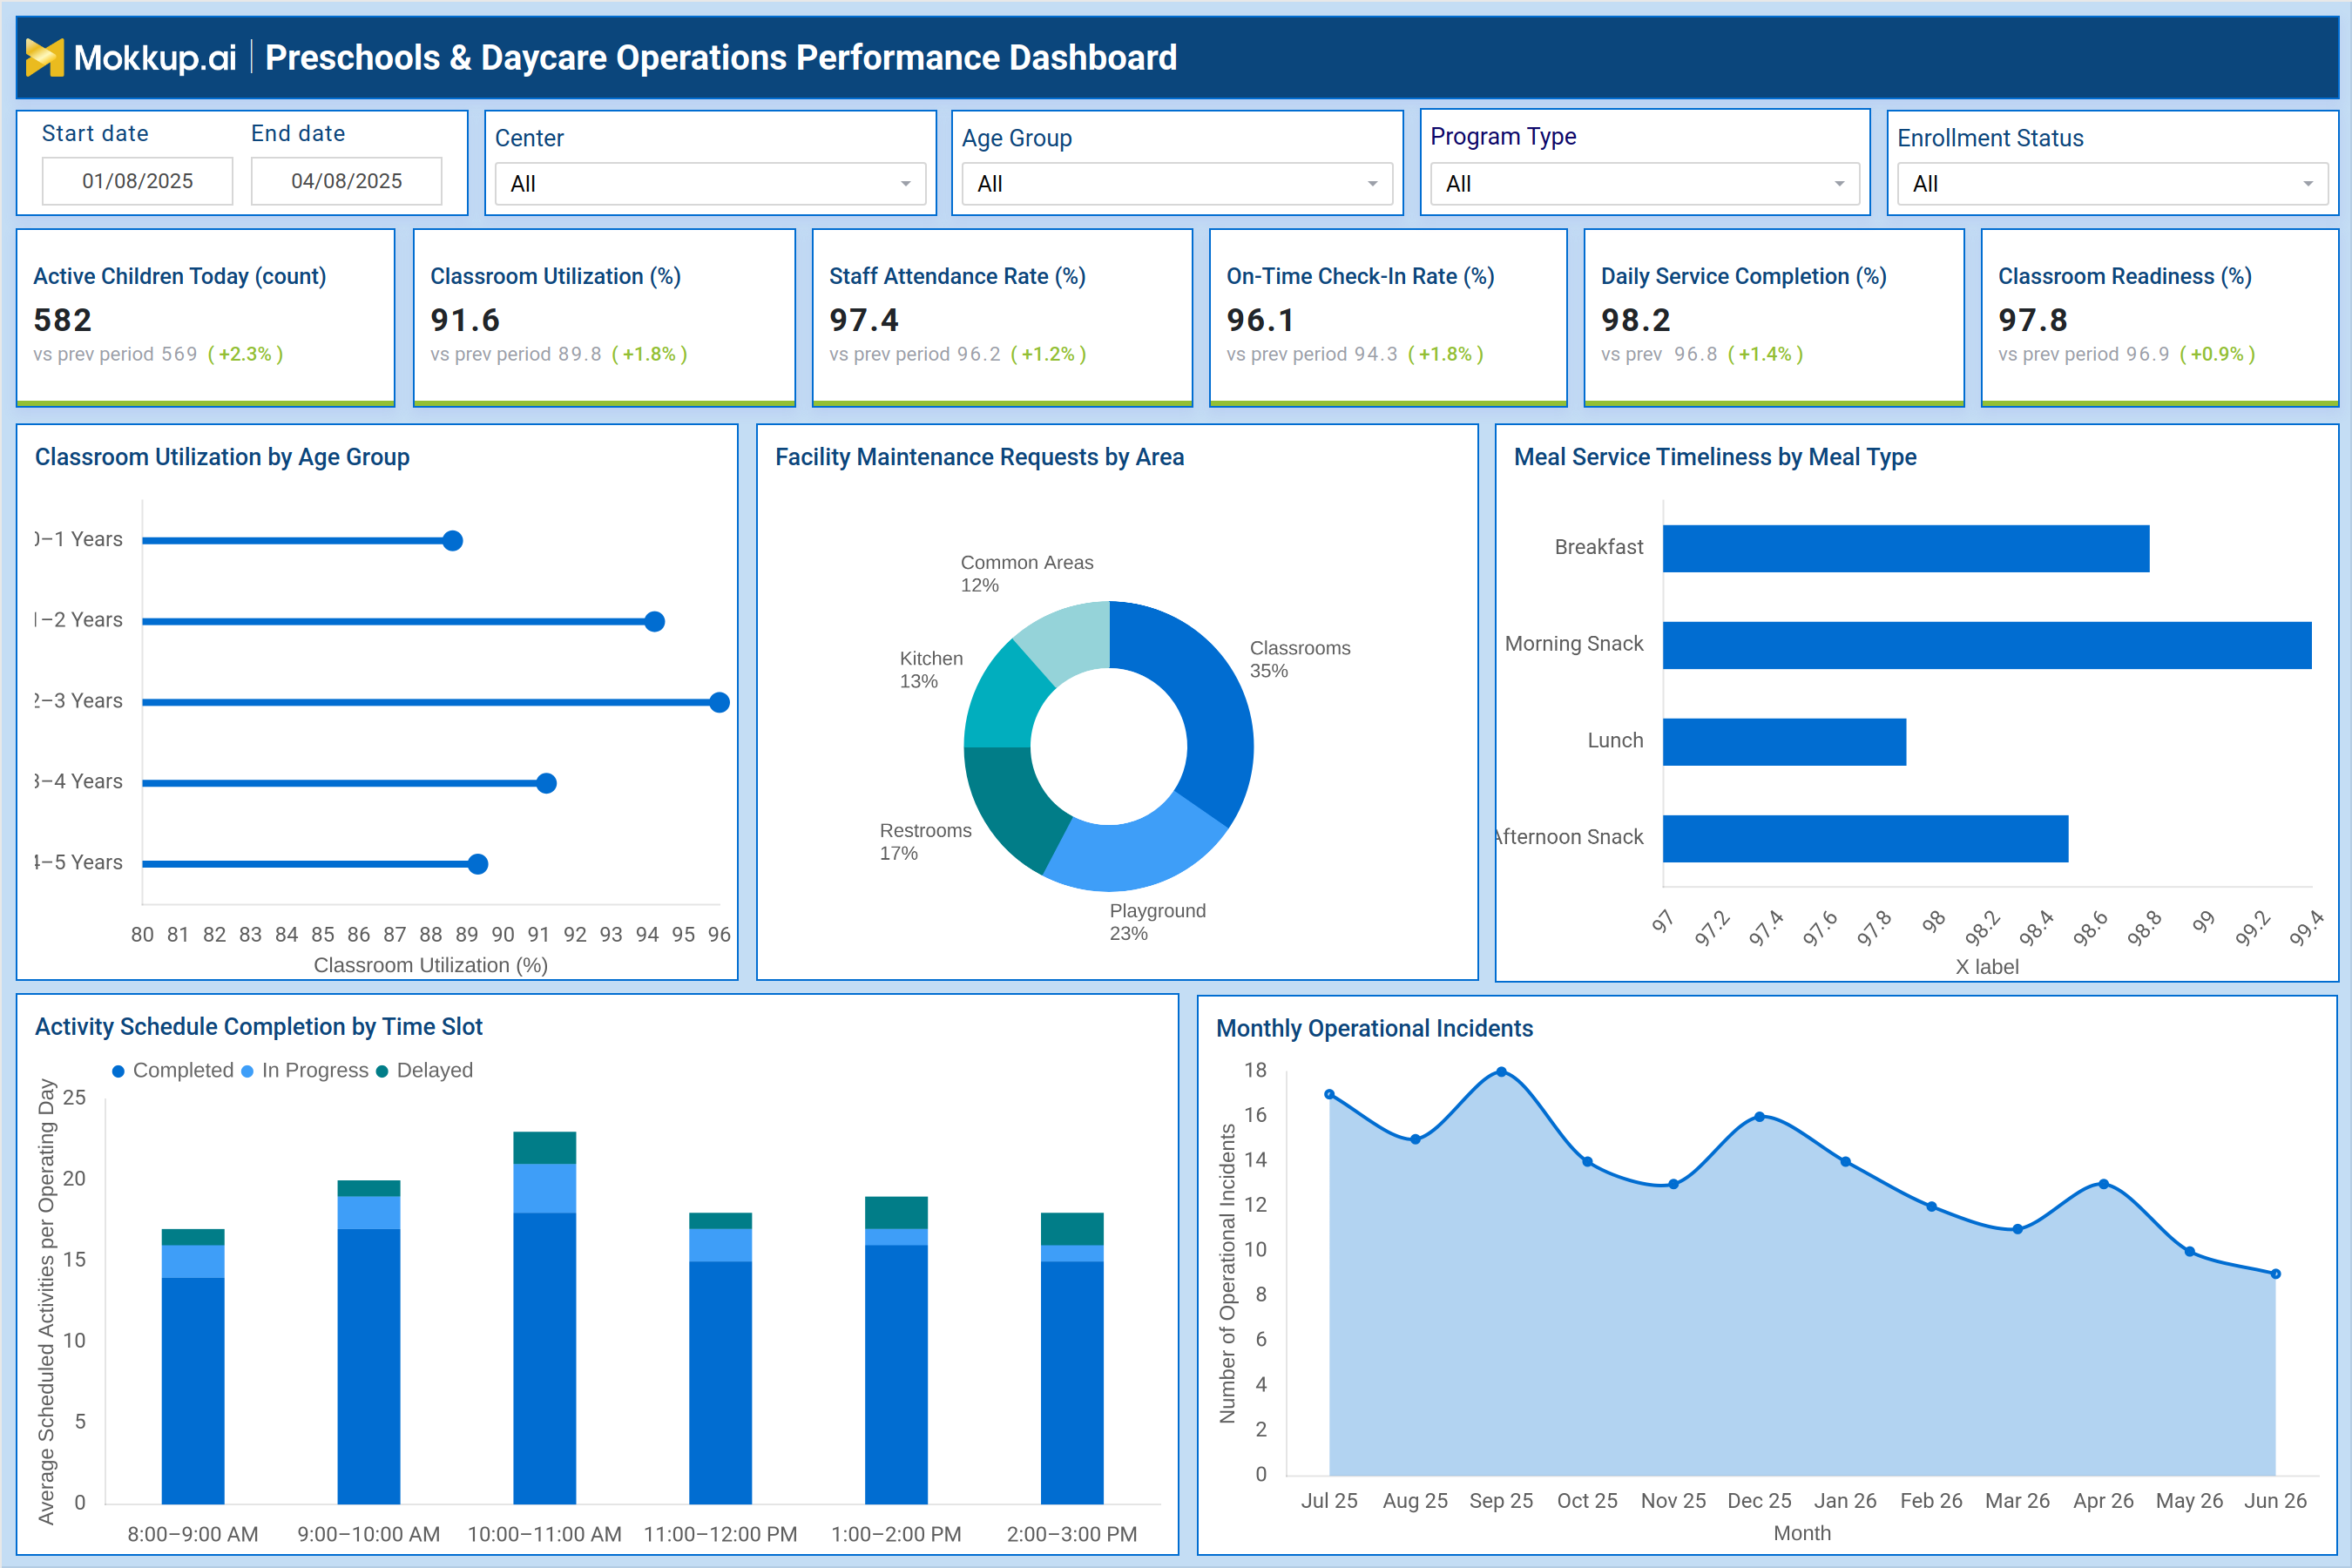
The Preschools & Daycare Operations Performance Dashboard is a wireframe template built for childcare administrators and center directors who need a single view into daily operations across classrooms, staff, and facilities. It supports preschool operations performance tracking by consolidating enrollment, attendance, meal service, and maintenance data into one screen, removing the need to check multiple spreadsheets or systems separately. Filters for date range, center, age group, program type, and enrollment status let administrators narrow the view to a specific location or cohort within seconds. Center directors use it to monitor daycare classroom utilization rate trends across age groups, while also keeping an eye on childcare enrollment and check-in tracking so that staffing and space planning stay aligned with actual attendance patterns throughout the week.
How to Create a Preschools & Daycare Operations Performance Dashboard
You don't need to build your report from scratch, just start with a ready-to-use dashboard template from Mokkup. Add in your data and export it however you like. Here's how to do it:
1. Create or Log in to Your Mokkup Account
Start by signing up on Mokkup.ai using your email. If you already have an account, just log in, and you'll be good to go.
2. Choose and Customize Your Dashboard Template
Find the Preschools & Daycare Operations Performance Dashboard template in the Templates section. Use the drag-and-drop editor to adjust KPIs, edit filters, or add elements based on your data.
3. Export to Your BI Tool
Once your dashboard wireframe is ready, use the BI Tool Export feature to send it directly to Power BI or Tableau for further analysis and enhancements. You can also download the dashboard as a PDF, PNG, or JPEG, embed it on a platform, or invite your team to collaborate.
Note: This is a Pro template. You'll need a Pro subscription on Mokkup to use and customize this dashboard wireframe. Upgrade anytime to unlock full access.
Preschools & Daycare Operations Performance Dashboard Example
A preschool operations manager opens this dashboard each morning to understand how the previous day's centers performed before the current day begins. The question driving this review is simple: are classrooms running at healthy capacity, are staff showing up as scheduled, and are facilities ready for children to arrive? Rather than piecing together answers from separate attendance sheets, maintenance logs, and meal records, the manager gets a consolidated read on center health in one place. From here, managers can identify which age groups are approaching capacity and decide whether a classroom needs an additional aide or a shift in enrollment cutoffs.
They can track how consistently staff are arriving on time and flag centers where attendance patterns suggest scheduling adjustments are needed. When maintenance requests cluster around a particular area, such as playgrounds or restrooms, facilities teams can prioritize daycare facility maintenance requests before they affect daily operations. Meal service timing across breakfast, snack, and lunch periods helps kitchen staff spot slots that consistently run behind schedule, so adjustments can be made to prep timing or staffing during those windows. Looking at how activities are completed, delayed, or still in progress across different time slots, planners can compare which parts of the day need better coordination between staff and classroom schedules.
Combined with a longer view of operational incidents over time, the dashboard helps leadership see whether process changes are reducing disruptions month over month. Altogether, this dashboard gives preschool and daycare operators a way to move from reactive fixes to proactive planning across staffing, facilities, and child care delivery.
How to Analyze Data in a Preschools & Daycare Operations Performance Dashboard
Here is how you can analyze data from this dashboard:
- Analyze specific segments: Filter by center, age group, program type, or enrollment status to evaluate targeted operational performance.
- Optimize classroom capacity: Compare classroom utilization across age groups to identify underused or overcrowded classrooms.
- Prioritize facility maintenance: Review maintenance requests by area to address repairs before they disrupt daily operations.
- Monitor meal service performance: Track meal service timeliness by meal type to identify recurring kitchen delays.
- Evaluate activity schedules: Monitor activity schedule completion by time slot to identify programming that is falling behind.
- Track staff attendance: Compare staff attendance with scheduled shifts to support childcare workforce planning.
- Measure operational improvements: Analyze monthly operational incidents to determine whether corrective actions are reducing issues.
- Compare performance over time: Adjust the date range to evaluate current performance against a previous period.
Benefits of a Preschools & Daycare Operations Performance Dashboard
The following are the benefits of using this dashboard:
- Centralize operational data: Combine classroom, staff, facility, and meal information into a single dashboard.
- Simplify attendance tracking: Monitor childcare staff attendance without manually reconciling attendance logs.
- Manage facility maintenance: Identify daycare maintenance requests early to prevent safety and operational issues.
- Improve enrollment visibility: Track enrollment and check-in patterns across centers and age groups.
- Reduce reporting effort: Eliminate manual reporting by consolidating data from disconnected spreadsheets and systems.
- Enable targeted analysis: Filter by center, age group, and program type to evaluate specific operational segments.
- Monitor operational trends: Track incident trends over time to support consistent performance reviews and decision-making.
KPIs to Track in a Preschools & Daycare Operations Performance Dashboard
The following key KPIs can be tracked by using this dashboard:
- Key Performance Indicators (KPIs) are measurable values that show how effectively an organization is achieving its operational objectives. In this dashboard, KPIs support preschool KPI monitoring across attendance, classroom capacity, and service delivery.
- Active Children Today: the count of children present at centers on a given day, used to gauge daily attendance volume.
- Classroom Utilization: the daycare classroom utilization rate, showing the percentage of classroom capacity in use, which indicates whether space is under- or over-allocated.
- Staff Attendance Rate: the percentage of scheduled staff who report to work, a core measure for childcare center staff attendance monitoring.
- On-Time Check-In Rate: the percentage of children checked in within the expected arrival window, reflecting classroom readiness.
- Daily Service Completion: the percentage of scheduled daily services, such as meals and activities, completed as planned.
- Classroom Readiness: the percentage of classrooms prepared and staffed ahead of the day's start.
Frequently Asked Questions
1. What does the Preschools & Daycare Operations Performance Dashboard track?
It tracks classroom utilization, staff attendance, meal service timeliness, facility maintenance, and daily operational incidents across preschool and daycare centers. Filters for center, age group, program type, and enrollment status allow administrators to narrow the view to a specific segment.
2. Who should use this dashboard?
Preschool and daycare operations managers, center directors, and facilities teams use it for preschool operations performance tracking across multiple locations. It also supports staff handling childcare enrollment and check-in tracking on a daily basis.
3. Can this dashboard be customized for a specific center or program type?
Yes, the template can be edited in Mokkup's drag-and-drop editor to adjust KPIs, filters, and layout based on a center's data. It supports preschool KPI monitoring tailored to different program types and age groups.