
What is a Preschools & Daycare Child Safety Dashboard?
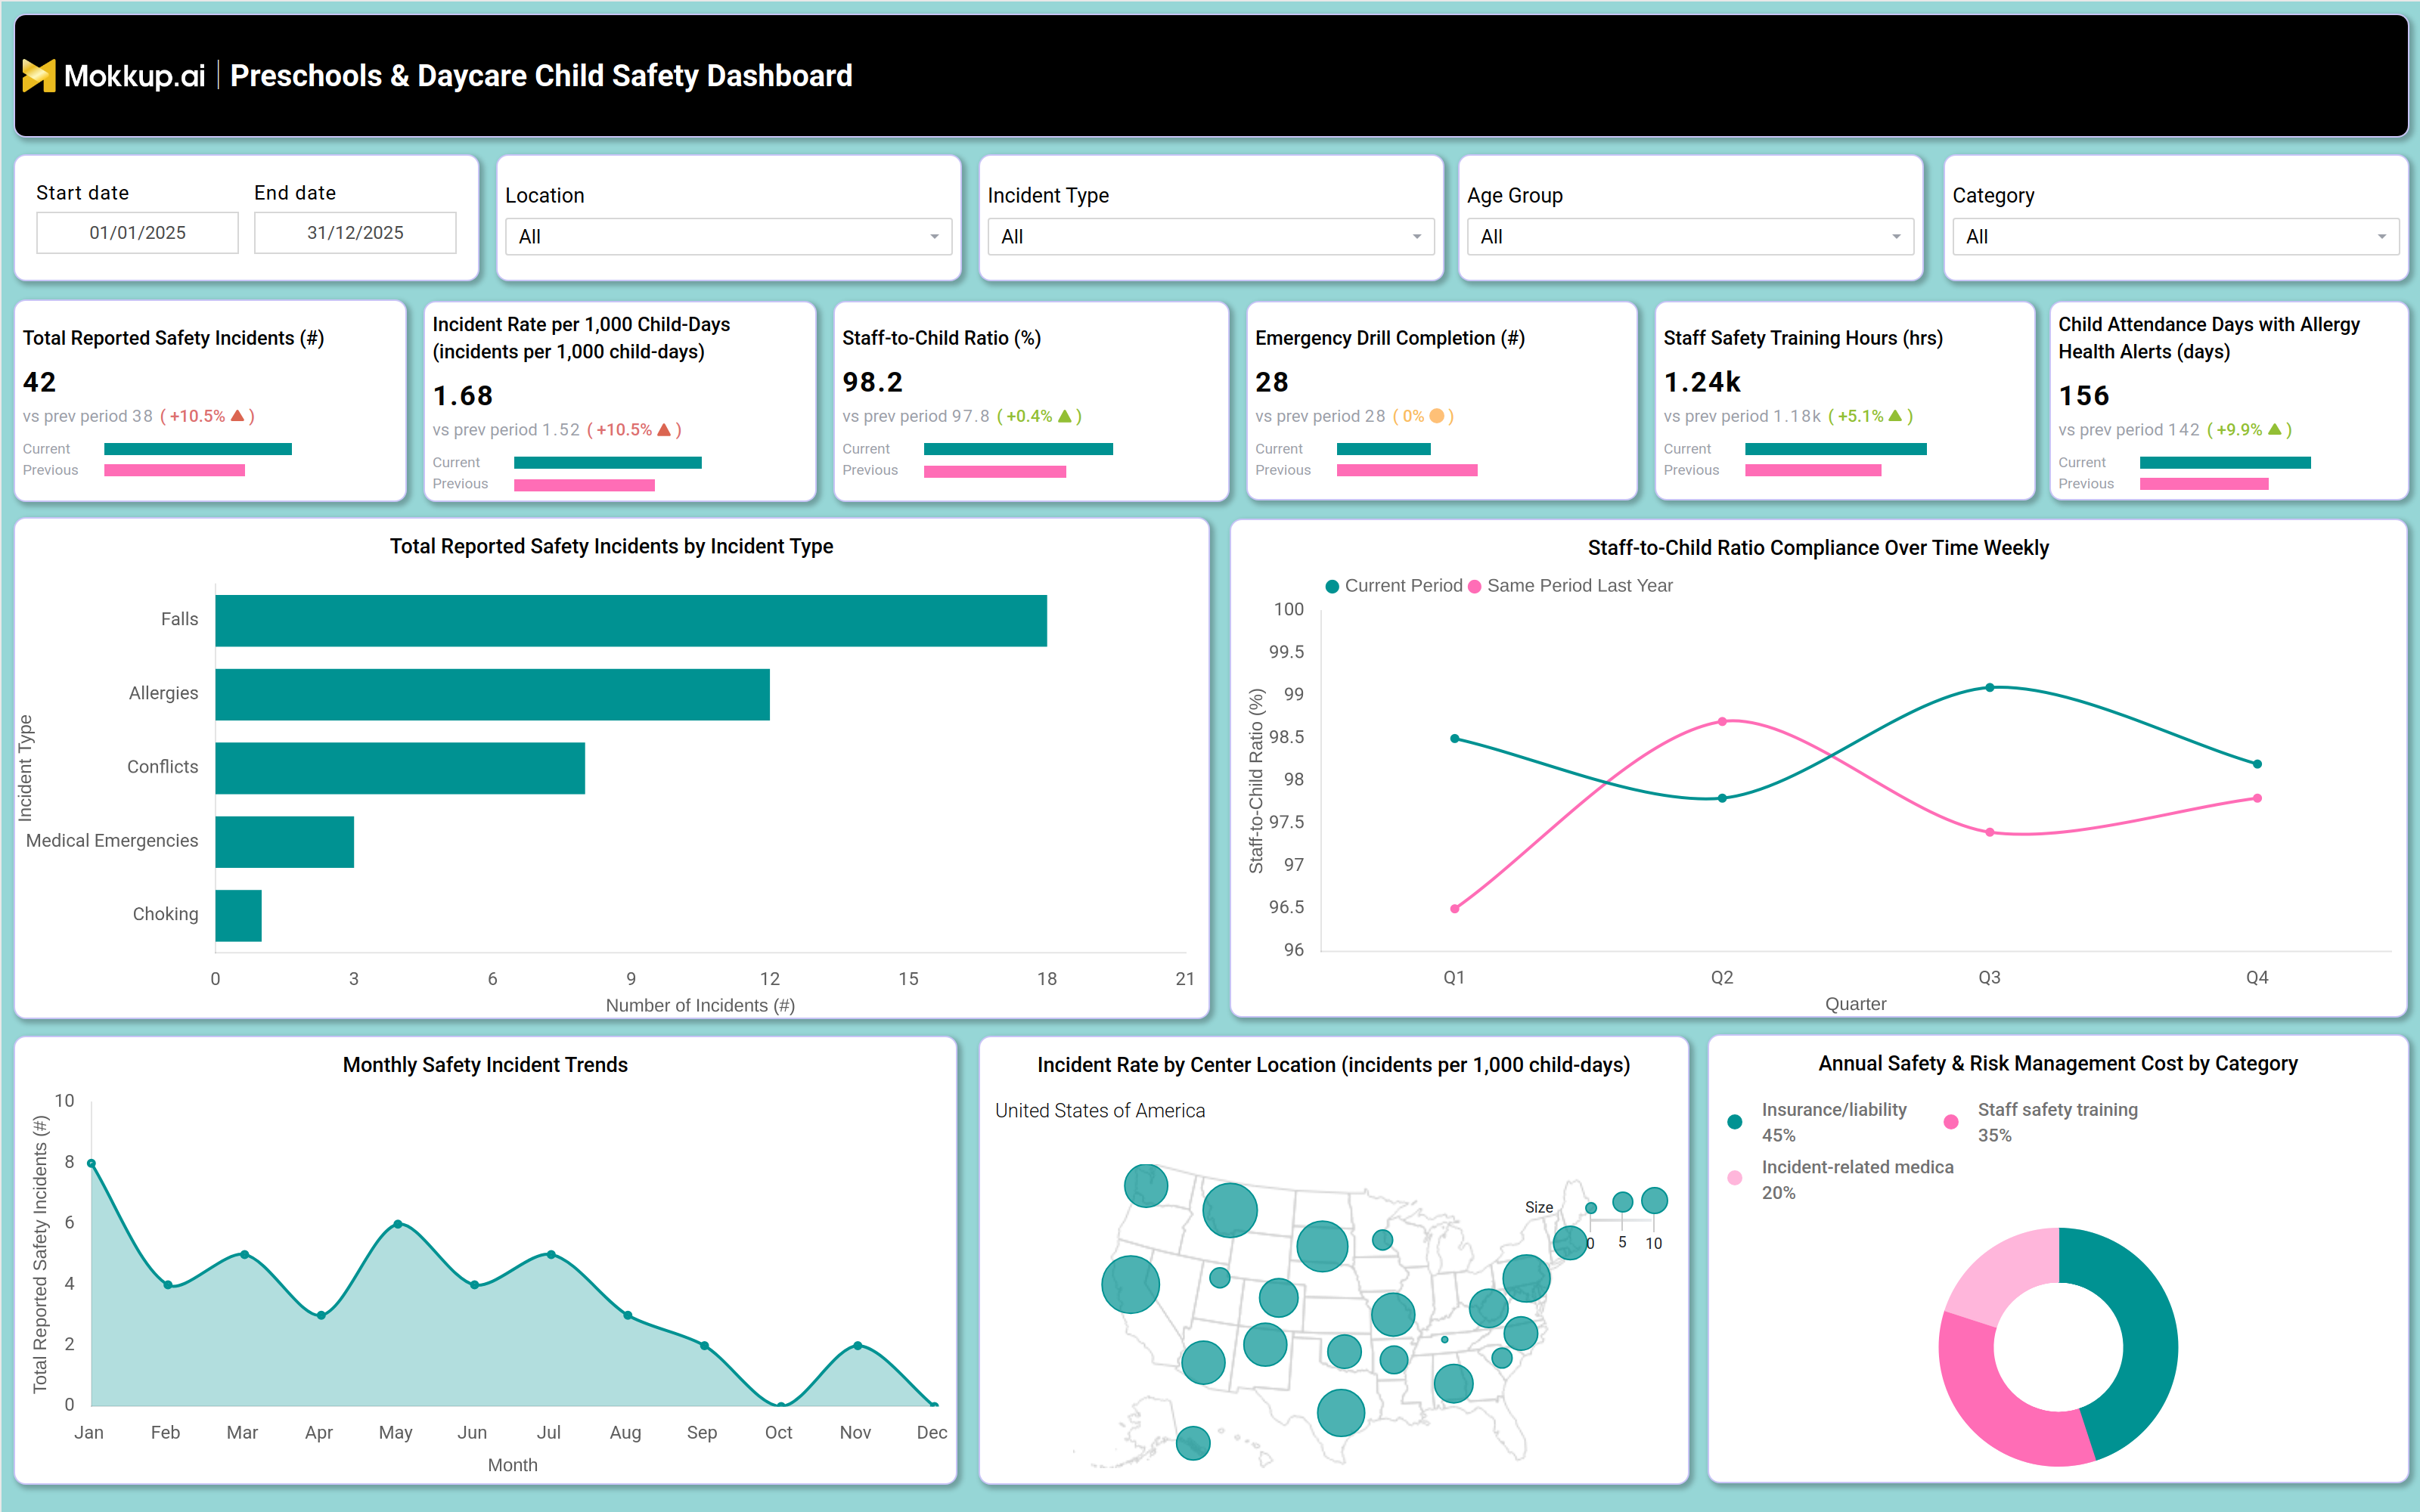
The Preschools & Daycare Child Safety Dashboard is a preschool child safety incident tracking dashboard built for center directors, compliance officers, and childcare operations teams who need visibility into how safe their facilities are for the children in their care. It brings incident logs, staffing ratios, training records, and cost data into a single view so that safety patterns are easy to spot across locations, incident types, and age groups. As a daycare safety compliance dashboard template, it is designed to be customized with an organization's own data rather than built from scratch, saving teams the time typically spent assembling safety reports manually. Filters for date range, location, incident type, age group, and category let users narrow the view to the segment they care about, whether that is a single center or a specific incident type. The dashboard brings together incident counts, staffing metrics, training hours, and cost breakdowns so that safety, operations, and finance stakeholders can work from the same source of information.
How to Create a Preschools & Daycare Child Safety Dashboard
You don't need to build your report from scratch; just start with a ready-to-use dashboard template from Mokkup. Add in your data and export it however you like. Here's how to do it:
1. Create or Log in to Your Mokkup Account
Start by signing up on Mokkup.ai using your email. If you already have an account, just log in, and you'll be good to go.
2. Choose and Customize Your Dashboard Template
Find the Preschools & Daycare Child Safety Dashboard template in the Templates section. Use the drag-and-drop editor to adjust KPIs, edit filters, or add elements based on your data.
3. Export to Your BI Tool
Once your dashboard wireframe is ready, use the BI Tool Export feature to send it directly to Power BI or Tableau for further analysis and enhancements. You can also download the dashboard as a PDF, PNG, or JPEG, embed it on a platform, or invite your team to collaborate.
Note: This is a Pro template. You'll need a Pro subscription on Mokkup to use and customize this dashboard wireframe. Upgrade anytime to unlock full access.
Preschools & Daycare Child Safety Dashboard Example
A preschool operations director opens this dashboard during a monthly safety review to see whether incidents are trending across the network of centers and which locations need closer attention. They set the date range and location filters to match the reporting period, then scan the top of the screen to gauge how the current period compares with the previous one.
From there, teams can identify which incident types contribute most to the overall count and decide whether a category such as falls or allergy-related events needs a targeted response. Compliance officers track staff-to-child ratio monitoring across the reporting period, checking whether dips align with particular quarters or locations, and use that pattern to plan staffing adjustments before ratios slip out of range.
Because the dashboard also tracks emergency drill completion alongside training hours, managers compare how consistently drills are run against how much training staff log, and flag centers where one lags behind the other. Planners also compare incident rates across locations on the map and rely on childcare incident rate reporting to prioritize site visits where activity is elevated. Finance and operations leaders use the dashboard to review how the annual safety and risk management budget splits across insurance, staff training tied to daycare emergency drill compliance tracking, and incident-related costs, helping them justify the next budget cycle.
Together, the dashboard gives childcare organizations one place to monitor safety trends, staffing compliance, and program costs so leadership can act before minor issues become recurring incidents, supporting a broader child safety risk management dashboard template across the network.
How to Analyze Data in a Preschools & Daycare Child Safety Dashboard
Here is how you can analyze data from this dashboard:
- Compare safety performance: Filter by date range and location to evaluate safety metrics across centers or time periods.
- Track incident trends: Review the Total Reported Safety Incidents trend to identify increases or decreases from the previous period.
- Identify common incident types: Use the incident type bar chart to determine which safety issues require immediate attention.
- Monitor staffing compliance: Track staff-to-child ratios using the weekly ratio chart to ensure compliance with staffing requirements.
- Detect seasonal patterns: Compare monthly safety incident trends to identify recurring spikes in falls, allergies, or conflicts.
- Prioritize high-risk locations: Use the incident rate by location map to identify centers that need site visits or additional support.
- Benchmark center safety: Use childcare incident rate reporting to compare centers based on incidents per child-day.
- Review safety-related costs: Analyze the cost breakdown chart to understand spending across insurance, training, and incident-related expenses.
- Analyze age-specific trends: Segment data by age group and incident category to uncover patterns affecting specific child populations.
Benefits of a Preschools & Daycare Child Safety Dashboard
The following are the benefits of using this dashboard:
- Centralize safety data: Combine incident, staffing, training, and cost metrics into a single daycare safety compliance dashboard.
- Reduce reporting effort: Replace spreadsheet-based reporting with a ready-to-use dashboard template.
- Improve staffing compliance: Monitor staff-to-child ratios to identify compliance gaps before they become violations.
- Simplify incident reporting: Generate childcare incident reports more efficiently for leadership and regulatory bodies.
- Support safety preparedness: Track safety training and daycare emergency drill compliance across centers.
- Compare center performance: Evaluate safety metrics consistently across multiple preschool or daycare locations.
- Monitor safety spending: Give finance teams visibility into safety and risk management costs by category.
- Strengthen risk management: Standardize child safety monitoring with a comprehensive risk management dashboard template.
KPIs to Track in a Preschools & Daycare Child Safety Dashboard
The following key KPIs can be tracked by using this dashboard:
- Total Reported Safety Incidents: total count of safety-related incidents recorded in the selected period.
- Incident Rate per 1,000 Child-Days: normalizes incident volume against attendance for fair comparison across centers.
- Staff-to-Child Ratio: supports staff-to-child ratio monitoring by measuring whether staffing levels meet required supervision standards.
- Emergency Drill Completion: tracks the number of emergency drills completed, supporting daycare emergency drill compliance tracking.
- Staff Safety Training Hours: measures the total hours staff have spent on safety training.
- Child Attendance Days with Allergy Health Alerts: tracks attendance days flagged with allergy-related health alerts.
- Annual Safety & Risk Management Cost: total annual expenditure on safety programs, insurance, training, and incident-related costs.
Frequently Asked Questions
1. What is the purpose of a Preschools & Daycare Child Safety Dashboard?
It gives childcare directors and compliance teams a single view of incident trends, staffing ratios, training compliance, and safety costs. This preschool child safety incident tracking dashboard replaces manual spreadsheets with one consolidated report.
2. How does this dashboard help track staffing compliance?
It monitors staff-to-child ratios every week and compares them against the same period last year, making compliance dips easy to spot. Teams can filter by location to see where ratios need correction.
3. Can this dashboard template be customized for multiple daycare locations?
Yes, filters for location, incident type, age group, and category let teams adjust the view for a single center or an entire network. As a daycare safety compliance dashboard template, it can be customized with an organization's own data in Mokkup before export.