
What is a Nuclear Power Plant Core Safety & Monitoring Dashboard?
A Nuclear Power Plant Core Safety & Monitoring Dashboard is a real-time digital monitoring system that consolidates all critical plant safety parameters into one interface. It provides continuous nuclear power plant safety monitoring by tracking core temperature stability, coolant flow performance, radiation levels, alarm conditions, and emergency preparedness indicators. The dashboard uses operational data from all major reactor systems to detect anomalies early and support safe, uninterrupted operations. By integrating reactor coolant flow analysis, reactor core performance tracking, and radiation metrics, the dashboard allows operators to make faster and more informed responses. It also serves as a complete nuclear facility operational safety dashboard, offering plant teams an integrated view of system health, incident patterns, emergency readiness, and corrective actions.
How to Create a Nuclear Power Plant Core Safety & Monitoring Dashboard
You don’t need to build your report from scratch—just start with a ready-to-use dashboard template from Mokkup. Add in your data and export it however you like. Here’s how to do it:
1. Create or Log in to Your Mokkup Account
Start by signing up on Mokkup.ai using your email. If you already have an account, just log in, and you’ll be good to go.
2. Choose and Customize Your Dashboard Template
Find the Nuclear Power Plant Core Safety & Monitoring Dashboard template in the Templates section. Use the drag-and-drop editor to adjust KPIs, edit filters, or add elements based on your data.
3. Export to Your BI Tool
Once your dashboard wireframe is ready, use the BI Tool Export feature to send it directly to Power BI or Tableau for further analysis and enhancements. You can also download the dashboard as a PDF, PNG, or JPEG, embed it on a platform, or invite your team to collaborate.
Note: This is a Pro template. You’ll need a Pro subscription on Mokkup to use and customize this dashboard wireframe. Upgrade anytime to unlock full access.
Nuclear Power Plant Core Safety & Monitoring Dashboard Example
You can create a Nuclear Power Plant Core Safety & Monitoring Dashboard that visualizes both emergency response performance and reactor system health using the two dashboards shown above. The Emergency Preparedness & Incident Monitoring dashboard focuses on response readiness, monthly incident counts, alarm response time trends, and INES incident classifications. It also covers drill performance, backup system readiness, and corrective action tracking—helping teams manage operational risks and respond quickly to deviations.
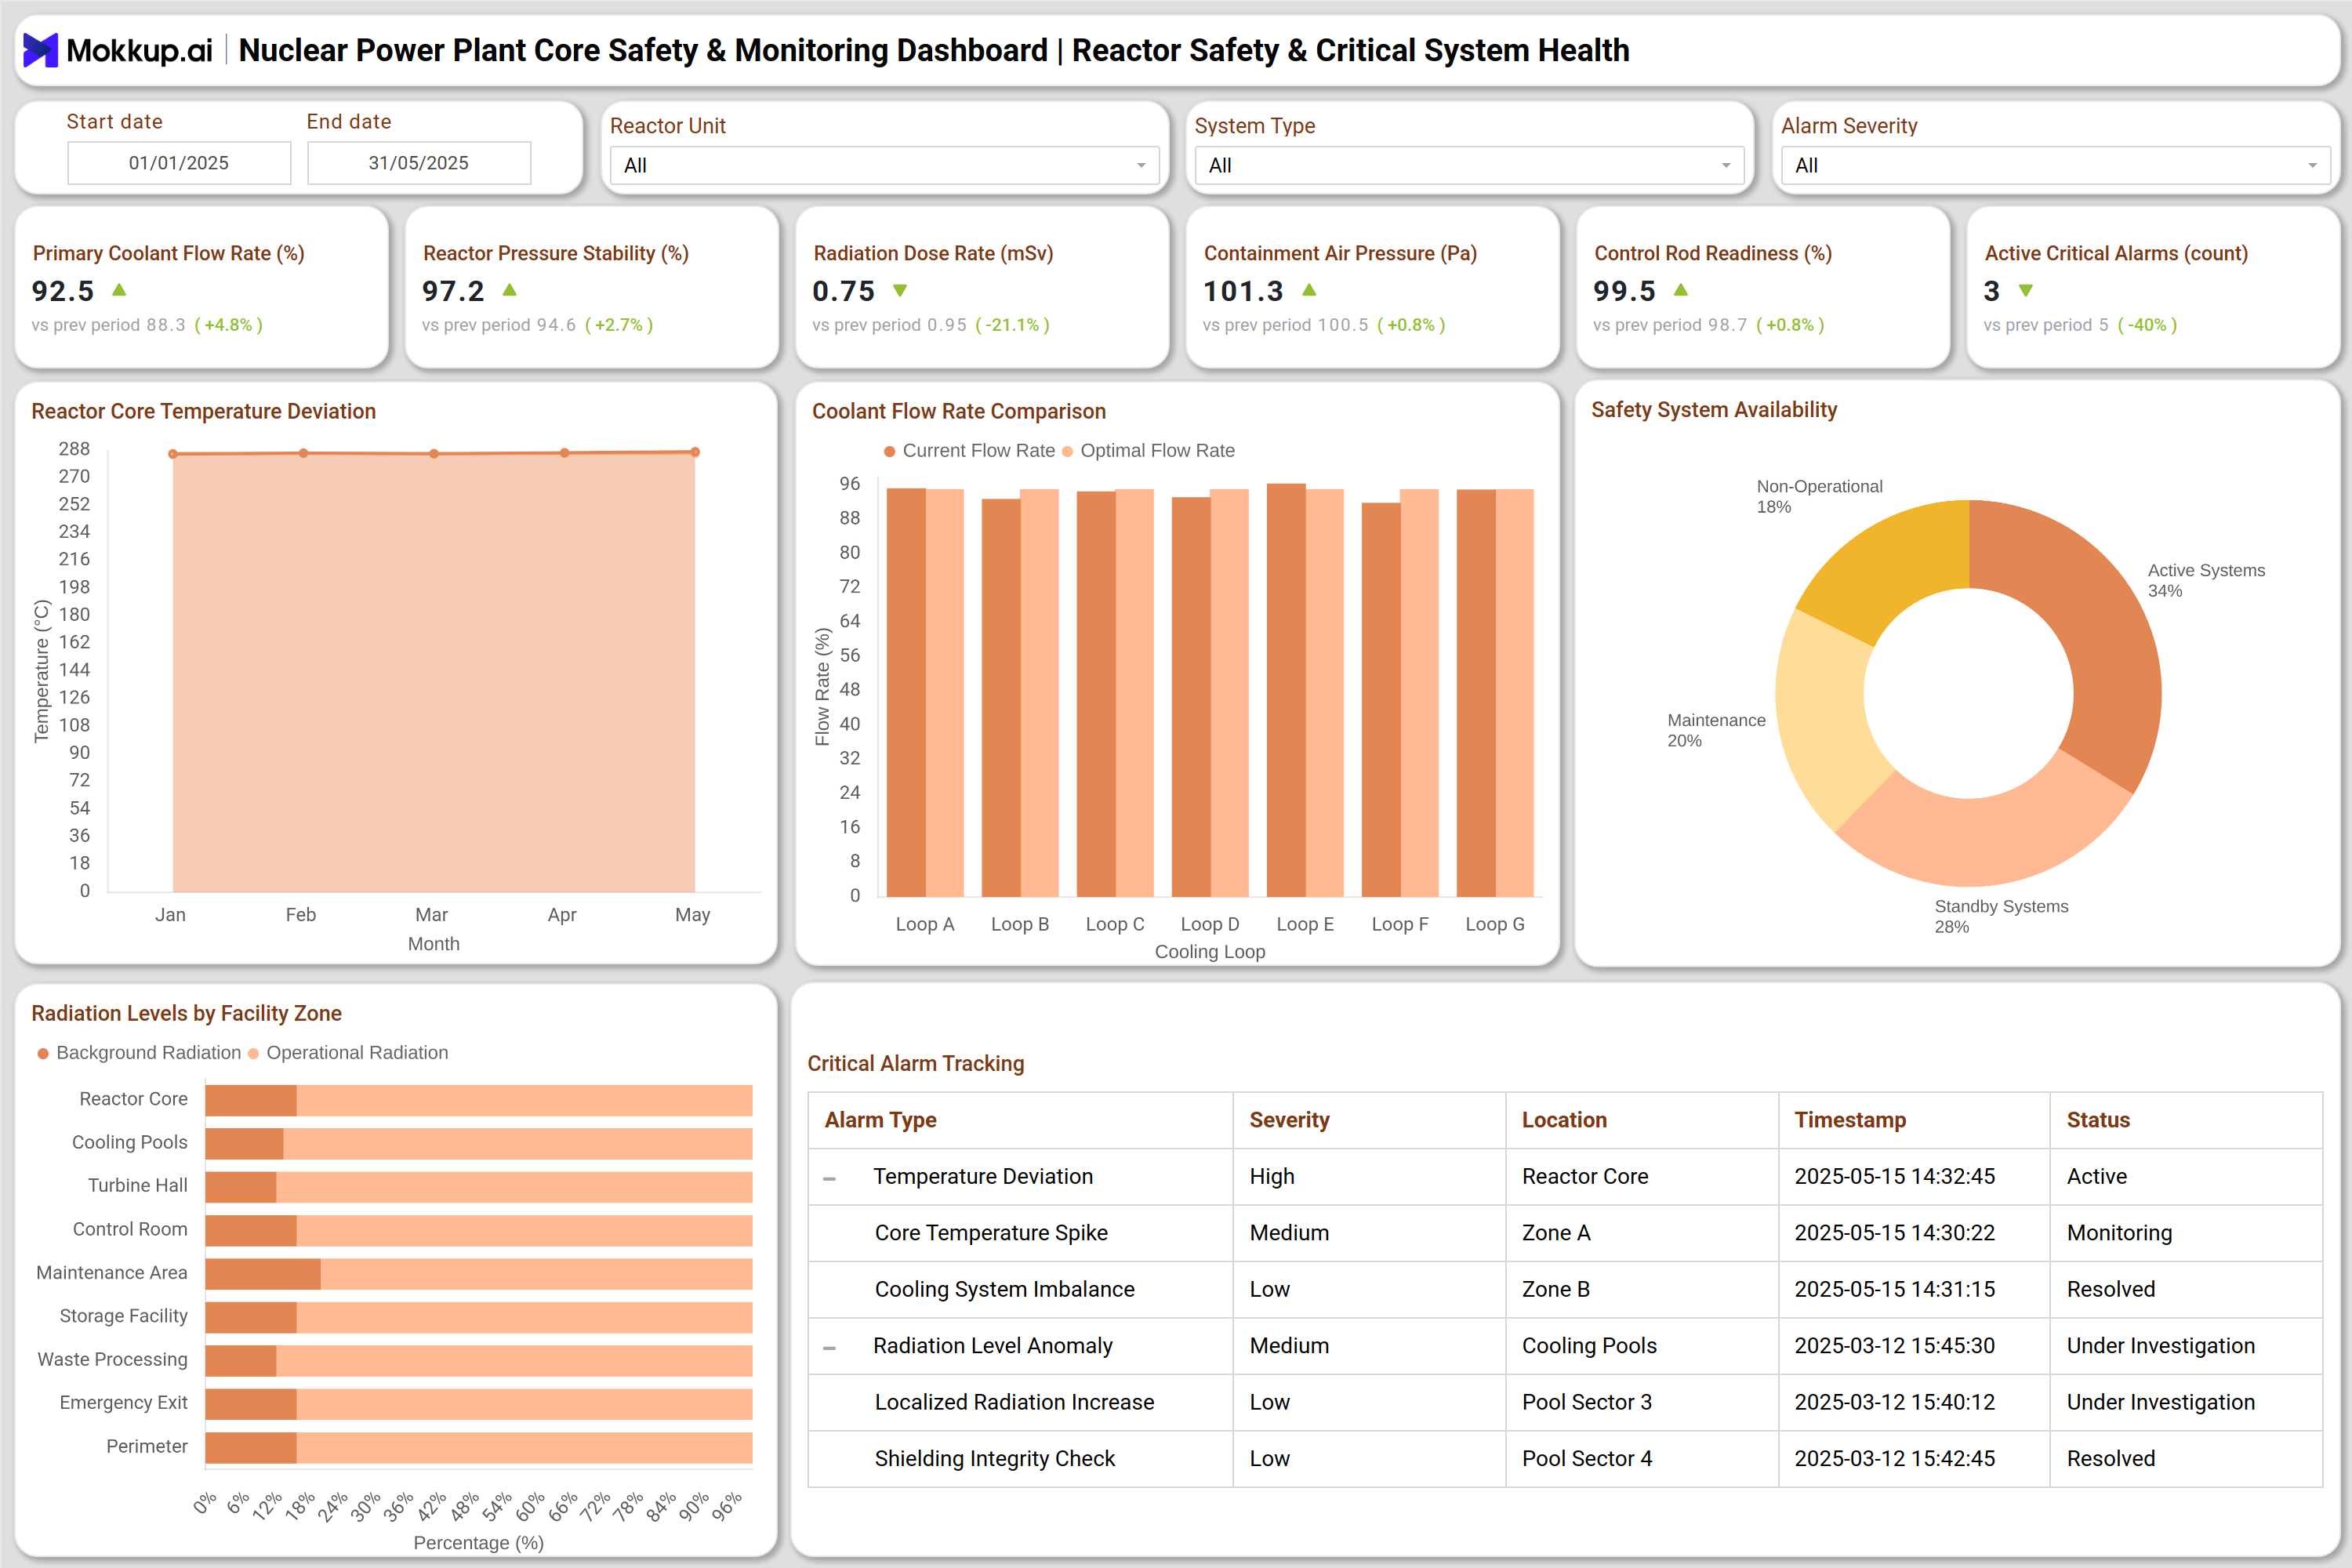
The Reactor Safety & Critical System Health dashboard expands this by tracking core temperature deviations, coolant flow comparisons, radiation dose rates, containment pressure, and safety system availability. These visualizations offer a complete view of the nuclear plant radiation level dashboard and nuclear core temperature monitoring system. Together, these dashboards enable continuous surveillance of reactor stability, radiation safety, and emergency preparedness, ensuring safe performance across all critical systems.
How to Analyze Data in a Nuclear Power Plant Core Safety & Monitoring Dashboard
Here’s how to get the most out of a core-safety dashboard:
- Track Coolant Flow Stability: Compare actual coolant flow against optimal ranges to spot early thermal imbalance.
- Monitor Core Temperature Patterns: Watch deviation charts for abnormal rises, hotspots, or sudden spikes that signal potential reactivity issues.
- Review Radiation Dose Distribution: Check monthly dose rates across zones to catch unsafe exposure trends and evaluate shielding effectiveness.
- Analyze Incident Trends: Study operational incidents and their INES classifications to understand recurring risk areas.
- Evaluate Emergency Drill Readiness: Look at drill timings, system response data, and completion scores to assess how prepared teams are for real events.
- Check Backup System Availability: Use redundancy charts to identify reductions in standby systems or weakening fail-safe layers.
- Assess Corrective Action Closure: Review logs to confirm whether safety-critical issues were resolved on time and whether similar events are repeating.
Benefits of a Nuclear Power Plant Core Safety & Monitoring Dashboard
Here’s what a core-safety dashboard brings to the table:
- Enables Real-Time Reactor Oversight: Gives teams continuous visibility into all critical reactor systems and safety parameters.
- Improves Operational Decision-Making: Unifies core performance metrics so engineers can act on accurate, system-wide insights.
- Detects Safety Anomalies Early: Uses automated alerts and response-time analytics to flag unusual patterns before they escalate.
- Enhances Emergency Preparedness: Tracks drills, backup availability, and incident workflows to strengthen overall safety readiness.
- Supports Regulatory Compliance: Provides structured radiation-level reporting that simplifies audits and documentation.
- Reduces Operational Risk: Integrates alarm severity, equipment status, and critical system health to minimize safety gaps.
- Gives a Complete Facility Safety View: Offers a single operational dashboard that helps plant teams and regulators stay aligned on safety priorities.
KPIs to Track in a Nuclear Power Plant Core Safety & Monitoring Dashboard
- Primary Coolant Flow Rate (%) – Measures circulation efficiency across cooling loops.
- Reactor Pressure Stability (%) – Indicates reactor pressure consistency under operation.
- Radiation Dose Rate (mSv) – Tracks worker and zone-level radiation exposure.
- Containment Air Pressure (Pa) – Monitors containment integrity and leak prevention.
- Control Rod Readiness (%) – Shows the availability of rods for reactivity control.
- Active Critical Alarms (count) – Displays current unresolved high-severity alarms.
- Core Temperature Deviation (°C) – Measures deviation from optimal core temperature.
- Coolant Flow Rate vs Optimal (%) – Compares actual vs expected coolant performance.
- Radiation Levels by Facility Zone (%) – Assesses radiation distribution across zones.
- Safety System Availability (%) – Tracks operational, standby, and maintenance status.
- Incident Counts by INES Level – Categorizes events by standardized severity scale.
- Alarm Response Time (s) – Measures team responsiveness to critical system alerts.
- Backup System Readiness (%) – Shows availability of pumps, UPS, and diesel generators.
Frequently Asked Questions
1. Why is a core safety dashboard important in nuclear plants?
It centralizes key metrics such as radiation levels, coolant flow, and core temperature to ensure safe and stable operation.
2. How often is the safety data updated?
Data is typically refreshed in real time or at high-frequency intervals depending on plant configuration.
3. Can this dashboard detect early system failures?
Yes, it helps identify early warning signs through trends and thresholds in temperature, coolant flow, and alarm frequency.
4. Does it support regulatory reporting?
Yes, the dashboard includes radiation, incident, and safety logs aligned with compliance needs.