
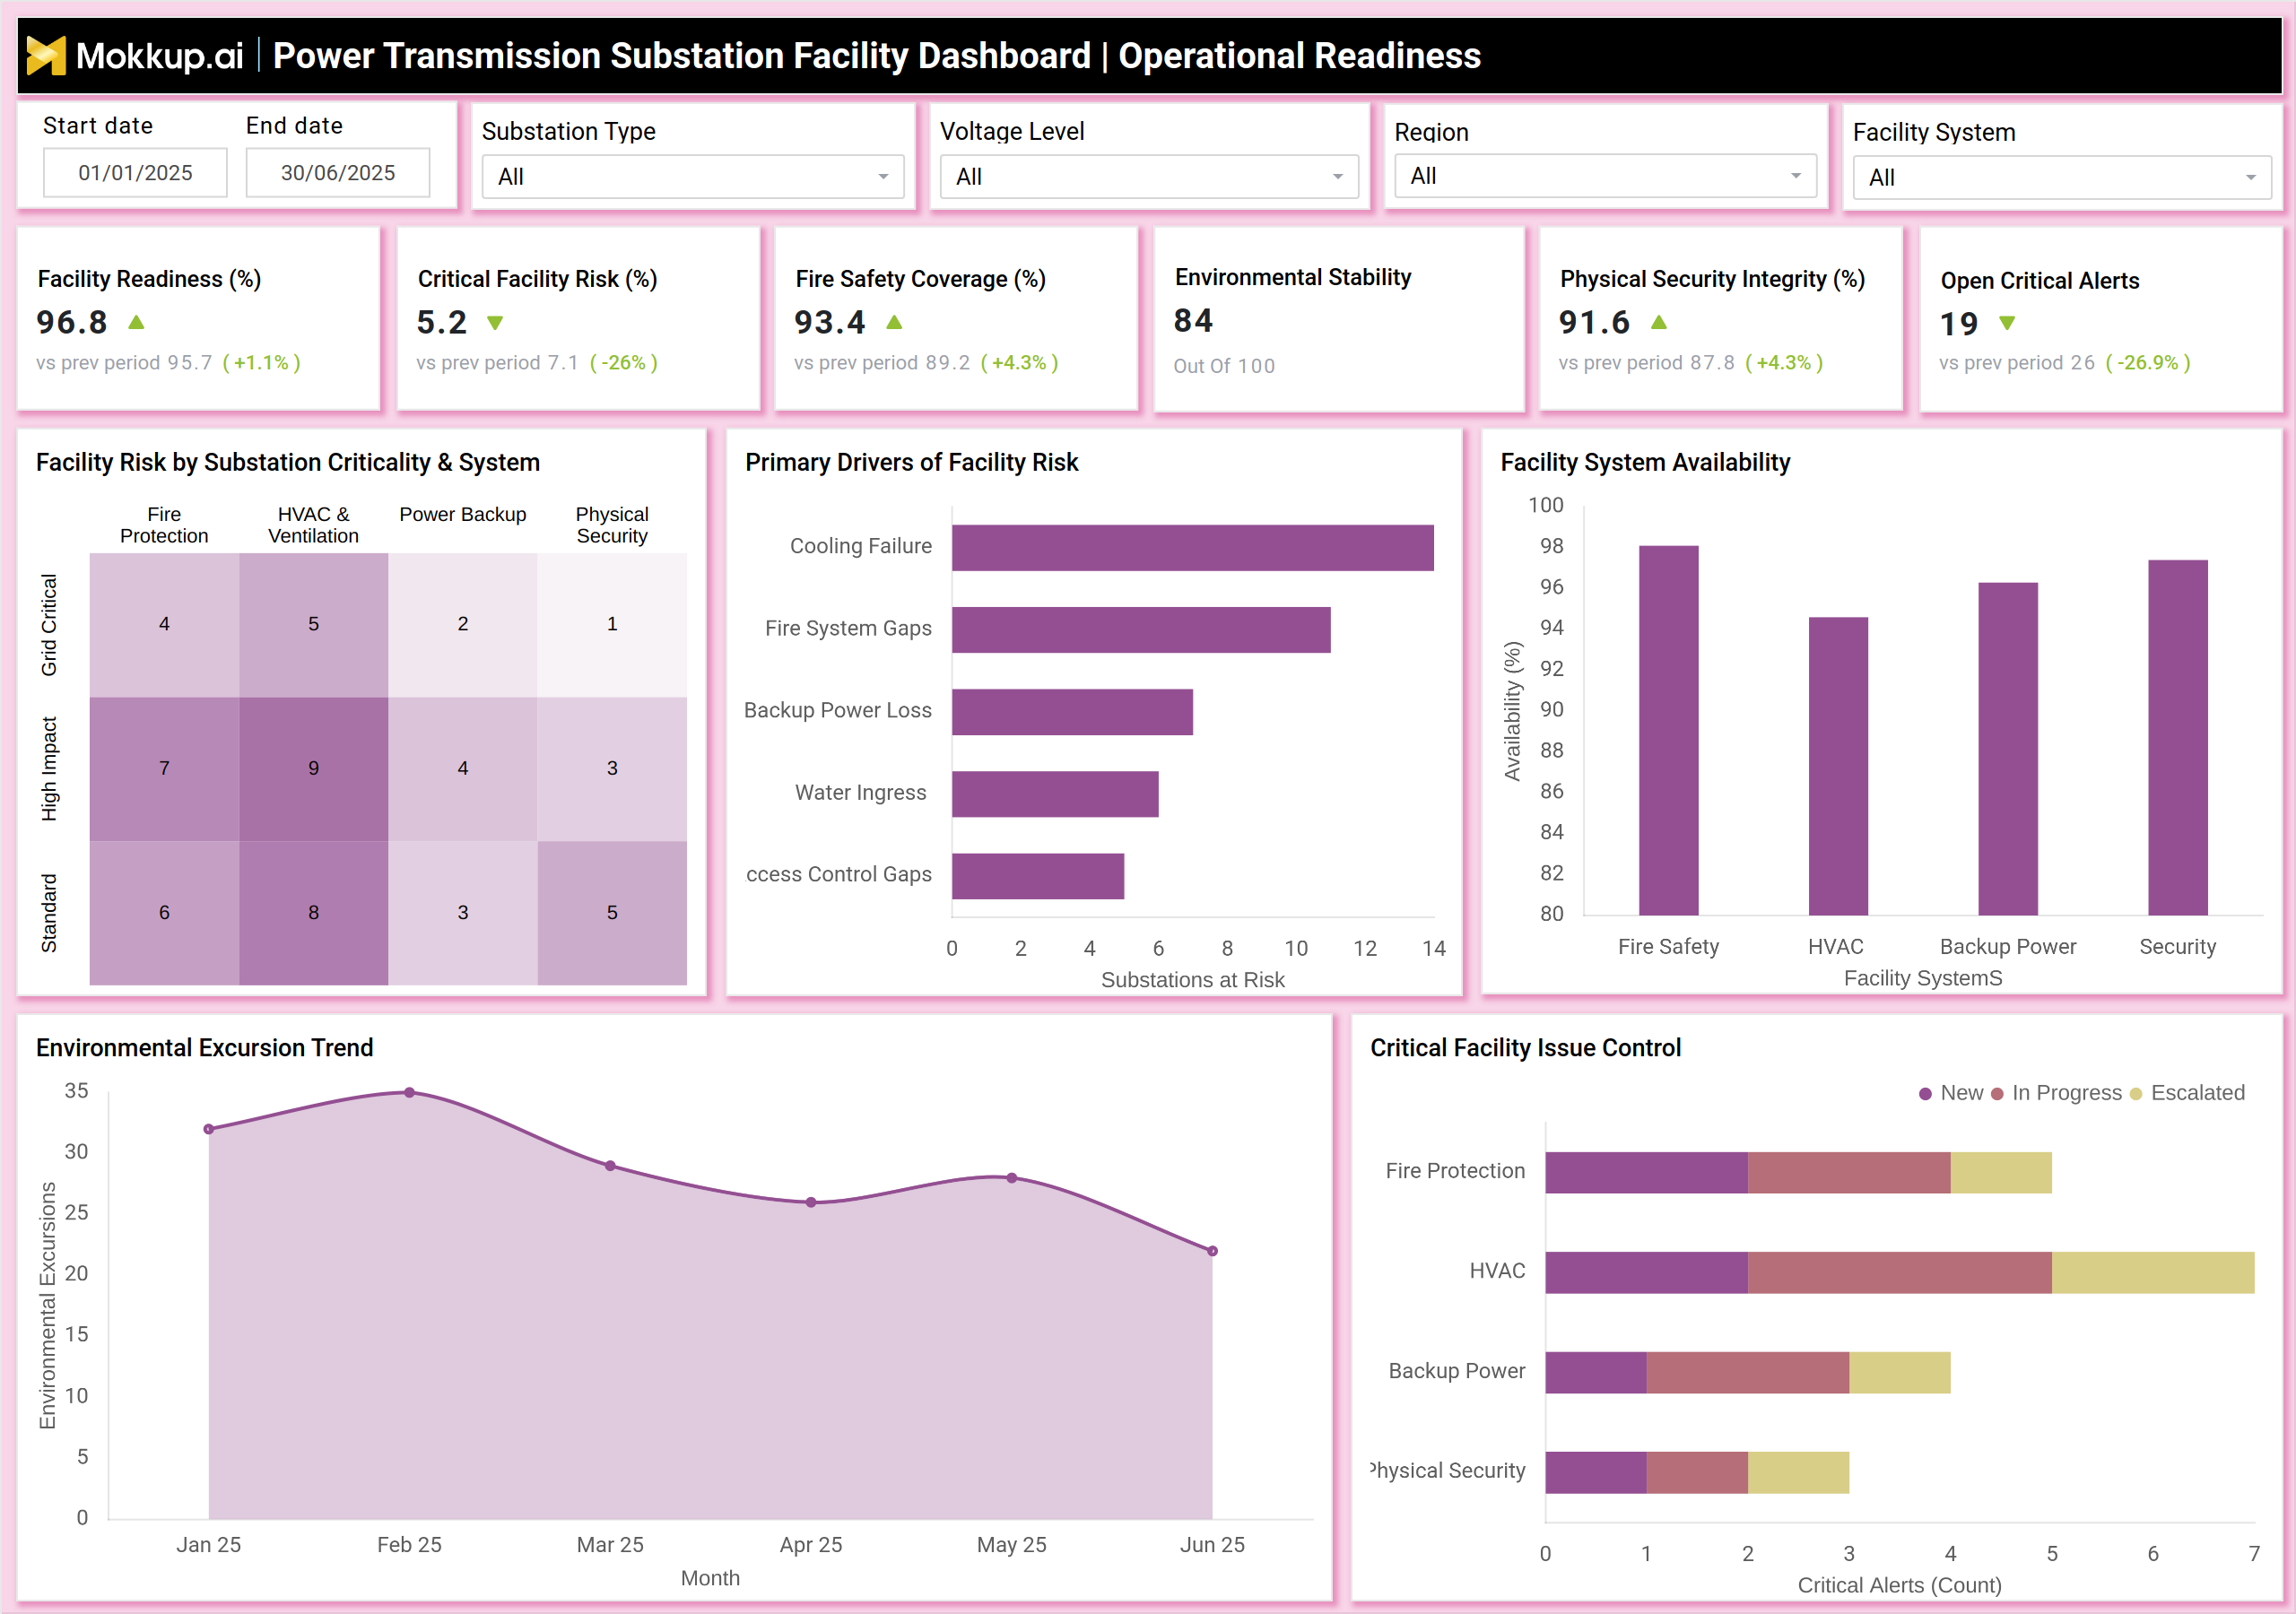
What is a Power Transmission Substation Facility Dashboard?
A power transmission substation facility dashboard is a centralized analytics layer used by transmission utilities to monitor operational readiness, infrastructure health, safety coverage, and asset reliability. It connects data from SCADA, IoT sensors, maintenance systems, and security platforms to provide historical performance visibility. Teams use it to understand risk exposure, prioritize maintenance, reduce outages, and maintain compliance across high-voltage environments. The dashboard works as a transmission substation performance monitoring dashboard by converting complex operational signals into measurable KPIs. Instead of reviewing disconnected reports, operators, planners, and reliability engineers get a single view of availability, open alerts, environmental stability, and system integrity. This improves response time and supports evidence-based decisions. It also functions as a grid substation asset health monitoring system. By tracking degradation, repeat failures, backlog risk, and preventive maintenance compliance, utilities can move from reactive repair to predictive reliability management.
How to Create a Power Transmission Substation Facility Dashboard
You don’t need to build your report from scratch, just start with a ready-to-use dashboard template from Mokkup. Add in your data and export it however you like. Here’s how to do it:
1. Create or Log in to Your Mokkup Account
Start by signing up on Mokkup.ai using your email. If you already have an account, just log in, and you’ll be good to go.
2. Choose and Customize Your Dashboard Template
Find the Power Transmission Substation Facility Dashboard template in the Templates section. Use the drag-and-drop editor to adjust KPIs, edit filters, or add elements based on your data.
3. Export to Your BI Tool
Once your dashboard wireframe is ready, use the BI Tool Export feature to send it directly to Power BI or Tableau for further analysis and enhancements. You can also download the dashboard as a PDF, PNG, or JPEG, embed it on a platform, or invite your team to collaborate.
Note: This is a Pro template. You’ll need a Pro subscription on Mokkup to use and customize this dashboard wireframe. Upgrade anytime to unlock full access.
Power Transmission Substation Facility Dashboard Example
A practical example can be seen in a control environment where managers start the day reviewing facility readiness, critical risk levels, and open alerts. The high voltage substation operations dashboard highlights whether fire protection, HVAC, backup power, and physical security are performing within acceptable thresholds. If coverage drops or environmental excursions rise, teams can immediately identify the affected region or voltage class. In the maintenance view, planners analyze asset condition by age band, preventive versus predictive compliance, and resolution cycle times. A spike in repeat issues or deferred risk signals funding or workforce gaps. This structure turns the interface into a substation maintenance and outage tracking dashboard, where the connection between equipment condition and reliability outcomes is clear. Leadership uses the same environment as a transmission network reliability KPI dashboard, ensuring operational, engineering, and financial priorities remain aligned.
How to Analyze Data in the Power Transmission Substation Facility Dashboard
Here is how you can analyze data from this dashboard:
- Assess Facility Readiness and Availability: Confirm overall operational stability by reviewing facility readiness and uptime indicators.
- Review Critical Risk Percentages: Understand risk exposure across systems to identify high-risk areas requiring immediate attention.
- Compare Safety and Infrastructure Coverage: Evaluate fire safety, HVAC, backup power, and security systems to uncover weak or insufficient coverage.
- Track Open Alerts and Escalations: Monitor alert volumes and escalation categories to prioritize incident response and resource allocation.
- Examine Environmental Excursion Trends: Identify cooling, humidity, or sealing issues that may impact facility conditions.
- Analyze Key Risk Drivers: Investigate underlying causes, such as cooling failure or water ingress, contributing to risk levels.
- Validate Maintenance Compliance Trends: Track preventive and statutory maintenance adherence to ensure regulatory and operational compliance.
- Investigate Repeat Incidents: Identify recurring issues to uncover chronic asset behavior and prevent future failures.
- Study Resolution Time Distribution: Evaluate workforce efficiency by analyzing how quickly incidents are resolved.
- Correlate Asset Age with Condition Scores: Use asset age and condition insights to guide capital planning and replacement strategies.
Benefits of Power Transmission Substation Facility Dashboard
The following are the benefits of using this dashboard:
- Create Substation Visibility: Gain centralized visibility across geographically dispersed substations for consistent monitoring and control.
- Reduce Unplanned Outages: Identify risks early to prevent failures and maintain reliable power delivery.
- Support Predictive Maintenance: Use condition and trend analytics to anticipate issues and schedule maintenance proactively.
- Improve Safety and Regulatory Readiness: Track safety metrics and compliance indicators to meet regulatory requirements.
- Align Cross-Functional Teams: Bring operations, maintenance, and asset management teams onto a shared performance view.
- Speed Incident Triage: Prioritize alerts based on risk and severity to accelerate response times.
- Enable Data-Driven Budget Allocation: Allocate budgets based on asset condition and risk exposure.
- Strengthen Audit Transparency: Support audits with measurable KPIs and documented performance.
- Minimize Repeat Failures: Track root causes to prevent recurring incidents.
- Provide a Reliability Baseline: Establish consistent reliability benchmarks for leadership and planning.
KPIs to Track in Electric Power Distribution Asset Performance & Reliability Dashboard
The following key KPIs can be tracked by using this dashboard:
- Facility readiness percentage – Measures how prepared a site is to operate without restriction based on safety, environment, and support systems.
- Critical facility risk – Indicates the probability that infrastructure conditions could disrupt transmission operations.
- Fire safety coverage – Tracks inspection status and protection readiness across detection and suppression assets.
- Environmental stability index – Reflects temperature, humidity, and contamination control required for equipment life.
- Physical security integrity – Measures access control, surveillance, and perimeter effectiveness.
- Open critical alerts – Shows unresolved high-priority issues that require immediate action.
- System availability by facility type – Evaluates uptime performance for HVAC, backup power, and protection systems.
- Preventive maintenance compliance – Percentage of scheduled activities completed within the approved window.
- Predictive maintenance compliance – Tracks execution of condition-based recommendations.
- Maintenance backlog risk – Quantifies accumulated overdue work and its reliability impact.
- Average resolution time – Mean duration required to close incidents from detection to recovery.
- Repeat issue rate – Identifies recurring failures that indicate ineffective fixes.
- Deferred infrastructure risk – Highlights exposure created by postponed upgrades or renewals.
- Asset condition by age – Connects lifecycle stage with performance degradation.
- Escalated incident count – Number of issues that moved beyond local handling to higher authority.
Frequently Asked Questions
1. What teams use a power transmission substation facility dashboard?
Operations, maintenance, reliability engineering, asset management, and compliance teams use it for daily monitoring and planning.
2. How does this dashboard improve reliability?
It identifies early degradation signals, tracks maintenance effectiveness, and highlights systems that threaten availability.
3. Can it integrate with SCADA and EAM systems?
Yes. Most implementations combine operational telemetry with work order and inspection data.