
What is a Hydroelectric Power Plant Asset Management Dashboard?
A Hydroelectric Power Plant Asset Management Dashboard is a centralized visual platform designed to monitor the health, performance, and maintenance of critical assets like turbines and generators. It consolidates data related to equipment availability, reliability metrics, maintenance costs, and the root causes of failures. By integrating hydro turbine performance monitoring, generator health analytics, and predictive maintenance for hydro assets, the dashboard helps plant operators maximize operational uptime, optimize maintenance schedules, and extend the lifespan of expensive machinery. The dashboard serves as a key tool for tracking forced outage rates, analyzing the causes of downtime, and making data-driven decisions for both corrective and preventive maintenance strategies.
How to Create a Hydroelectric Power Plant Asset Management Dashboard
You don’t need to build your report from scratch—just start with a ready-to-use dashboard template from Mokkup. Add in your data and export it however you like. Here’s how to do it:
1. Create or Log in to Your Mokkup Account
Start by signing up on Mokkup.ai using your email. If you already have an account, just log in, and you’ll be good to go.
2. Choose and Customize Your Dashboard Template
Find the Hydroelectric Power Plant Asset Management Dashboard template in the Templates section. Use the drag-and-drop editor to adjust KPIs, edit filters, or add elements based on your data.
3. Export to Your BI Tool
Once your dashboard wireframe is ready, use the BI Tool Export feature to send it directly to Power BI or Tableau for further analysis and enhancements. You can also download the dashboard as a PDF, PNG, or JPEG, embed it on a platform, or invite your team to collaborate.
Note: This is a Pro template. You’ll need a Pro subscription on Mokkup to use and customize this dashboard wireframe. Upgrade anytime to unlock full access.
Hydroelectric Power Plant Asset Management Dashboard Example
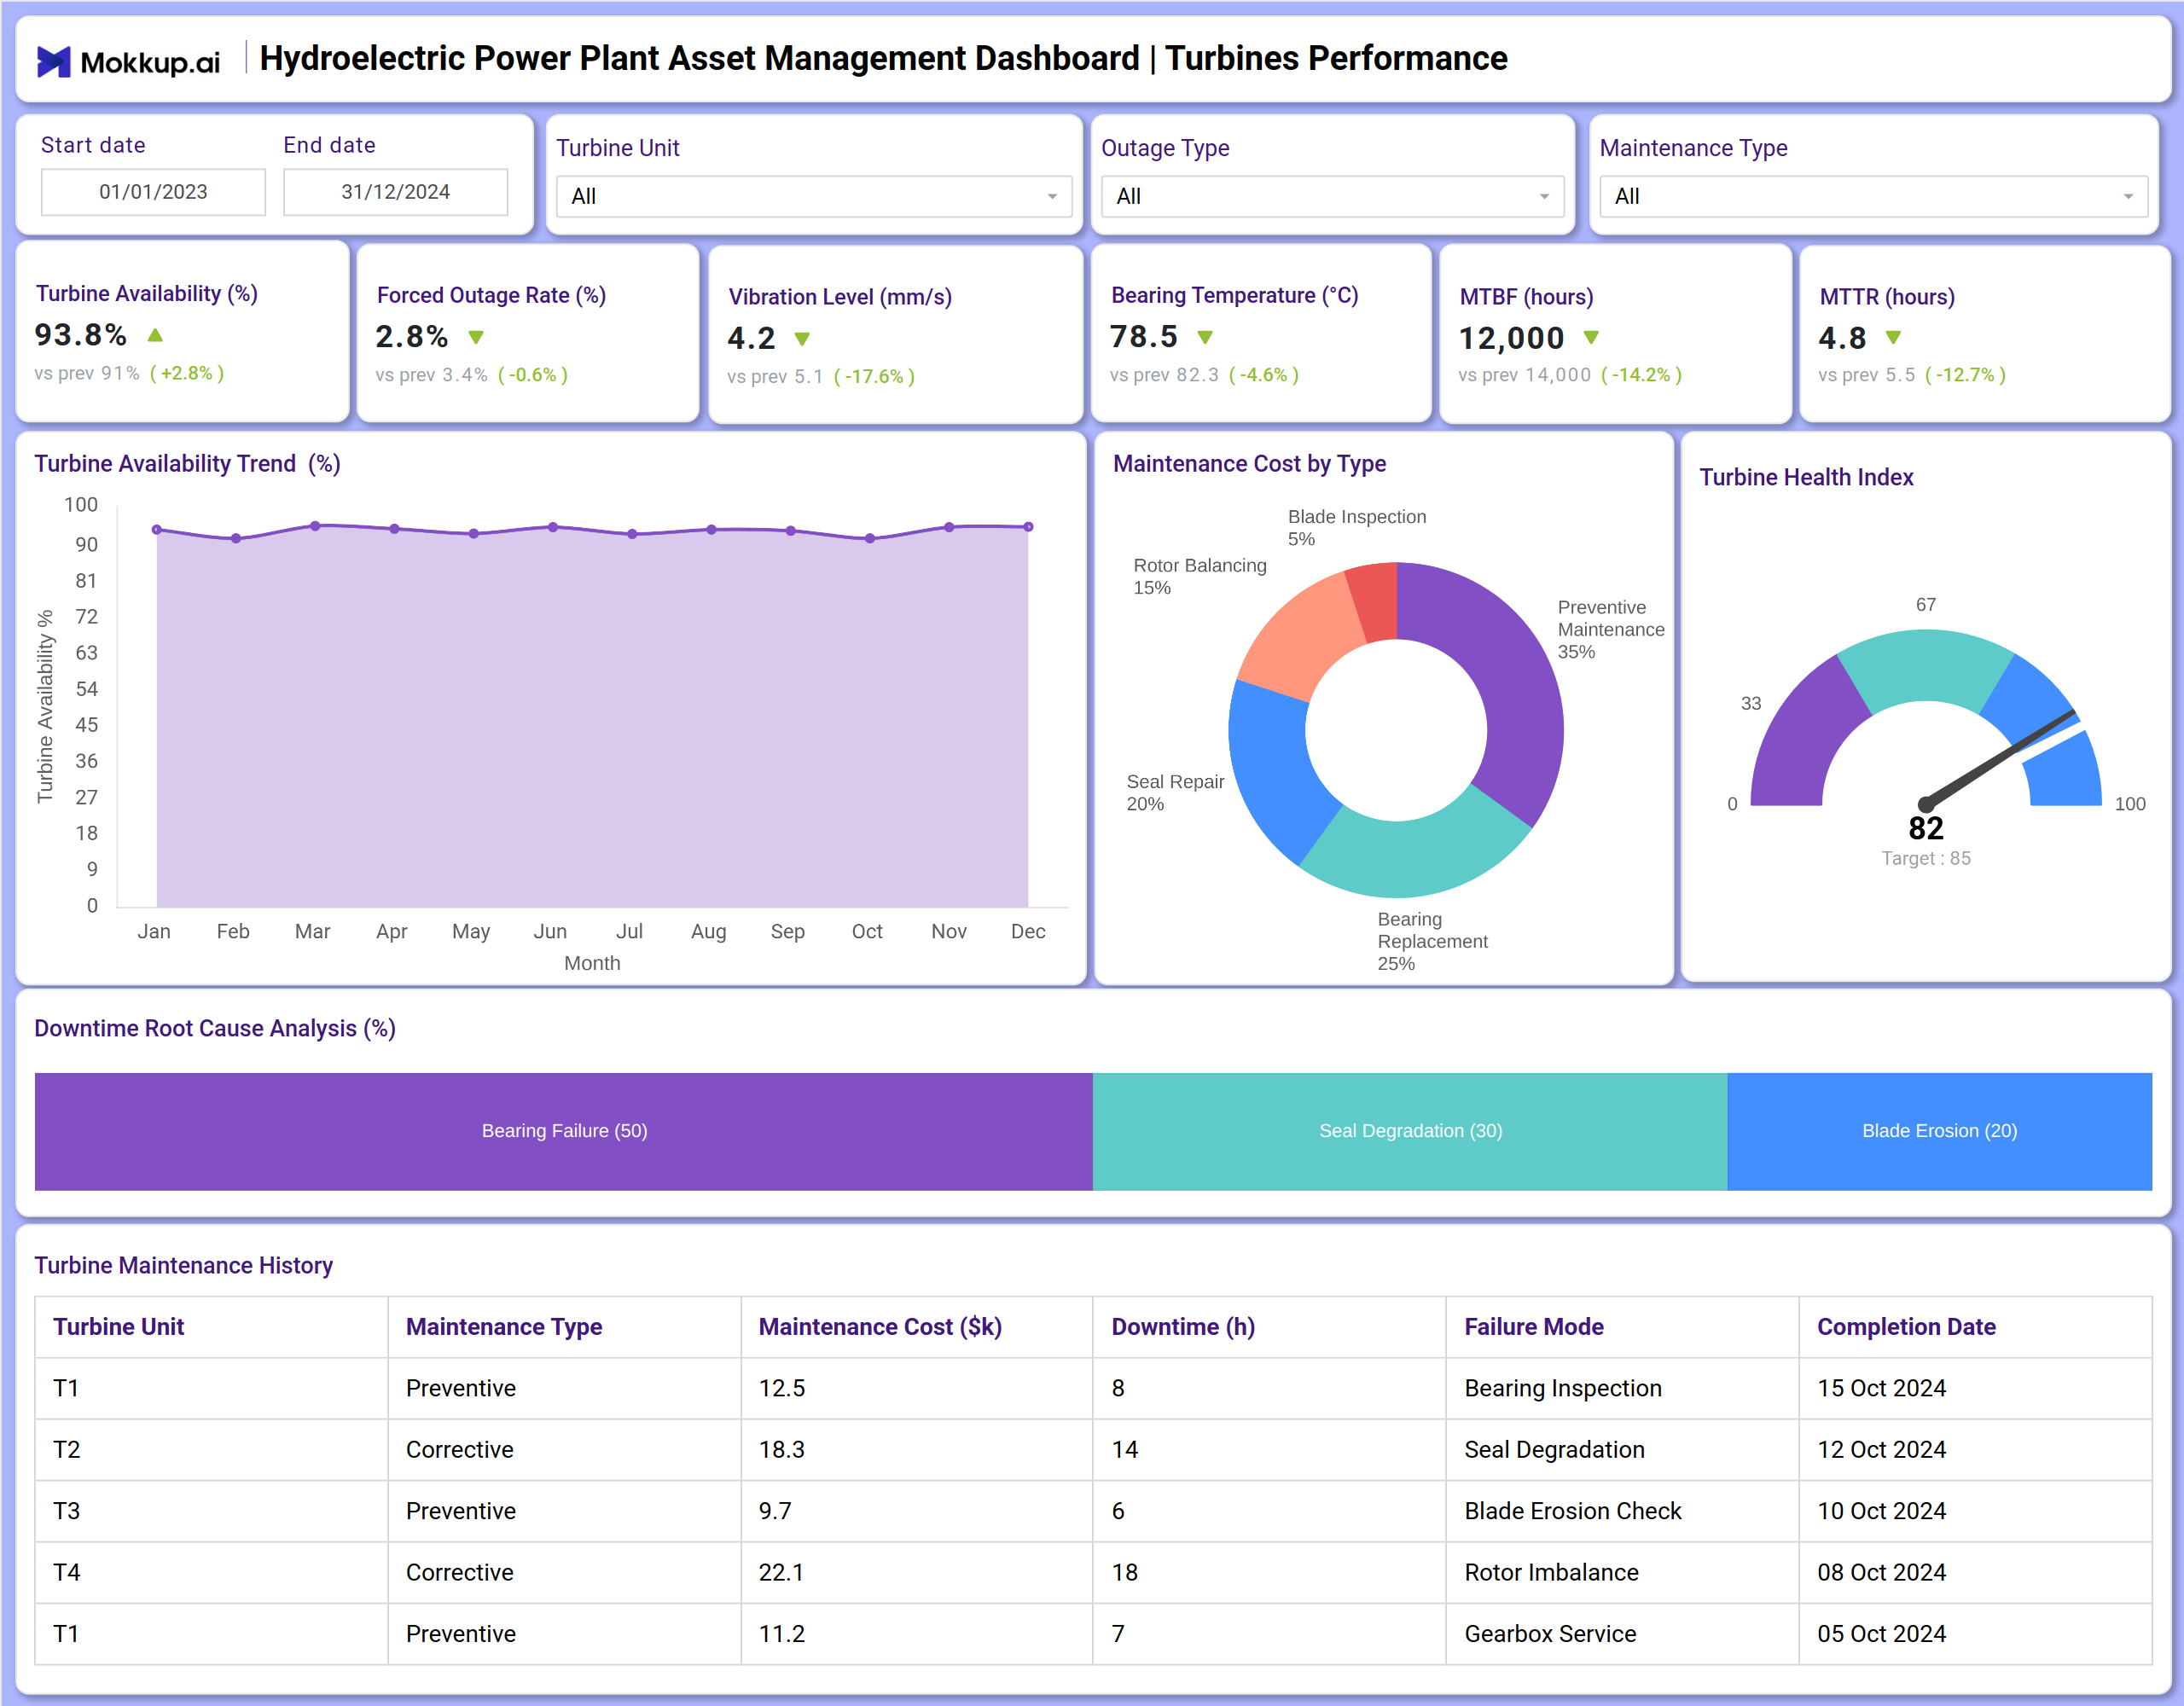
You can create a Hydroelectric Power Plant Asset Management Dashboard that brings together turbine and generator performance into a unified view. A typical dashboard includes the Turbines section, where users can track availability, forced outage rates, vibration levels, and bearing temperature. Visual charts help analyze the turbine availability trend over time, break down maintenance costs by type, and perform a root cause analysis for downtime.
The Generators dashboard builds on this by displaying generator availability, efficiency, stator winding temperature, and rotor vibration levels. A detailed table logs the generator maintenance history, while a bar chart compares rotor vibration across different generator units. Together, these modules provide crucial insights into hydro asset reliability, helping operators prevent unexpected failures, plan maintenance effectively, and ensure the continuous and efficient generation of hydroelectric power.
How to Analyze Data in Hydroelectric Power Plant Asset Management Dashboards
Here is how you can analyze data from this dashboard:
- Monitor Turbine Availability (%) and Generator Availability (%) to assess the operational readiness and reliability of your primary generating assets.
- Track the Forced Outage Rate (%) to understand the frequency of unplanned equipment failures that disrupt power generation.
- Analyze Vibration Level (mm/s) and Bearing Temperature (°C) to identify early signs of mechanical wear and prevent catastrophic failures.
- Review Mean Time Between Failures (MTBF) (hours) to evaluate the average operating time between failures and gauge overall asset reliability.
- Scrutinize Mean Time To Repair (MTTR) (hours) to measure the average time required to repair a failed asset and assess maintenance team efficiency.
- Evaluate the Downtime Root Cause Analysis (%) to identify the primary reasons for outages and prioritize corrective engineering solutions.
- Assess Generator Efficiency (%) to determine how effectively the generator converts mechanical energy into electrical energy.
- Monitor Stator Winding Temperature (°C) to ensure the generator's electrical components are operating within safe thermal limits.
- Break down Maintenance Cost by Type to understand spending distribution and optimize the maintenance budget.
- Review the Turbine Maintenance History and Generator Availability Log to track past activities, failure modes, and their impact on availability.
Benefits of Hydroelectric Power Plant Asset Management Dashboard
The following are the benefits of using this dashboard:
- Provides a centralized view of turbine and generator health, performance, and maintenance history.
- Supports proactive maintenance planning with hydro turbine performance monitoring and generator health analytics.
- Enhances decision-making for maintenance teams with clear insights into reliability metrics and the root causes of failures.
- Enhances operational uptime by identifying trends that could lead to forced outages.
- Increases asset lifespan through diligent tracking of mechanical and thermal stress indicators.
- Optimizes maintenance budgets by analyzing the cost distribution and effectiveness of various maintenance types.
- Strengthens hydro asset reliability reporting with organized records of performance and maintenance.
- Ensures preparedness for management reviews with consolidated data on plant availability and efficiency.
KPIs to Track in Hydroelectric Power Plant Asset Management Dashboard
The following key KPIs can be tracked by using this dashboard:
- Turbine Availability (%): The percentage of time a turbine is available to generate power, indicating operational reliability.
- Generator Availability (%): The percentage of time a generator is operational and ready to produce electricity.
- Forced Outage Rate (%): The frequency of unplanned shutdowns, reflecting asset reliability and failure proneness.
- Vibration Level (mm/s): A measure of mechanical oscillation in turbine components, used to detect imbalance or misalignment.
- Bearing Temperature (°C): The operating temperature of turbine bearings, a key indicator of potential lubrication or failure issues.
- Mean Time Between Failures (MTBF) (hours): The average operational time between system failures, measuring asset reliability.
- Mean Time To Repair (MTTR) (hours): The average time needed to restore a failed asset to regular operation, indicating maintenance efficiency.
- Generator Efficiency (%): The ratio of electrical energy output to mechanical energy input, showing conversion effectiveness.
- Stator Winding Temperature (°C): The temperature of the generator's stationary windings, critical for preventing insulation damage.
- Rotor Vibration Level (mm/s): The vibration intensity of the generator's rotating part, signaling potential mechanical issues.
- Maintenance Cost by Type ($): The categorization of maintenance expenses (e.g., bearing replacement, blade inspection) for budget analysis.
- Downtime Root Cause Analysis (%): The breakdown of primary causes for asset downtime, guiding targeted improvements.
Frequently Asked Questions
1. What is the purpose of a hydroelectric asset management dashboard?
It helps monitor the health and performance of critical assets, such as turbines and generators, track maintenance activities, and analyze reliability metrics to prevent failures and optimize operations.
2. Can the dashboard help reduce unplanned outages?
Yes. Tracking forced outage rates, vibration, and temperature provides early warnings of potential issues, allowing for proactive intervention.
3. How does the dashboard improve maintenance planning?
It provides insights into MTBF, MTTR, and maintenance history, enabling teams to schedule preventive maintenance effectively and reduce the costs of corrective maintenance.
4. Does it track the financial aspect of maintenance?
Yes. It monitors maintenance costs by type, enabling managers to understand spending patterns and optimize their maintenance budget.
5. Who uses this dashboard?
Plant managers, maintenance supervisors, reliability engineers, and operations managers.