
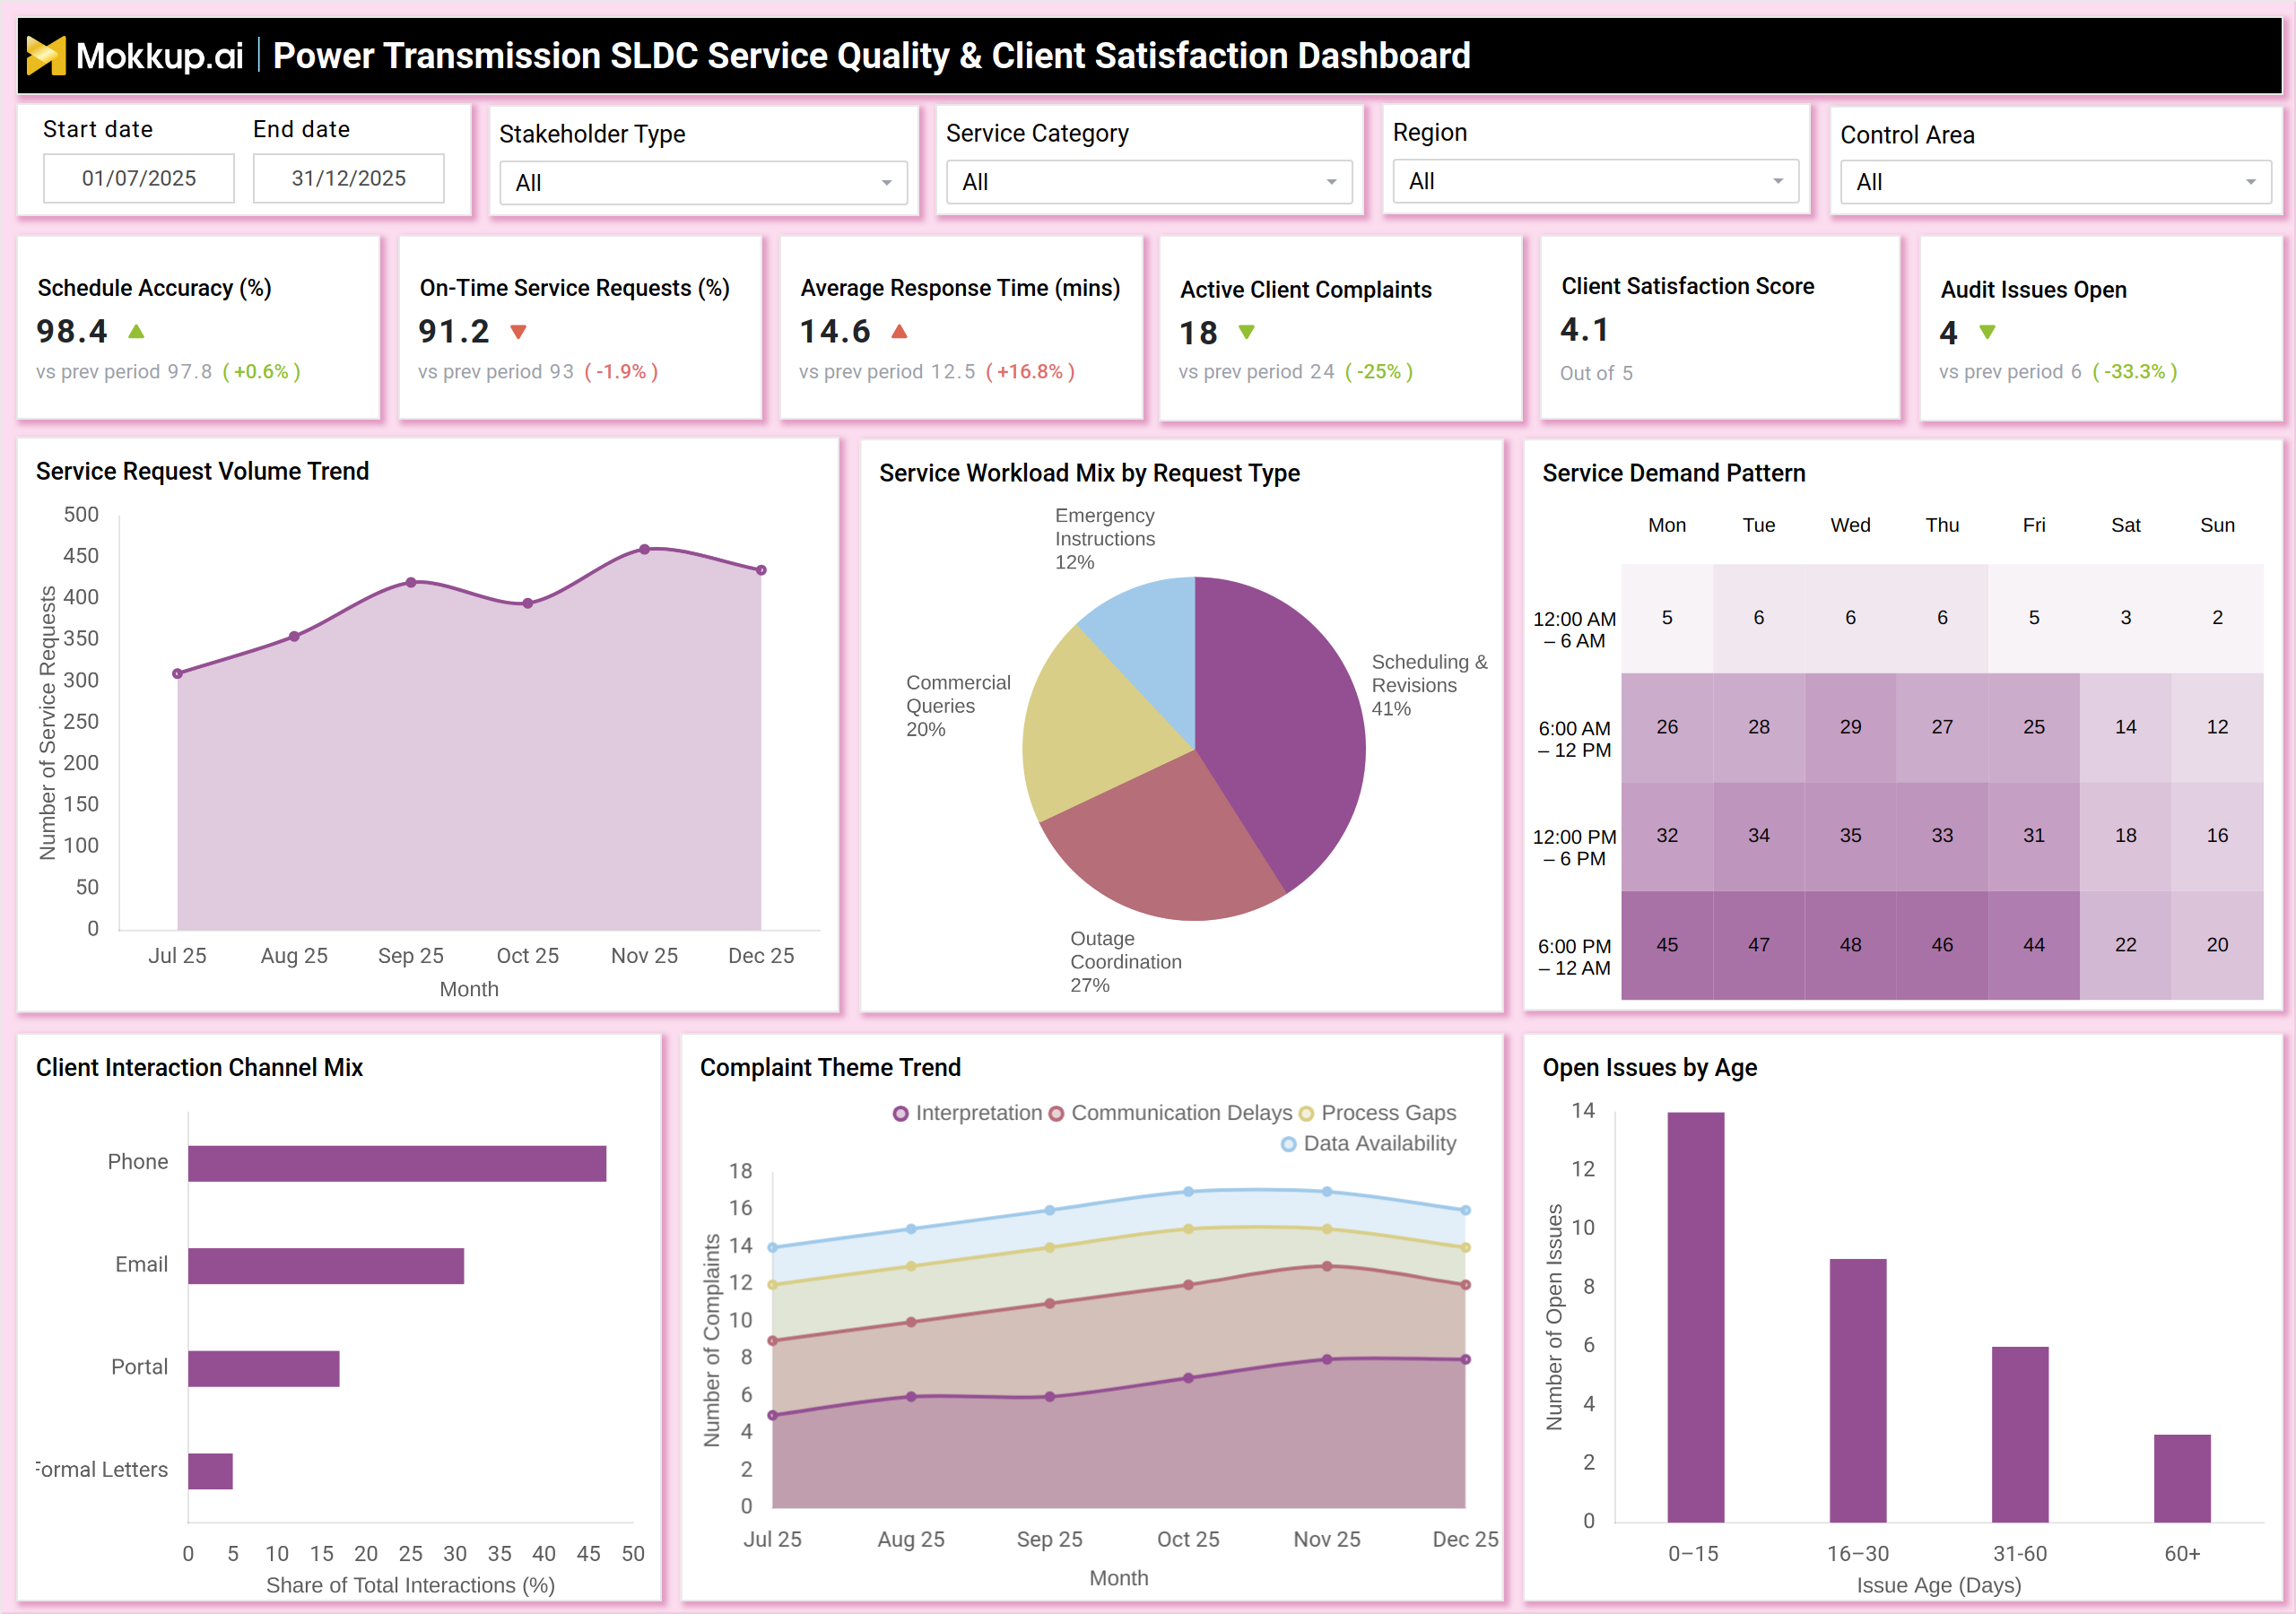
What is a Power Transmission SLDC Service Quality & Client Satisfaction Dashboard?
A Power Transmission SLDC Service Quality & Client Satisfaction Dashboard is an executive-level analytics solution designed to monitor, measure, and improve the service delivery performance of State Load Dispatch Centres. It provides a centralized view of operational service metrics, client satisfaction indicators, response efficiency, and issue resolution effectiveness across transmission networks. This dashboard functions as a power transmission SLDC service quality dashboard, enabling utilities to track scheduling accuracy, on-time service delivery, response times, and complaint volumes.
By combining operational data with stakeholder feedback, it serves as a transmission utility service performance dashboard that supports regulatory compliance, service transparency, and customer trust. For transmission system operators, the dashboard also acts as an SLDC operational service monitoring analytics platform, helping leadership identify service bottlenecks, workload pressure points, and recurring complaint themes while ensuring consistent service assurance across regions.
How to Create a Power Transmission SLDC Service Quality & Client Satisfaction Dashboard
You don’t need to build your report from scratch, just start with a ready-to-use dashboard template from Mokkup. Add in your data and export it however you like. Here’s how to do it:
1. Create or Log in to Your Mokkup Account
Start by signing up on Mokkup.ai using your email. If you already have an account, just log in, and you’ll be good to go.
2. Choose and Customize Your Dashboard Template
Find the Power Transmission SLDC Service Quality & Client Satisfaction Dashboard template in the Templates section. Use the drag-and-drop editor to adjust KPIs, edit filters, or add elements based on your data.
3. Export to Your BI Tool
Once your dashboard wireframe is ready, use the BI Tool Export feature to send it directly to Power BI or Tableau for further analysis and enhancements. You can also download the dashboard as a PDF, PNG, or JPEG, embed it on a platform, or invite your team to collaborate.
Note: This is a Pro template. You’ll need a Pro subscription on Mokkup to use and customize this dashboard wireframe. Upgrade anytime to unlock full access.
Power Transmission SLDC Service Quality & Client Satisfaction Dashboard Example
A typical Power Transmission SLDC Service Quality & Client Satisfaction Dashboard presents KPIs such as schedule accuracy, on-time service request fulfillment, average response time, active client complaints, and client satisfaction score at the top level. These indicators provide a snapshot of SLDC service reliability and responsiveness. Supporting visuals include service request volume trends, workload mix by request type, and service demand heatmaps by day and time. Complaint analytics highlight recurring service issues, communication gaps, and data availability concerns. Together, these insights position the dashboard as an SLDC client satisfaction analytics platform and a power grid SLDC service assurance dashboard for operational and regulatory decision-making.
How to Analyze Data in Power Transmission SLDC Service Quality & Client Satisfaction Dashboard
Here is how you can analyze data from this dashboard:
- Review Schedule Accuracy (%) to assess precision in generation scheduling and dispatch instructions.
- Monitor On-Time Service Requests (%) to evaluate SLDC's responsiveness to stakeholder requests.
- Track Average Response Time (minutes) to identify delays in issue handling and escalation workflows.
- Analyze Service Request Volume Trends to understand demand growth and workload seasonality.
- Use Service Workload Mix to identify dominant request categories, such as scheduling revisions or outage coordination.
- Study Service Demand Heatmaps to detect peak service pressure by day and time.
- Examine Complaint Theme Trends to identify systemic service gaps and communication issues.
- Review Open Issues by Age to ensure timely resolution and avoid regulatory non-compliance.
Benefits of Power Transmission SLDC Service Quality & Client Satisfaction Dashboard
The following are the benefits of using this dashboard:
- Improves transparency of SLDC service performance across stakeholders
- Enhances client satisfaction through faster response and issue resolution
- Strengthens regulatory compliance and audit readiness
- Identifies service bottlenecks and operational inefficiencies
- Supports data-driven staffing and workload planning
- Reduces repeat complaints through root-cause visibility
- Enables proactive service assurance across the transmission network
- Strengthens trust between SLDCs and market participants
KPIs to Track in Power Transmission SLDC Service Quality & Client Satisfaction Dashboard
The following key KPIs can be tracked by using this dashboard:
- Schedule Accuracy: Measures the accuracy of dispatch schedules issued by the SLDC against actual execution.
- On-Time Service Requests: Tracks the percentage of stakeholder service requests completed within committed timelines.
- Average Response Time: Indicates how quickly the SLDC responds to service requests, instructions, and queries.
- Active Client Complaints: Shows the total number of unresolved complaints raised by stakeholders.
- Client Satisfaction Score: Captures overall stakeholder satisfaction based on structured feedback surveys.
- Audit Issues Open: Tracks the number of open audit or compliance-related issues impacting service quality.
- Service Request Volume: Measures the total number of service requests handled by the SLDC over time.
- Service Workload Mix: Analyzes the distribution of requests across scheduling revisions, outage coordination, commercial queries, and emergency instructions.
- Peak Service Demand Periods: Identifies high-demand time windows using service demand heatmaps by day and hour.
- Complaint Theme Incidence: Tracks complaints by root cause, such as communication delays, process gaps, interpretation issues, and data availability.
- Open Issues Aging: Monitors the duration of unresolved service issues, segmented by aging buckets.
- Client Interaction Channel Share: Measures how stakeholders interact with the SLDC across phone, email, portals, and formal letters.
Frequently Asked Questions
1. What is the purpose of an SLDC service quality dashboard?
It helps transmission utilities monitor service reliability, responsiveness, and client satisfaction in a single platform.
2. Who uses this dashboard?
SLDC executives, transmission utility leadership, regulatory teams, and service operations managers.
3. How does it improve client satisfaction?
By identifying delays, recurring issues, and service gaps, we can enable faster corrective action.