What is a Coal Power Generation Service Quality Dashboard?
A Coal Power Generation Service Quality Dashboard template is a centralized tool designed for power plant managers, regional directors, and customer service leads to monitor and evaluate service performance across key operational and customer-facing metrics. It provides a clear view of power supply reliability, customer satisfaction, complaint resolution efficiency, and outage management. Unlike scattered reports, this dashboard wireframe serves as a Coal Power Generation Service Quality Dashboard, enabling organizations to track service delivery, identify operational gaps, and enhance customer trust in a single, unified view.
How to Create a Coal Power Generation Service Quality Dashboard
You don’t need to start from scratch—just begin with a ready-to-use Coal Power Generation Service Quality Dashboard Template from Mokkup. Input your data and customize the layout to suit your reporting needs. Here’s how:
1. Create or Log in to Your Mokkup Account
Sign up on Mokkup.ai using your email address. Existing users can log in directly.
2. Choose and Customize Your Dashboard Template
Locate the Coal Power Generation Service Quality Dashboard Template in the Templates gallery. Use the intuitive editor to adjust KPIs, change chart types, or apply filters.
3. Export to Your Preferred Format
Once your dashboard wireframe is ready, you can export it to Power BI or Tableau for deeper analysis. You can also download it as a PDF, PNG, or JPEG, share it with stakeholders, or invite team members to collaborate.
Note: This is a Pro template. A Mokkup Pro subscription is required to access and customize this dashboard wireframe.
Coal Power Generation Service Quality Dashboard Example
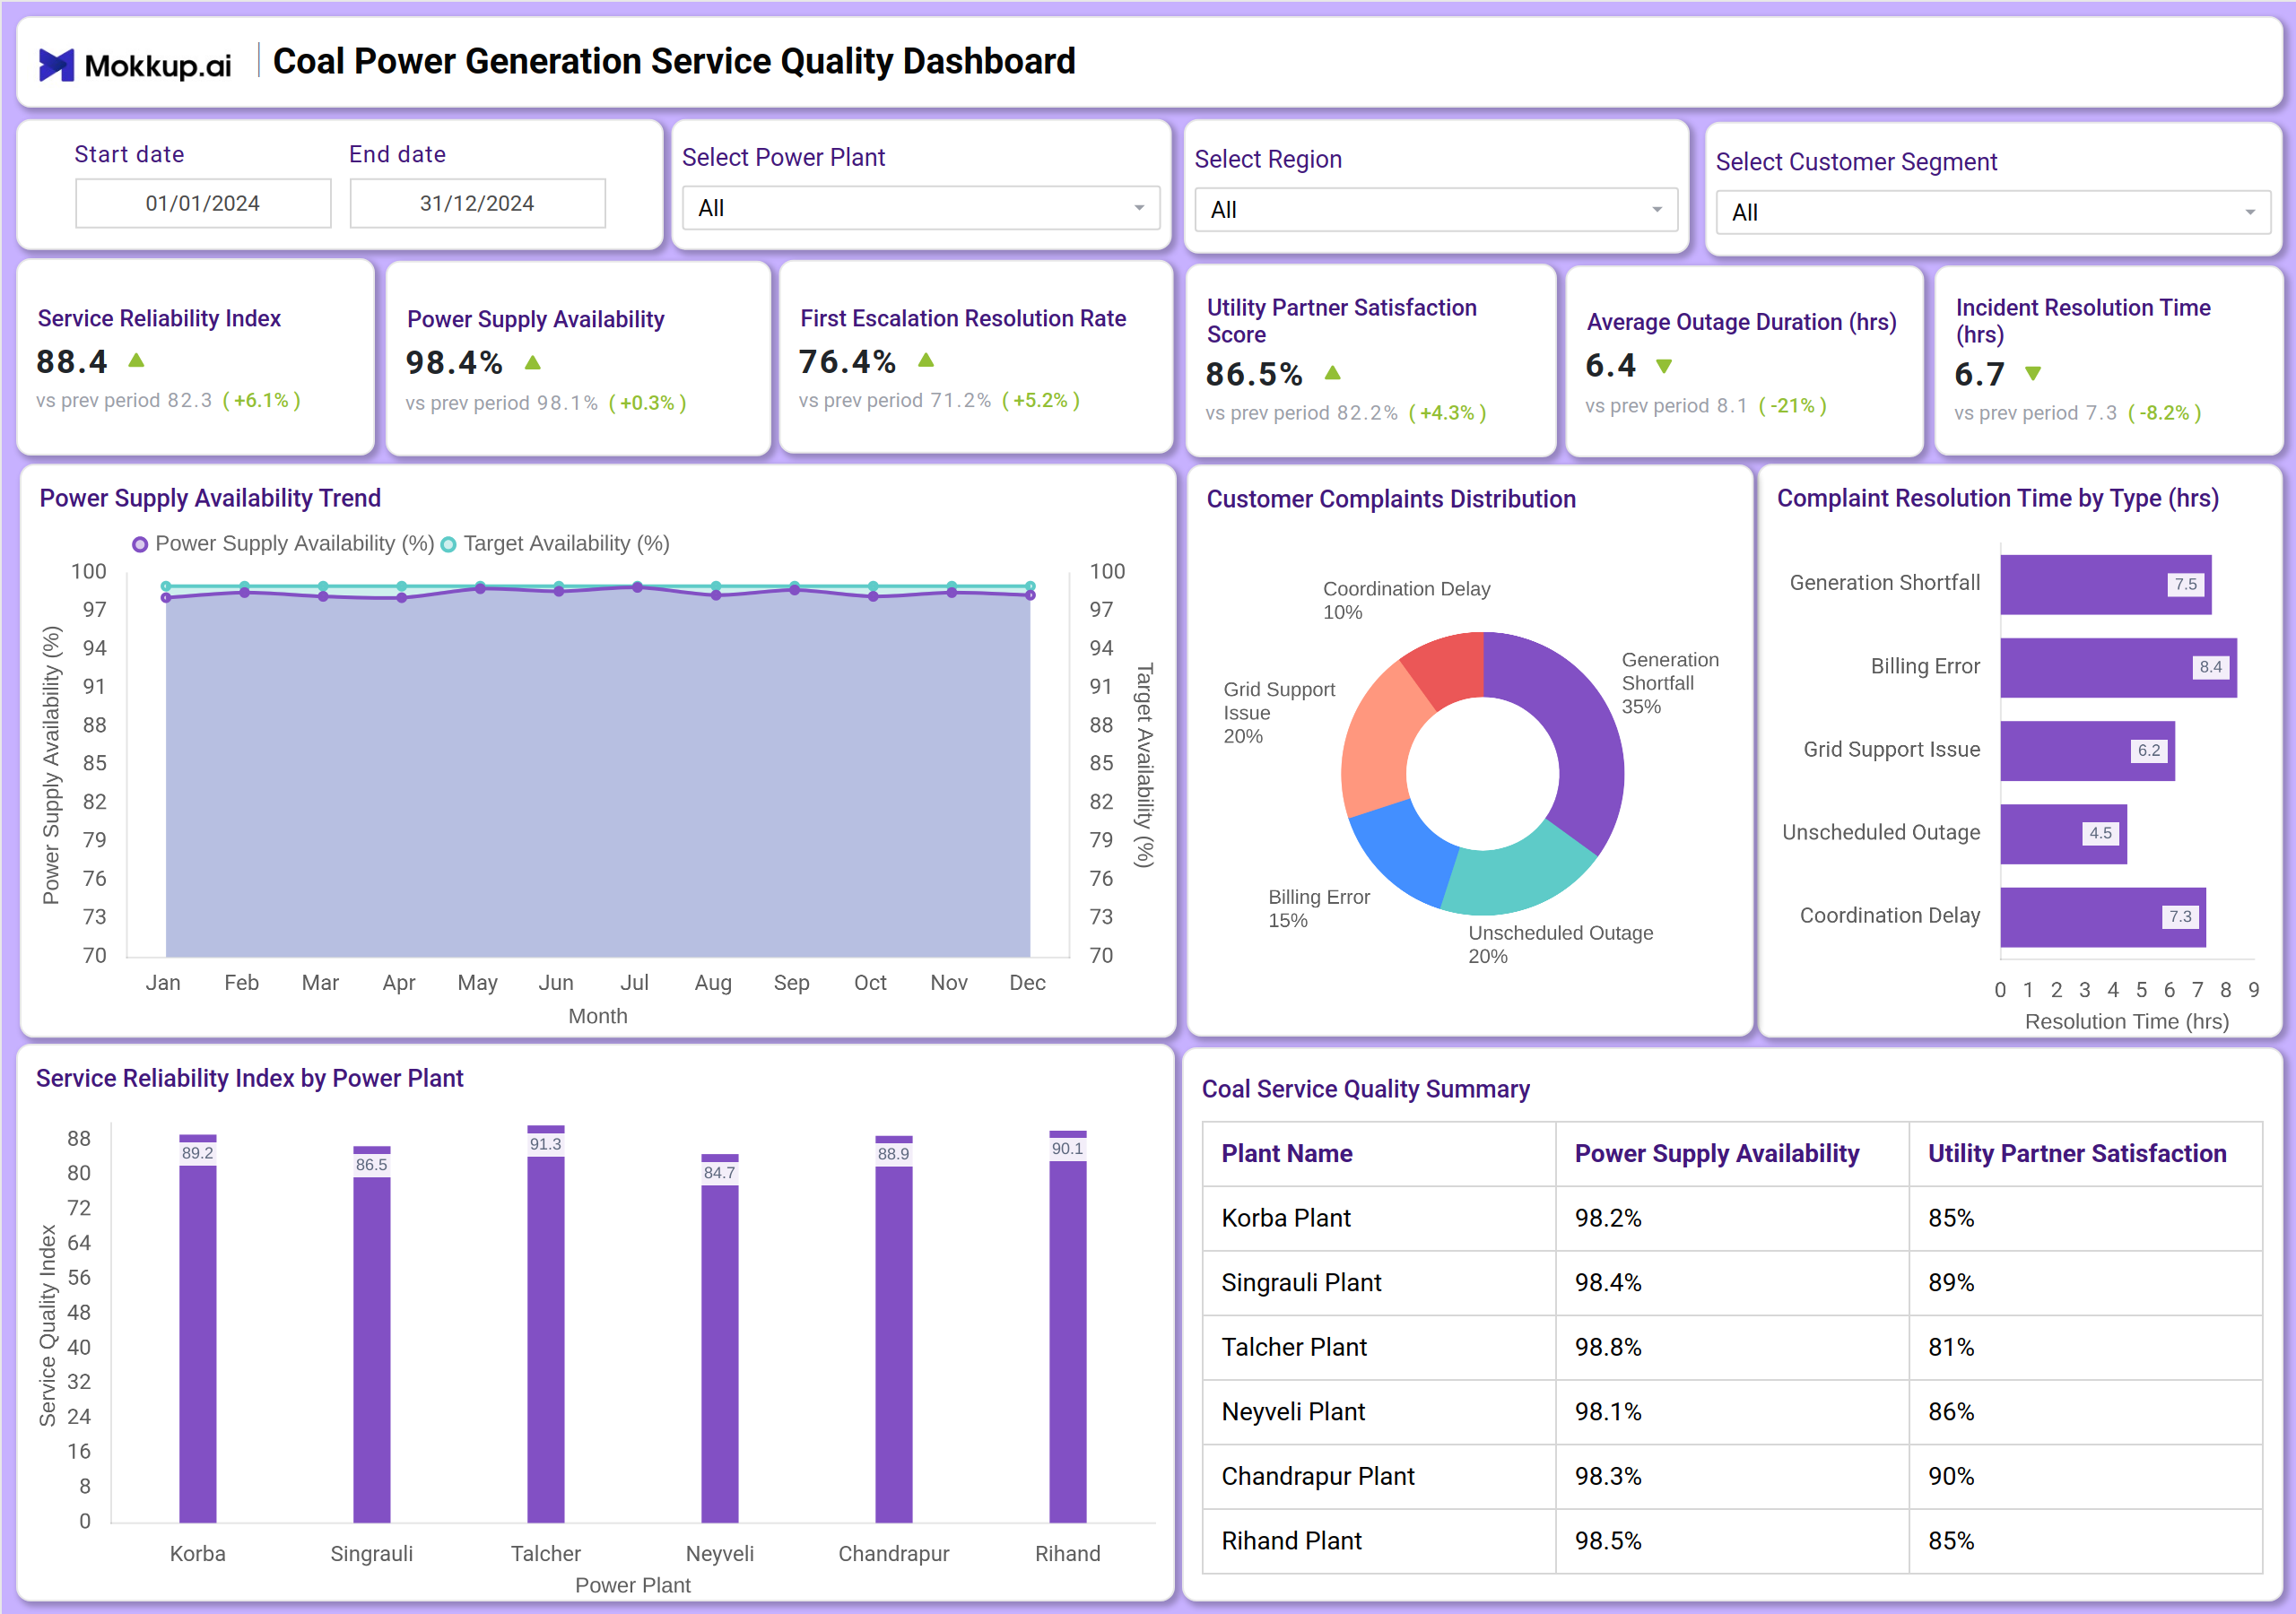
A Coal Power Generation Service Quality Dashboard typically includes a combination of KPI tiles and visual summaries. At the top, key metric cards display the Service Quality Index, Power Supply Availability, First Contact Resolution Rate, Customer Satisfaction Score, Average Outage Duration, and Complaint Resolution Time. Below, trend charts show monthly power supply performance against targets, while pie and bar charts break down customer complaints and payment-related issues. A summary table compares plant-level availability and satisfaction scores. This layout makes it the best dashboard for tracking coal power service quality, offering both operational and customer-centric insights.
How to Analyze Data in Coal Power Generation Service Quality Dashboards
Here’s how power generation teams can leverage the Coal Power Generation Service Quality Dashboard:
- Monitor Service Quality Index: Track overall service performance and compare it with previous periods to measure improvement.
- Evaluate Power Supply Availability: Analyze the percentage of time power is successfully supplied against set targets.
- Review First Contact Resolution Rate: Measure the frequency at which customer issues are resolved during the initial interaction.
- Assess Customer Satisfaction Score: Gauge customer perceptions and service experience over time.
- Track Average Outage Duration: Monitor the average duration of power outages to identify trends in reliability.
- Analyze Complaint Resolution Time: Review the average time taken to resolve customer complaints.
- Study Complaint Distribution: Understand common complaint categories, including equipment problems, billing disputes, and service quality issues.
- Compare Plant Performance: Use the service quality index by power plant to identify top and low performers.
Benefits of Coal Power Generation Service Quality Dashboards
A Service Quality Dashboard helps coal power plants monitor the reliability, efficiency, and customer experience associated with power delivery. It centralizes performance metrics and ensures teams stay proactive in managing service issues:
- Centralized Performance Tracking: All key service and operational metrics in one place.
- Improved Customer Trust: By monitoring satisfaction and resolution metrics.
- Operational Transparency: Clear view of outage durations and power availability.
- Informed Decision-Making: Data-driven insights to prioritize maintenance and training.
- Compliance & Reporting Support: Functions as a coal power generation reporting and compliance dashboard for internal and regulatory reviews.
Together, these components help leadership maintain service consistency and enhance customer relations, making this the best dashboard for coal power generation service quality when aiming for operational excellence.
KPIs to Track in Coal Power Generation Service Quality Dashboards
Tracking the right KPIs ensures power utilities evaluate service reliability, customer satisfaction, and operational performance effectively:
- Service Quality Index: Overall measure of service performance.
- Power Supply Availability (%): Percentage of time power is supplied successfully.
- First Contact Resolution Rate (%): Share of issues resolved in the first interaction.
- Customer Satisfaction Score (%): Level of customer happiness with services.
- Average Outage Duration (hrs): Mean time of power interruption events.
- Complaint Resolution Time (hrs): Average time taken to resolve complaints.
- Customer Complaints Distribution: Breakdown of complaint types and frequency.
- Plant-wise Service Quality Index: Performance comparison across power plants.
Frequently Asked Questions
Q1. Who should use a Coal Power Generation Service Quality Dashboard?
Plant managers, regional operation heads, customer service supervisors, and quality assurance teams are responsible for maintaining service standards.
Q2. Can this dashboard help reduce outage times?
Yes. By tracking average outage duration and power availability trends, teams can identify recurring issues and implement preventive measures.
Q3. How does it support customer service improvement?
It highlights first-contact resolution rates and complaint resolution times, helping teams streamline their support processes.
Q4. Is this dashboard useful for compliance?
Yes. As a coal power generation reporting and compliance dashboard, it supports audit readiness and regulatory reporting with consistent metric tracking.