What is a Power Transmission Grid Modernization & Innovation Dashboard?
A Power Transmission Grid Modernization & Innovation Dashboard is a strategic analytics solution designed for transmission system operators to track modernization investments, digital transformation progress, and innovation outcomes across the grid. It provides a centralized view of how transmission utilities are upgrading substations, deploying automation, improving observability, and strengthening grid resilience. This power transmission grid modernization dashboard enables utilities to monitor innovation spend, deployment readiness, and reliability improvements. It supports data-driven decisions by connecting financial investments with operational and reliability outcomes. As a transmission grid innovation analytics platform, the dashboard helps utilities balance modernization ambition with execution risk. It ensures innovation programs remain aligned with regulatory requirements, grid performance goals, and long-term network sustainability.
How to Create a Power Transmission Grid Modernization & Innovation Dashboard
You don’t need to build your report from scratch, just start with a ready-to-use dashboard template from Mokkup. Add in your data and export it however you like. Here’s how to do it:
1. Create or Log in to Your Mokkup Account
Start by signing up on Mokkup.ai using your email. If you already have an account, just log in, and you’ll be good to go.
2. Choose and Customize Your Dashboard Template
Find the Power Transmission Grid Modernization & Innovation Dashboard template in the Templates section. Use the drag-and-drop editor to adjust KPIs, edit filters, or add elements based on your data.
3. Export to Your BI Tool
Once your dashboard wireframe is ready, use the BI Tool Export feature to send it directly to Power BI or Tableau for further analysis and enhancements. You can also download the dashboard as a PDF, PNG, or JPEG, embed it on a platform, or invite your team to collaborate.
Note: This is a Pro template. You’ll need a Pro subscription on Mokkup to use and customize this dashboard wireframe. Upgrade anytime to unlock full access.
Power Transmission Grid Modernization & Innovation Dashboard Example
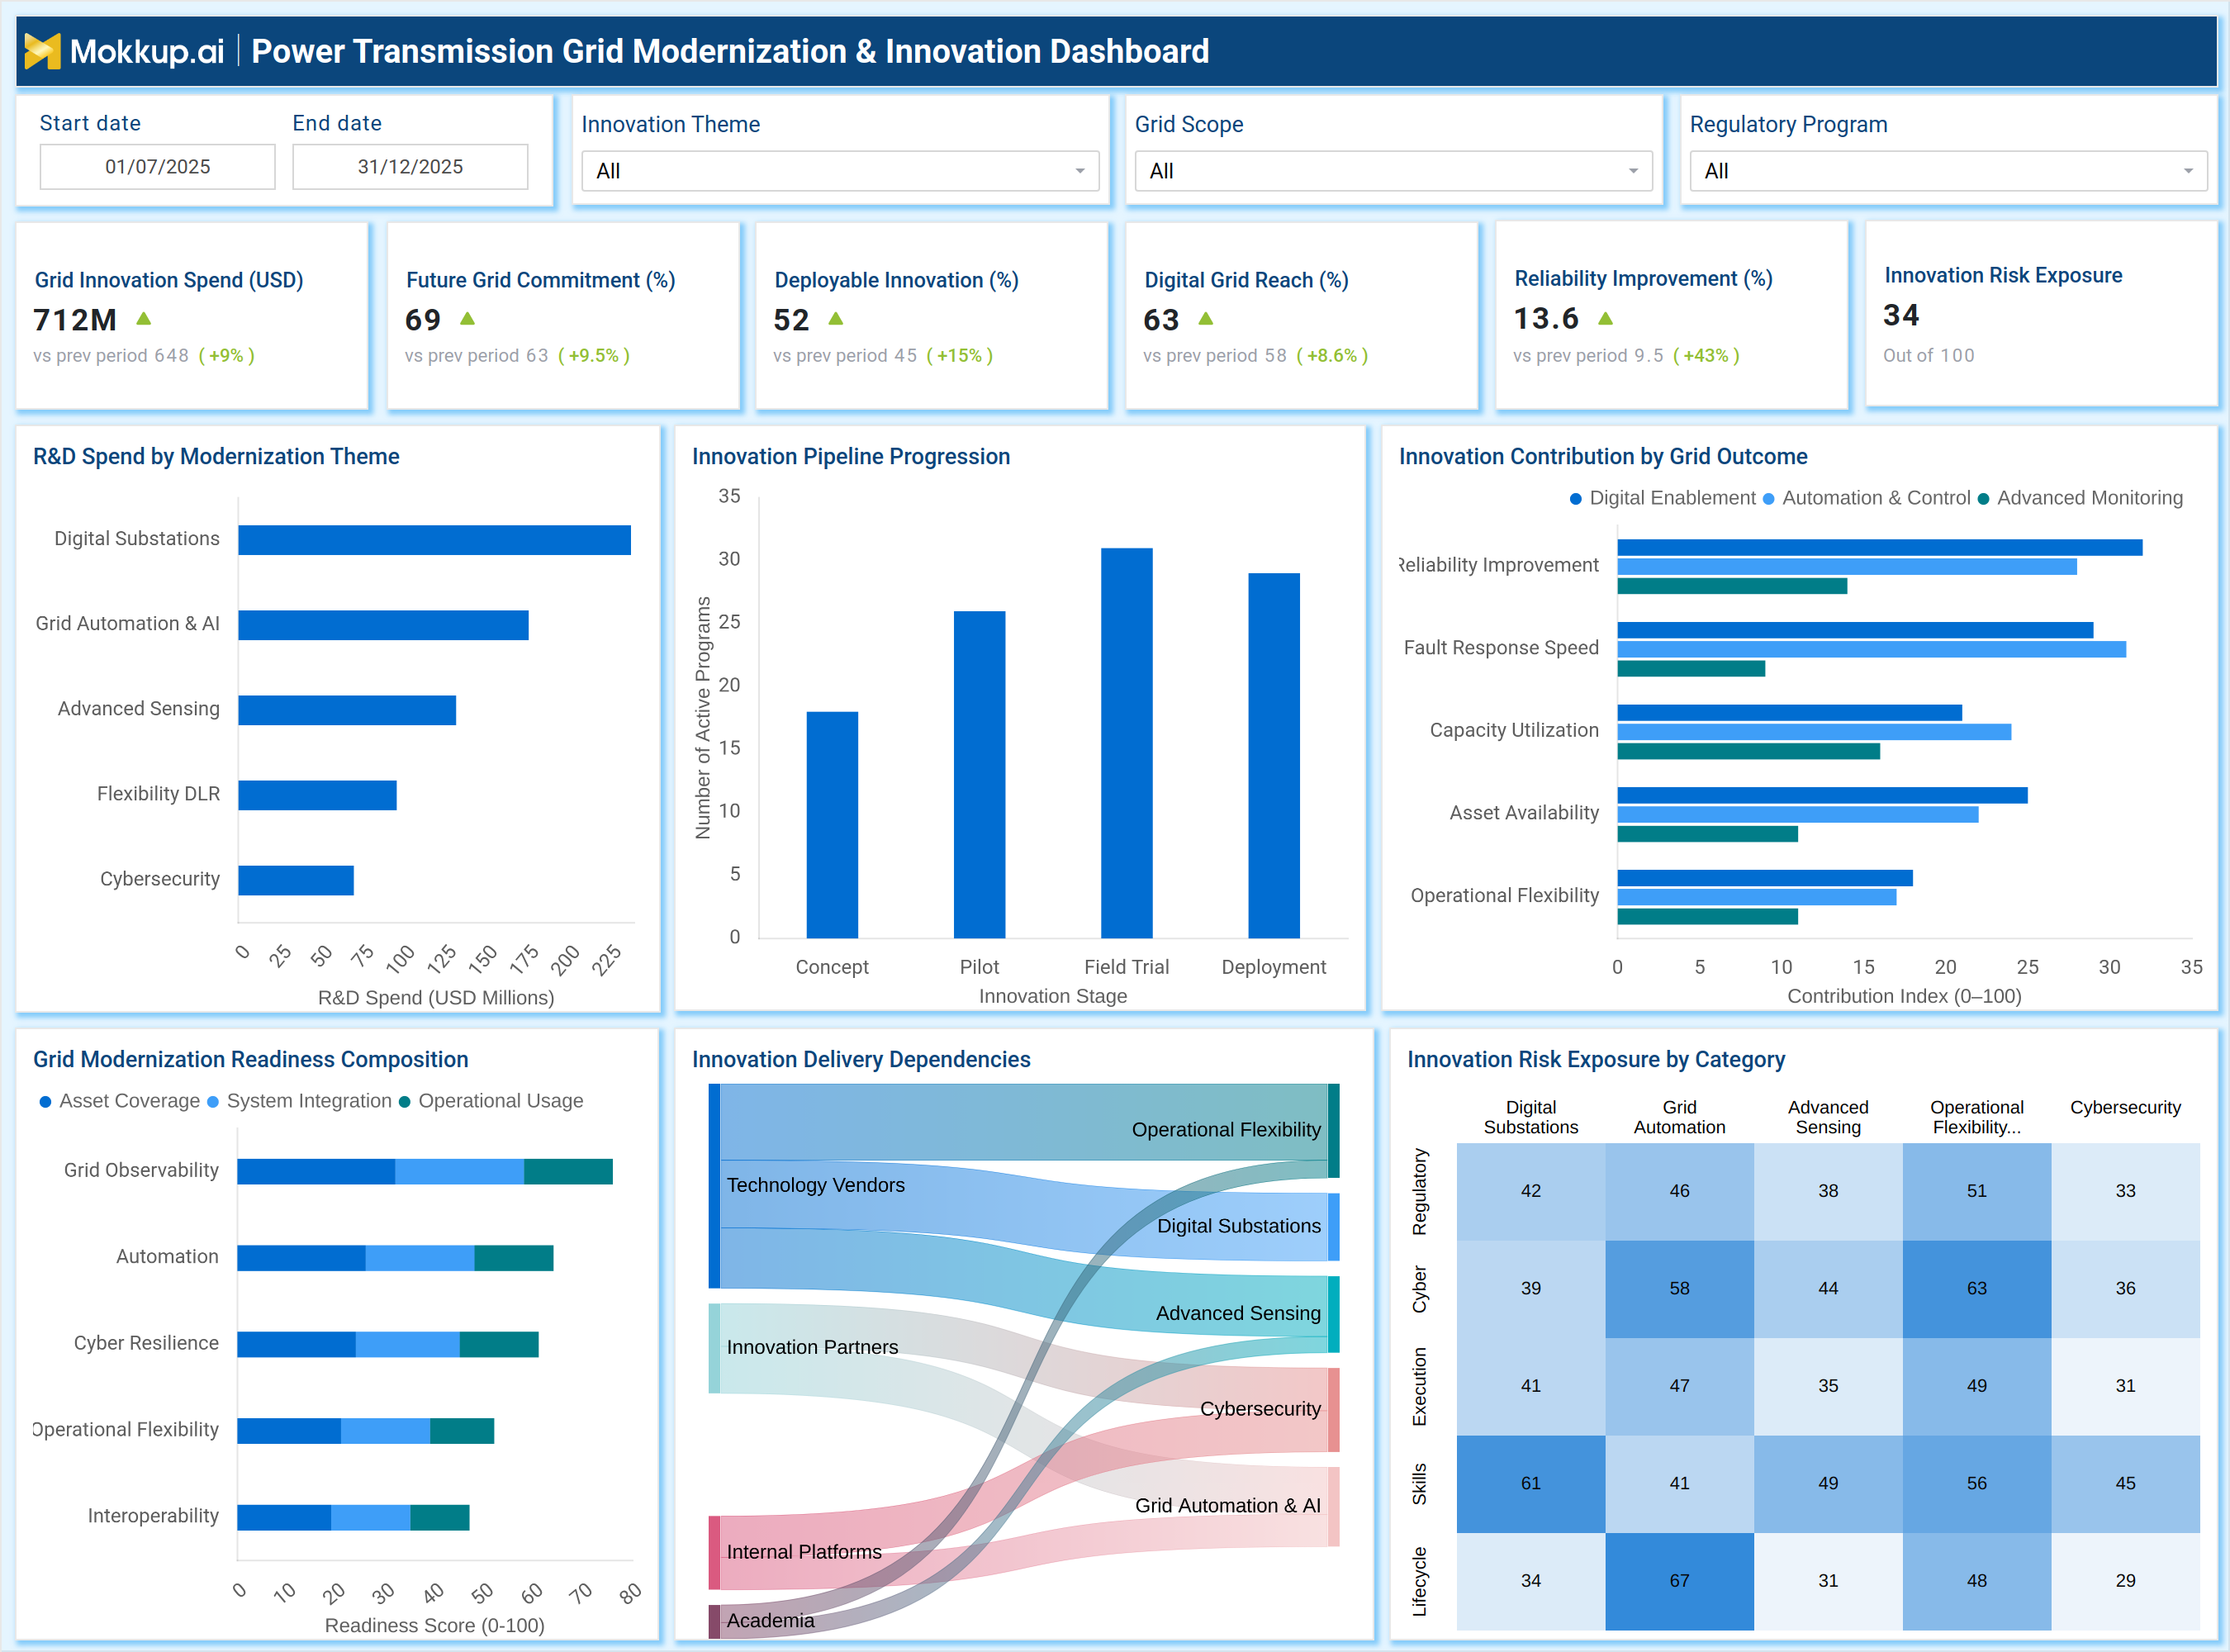
A typical smart transmission grid modernization dashboard presents a portfolio-level view of innovation initiatives across regions, grid scopes, and regulatory programs. Users can track total grid innovation spend, future grid commitment, and deployable innovation percentages to understand investment maturity. The dashboard visualizes R&D spend by modernization themes such as digital substations, grid automation and AI, advanced sensing, flexibility solutions, and cybersecurity. Innovation pipeline progression charts show how projects move from concept to pilot, field trial, and deployment. As a transmission utility digital transformation analytics tool, it highlights how innovation contributes to grid outcomes like reliability improvement, fault response speed, capacity utilization, and asset availability. Risk heatmaps further show innovation risk exposure across regulatory, cyber, execution, skills, and lifecycle dimensions.
How to Analyze Data in Power Transmission Grid Modernization & Innovation Dashboard
Here is how you can analyze data from this dashboard:
- Review Grid Innovation Spend to understand total investment levels and spending trends over time.
- Compare Future Grid Commitment (%) against deployable innovation to assess readiness gaps.
- Analyze Deployable Innovation (%) to identify initiatives ready for scaling or deployment.
- Track Digital Grid Reach to measure how widely digital technologies are implemented across assets.
- Evaluate Reliability Improvement (%) to connect modernization programs with operational outcomes.
- Use Innovation Pipeline Progression to detect bottlenecks between pilot and deployment stages.
- Assess R&D Spend by Modernization Theme to ensure balanced investment across priority areas.
- Monitor Grid Modernization Readiness Scores to identify weak areas in automation or interoperability.
- Analyze Innovation Contribution by Grid Outcome to prioritize high-impact initiatives.
- Review Innovation Risk Exposure heatmaps to manage regulatory, cyber, and execution risks early.
Benefits of Power Transmission Grid Modernization & Innovation Dashboard
The following are the benefits of using this dashboard:
- Provides clear visibility into modernization and innovation investments across the transmission network.
- Helps transmission utilities align digital transformation initiatives with reliability and resilience goals.
- Improves prioritization of innovation programs based on deployability and grid impact.
- Supports regulatory reporting and transparency for modernization and innovation funding.
- Enables proactive risk management across cyber, regulatory, and execution dimensions.
- Strengthens decision-making by linking innovation spend to measurable grid outcomes.
- Enhances coordination between technology teams, operations, and regulatory stakeholders.
- Accelerates the adoption of automation and digital substations across the grid.
KPIs to Track in Power Transmission Grid Modernization & Innovation Dashboard
The following key KPIs can be tracked by using this dashboard:
- Grid Innovation Spend (USD): Measures total capital and R&D investment allocated to grid modernization initiatives.
- Future Grid Commitment (%): Indicates long-term commitment toward planned modernization programs.
- Deployable Innovation (%): Tracks the percentage of innovation projects ready for operational deployment.
- Digital Grid Reach: Measures the extent of digital enablement across substations and transmission assets.
- Reliability Improvement (%): Quantifies reliability gains achieved through modernization initiatives.
- Innovation Risk Exposure (Score): Represents overall risk across regulatory, cyber, execution, skills, and lifecycle factors.
- R&D Spend by Modernization Theme (USD): Shows investment distribution across automation, sensing, cybersecurity, and digital substations.
- Innovation Pipeline Progression (Count): Tracks initiatives across concept, pilot, field trial, and deployment stages.
- Grid Modernization Readiness Score: Assesses readiness across observability, automation, interoperability, and operational usage.
- Innovation Contribution Index: Measures how innovation improves grid outcomes such as fault response speed and asset availability.
Frequently Asked Questions
1. Who should use a Power Transmission Grid Modernization & Innovation Dashboard?
Transmission system operators, grid planners, digital transformation teams, and regulatory stakeholders benefit most from this dashboard.
2. How does this dashboard support grid reliability?
It links modernization initiatives directly to reliability improvement metrics, enabling targeted investment decisions.
3. Can this dashboard support regulatory reporting?
Yes. It provides structured insights into innovation spend, readiness, and risk exposure aligned with regulatory programs.