What is a Bioenergy Power Plant Transmission Dashboard?
A Bioenergy Power Plant Transmission Dashboard template is a centralized analytics interface that tracks how electricity generated from bioenergy facilities is exported, transmitted, and delivered to the grid. It focuses on grid interconnection performance, scheduled versus actual power exports, curtailment events, and transmission losses.
By combining operational, compliance, and settlement data, the dashboard wireframe enables utilities and plant operators to monitor grid stability, export reliability, and transmission efficiency. This supports data-driven decisions for improving bioenergy grid performance monitoring and ensures consistent power delivery across interconnection points.
How to Create a Bioenergy Power Plant Transmission Dashboard
You don’t need to build your report from scratch, just start with a ready-to-use Bioenergy Power Plant Transmission dashboard template from Mokkup. Add in your data and export it however you like. Here’s how to do it:
1. Create or Log in to Your Mokkup Account
Start by signing up on Mokkup.ai using your email. If you already have an account, just log in, and you’ll be good to go.
2. Choose and Customize Your Dashboard Template
Find the Bioenergy Power Plant Transmission Dashboard template in the Templates section. Use the drag-and-drop editor to adjust KPIs, edit filters, or add elements based on your data.
3. Export to Your BI Tool
Once your dashboard wireframe is ready, use the BI Tool Export feature to send it directly to Power BI or Tableau for further analysis and enhancements. You can also download the dashboard as a PDF, PNG, or JPEG, embed it on a platform, or invite your team to collaborate.
Note: This is a Pro template. You’ll need a Pro subscription on Mokkup to use and customize this dashboard wireframe. Upgrade anytime to unlock full access.
Bioenergy Power Plant Transmission Dashboard Example
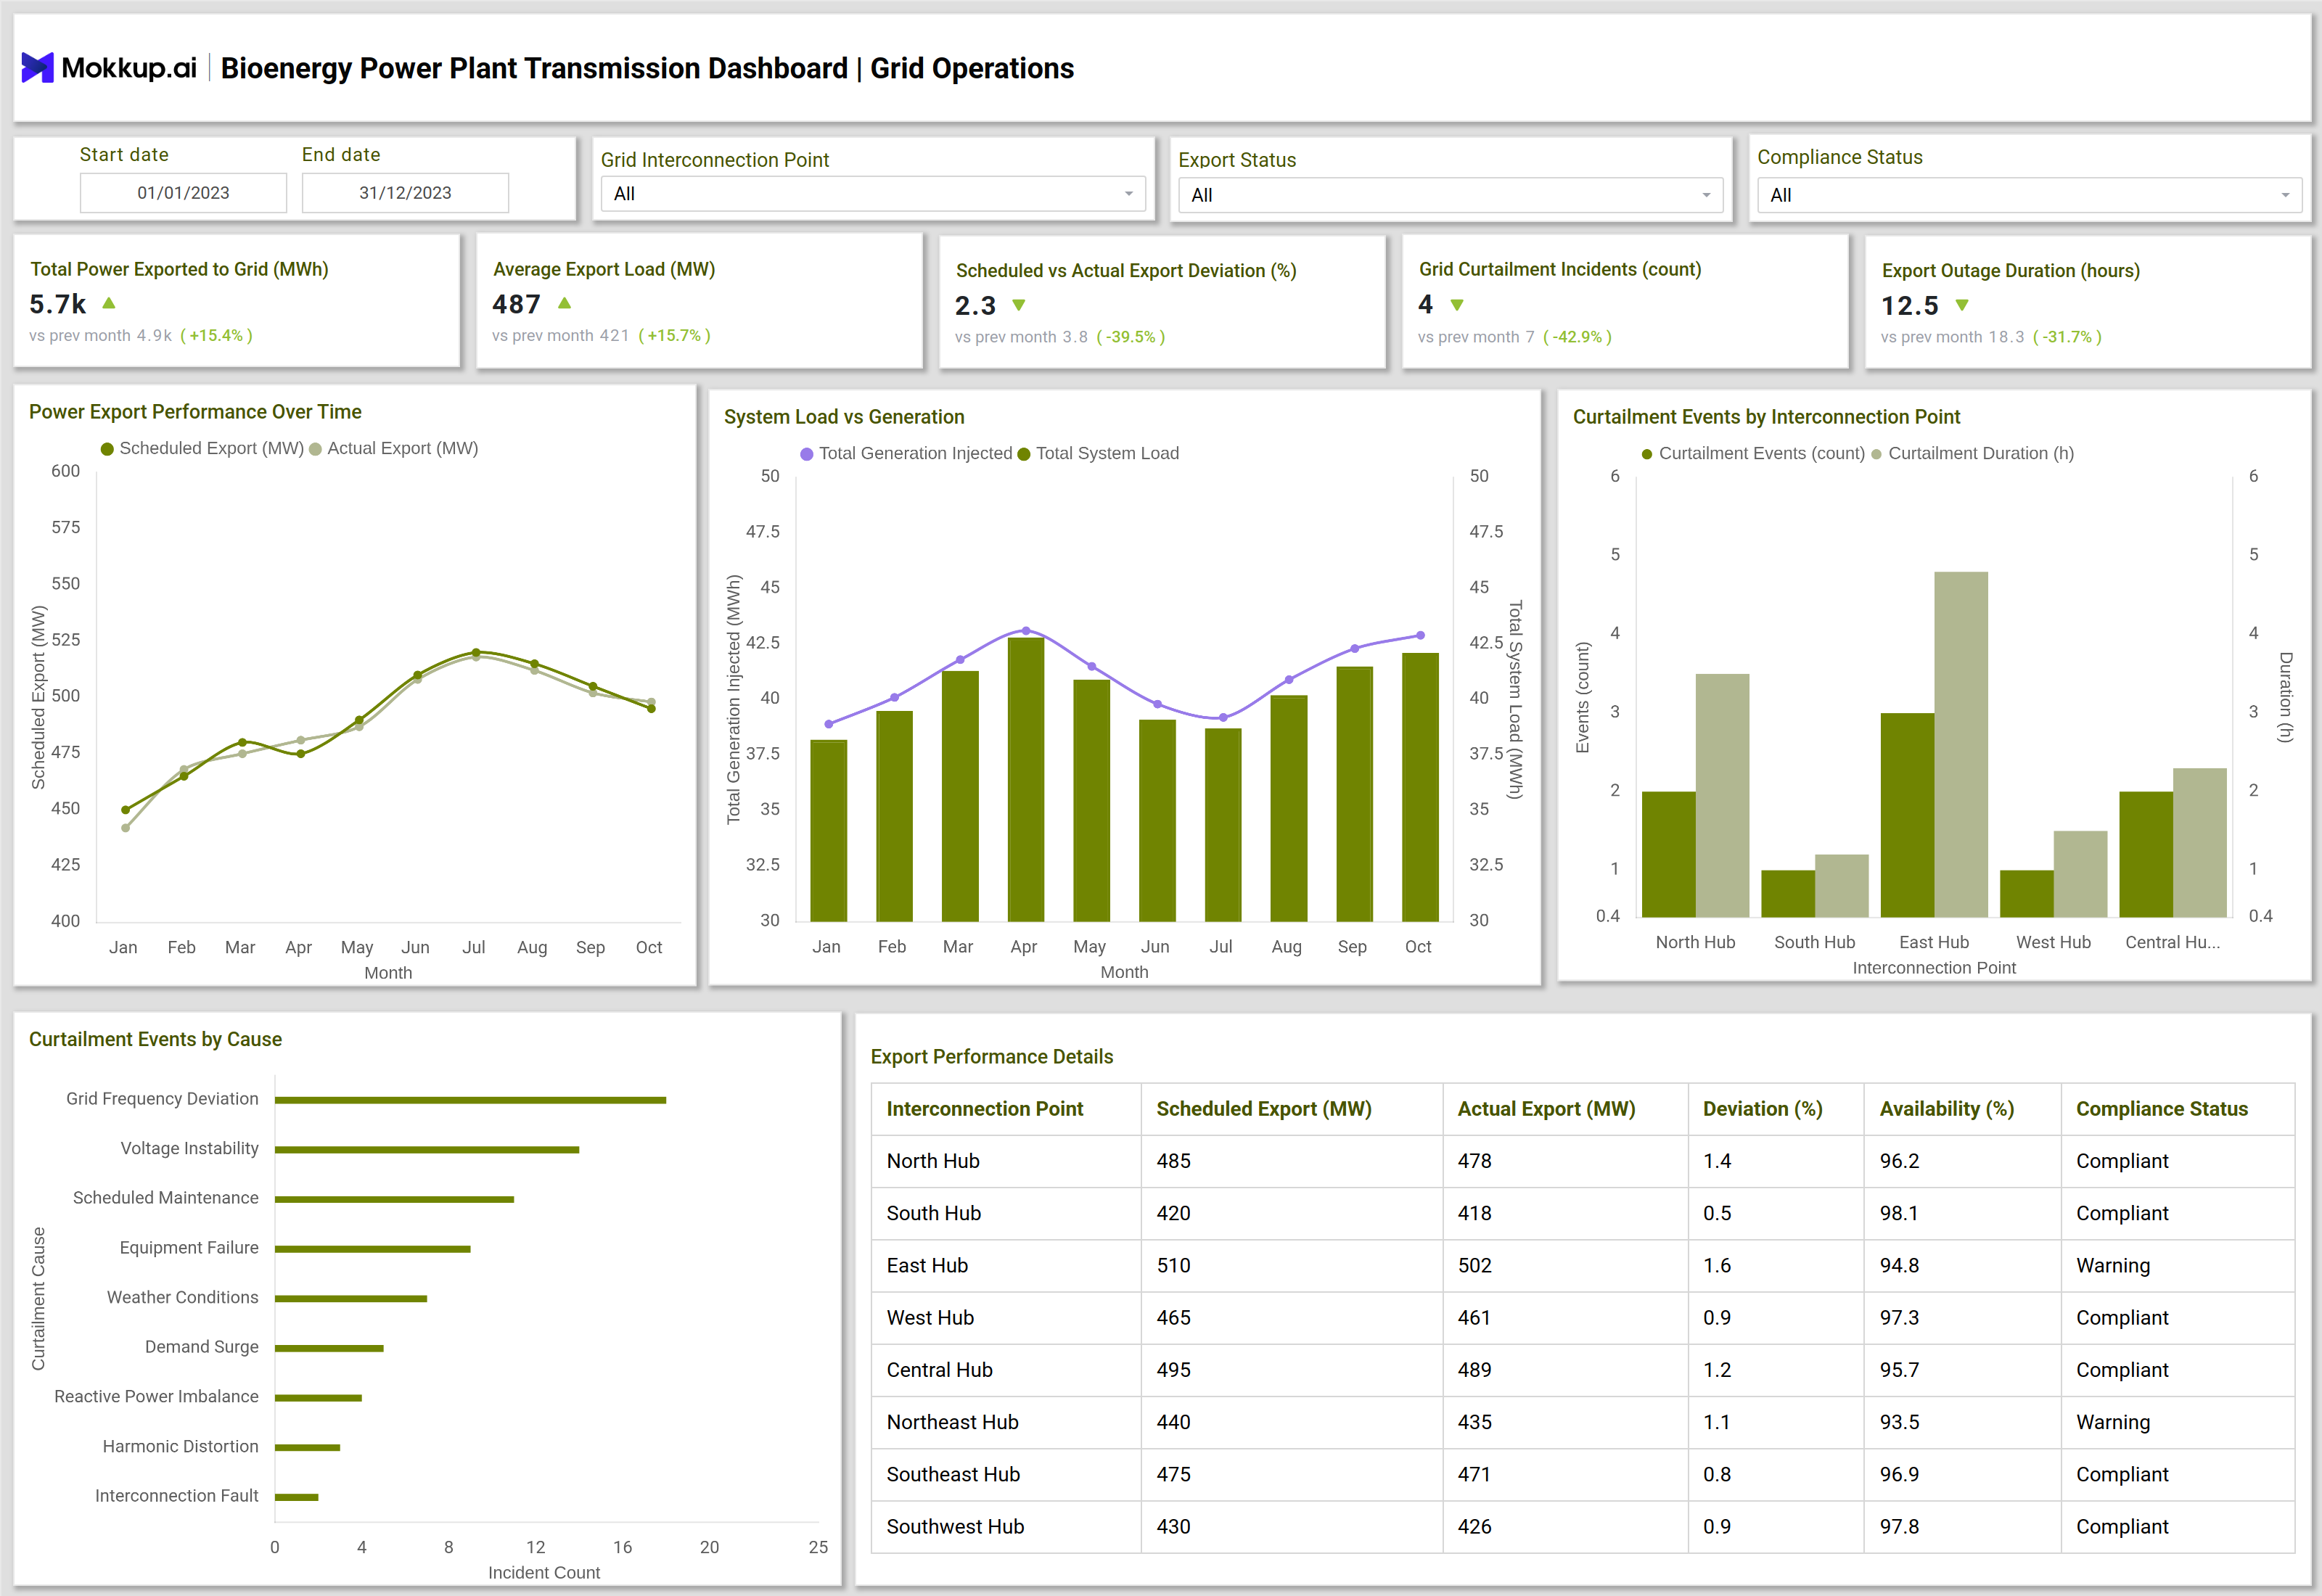
You can build your own Bioenergy Power Plant Transmission Dashboard by combining grid operations and transmission loss modules into a single operational view. A typical dashboard begins with high-level KPIs such as total power exported to the grid, average export load, scheduled versus actual export deviation, grid curtailment incidents, and export outage duration. These metrics provide an immediate snapshot of transmission reliability and export consistency.The grid operations section visualizes monthly export performance, comparing scheduled export against actual export to highlight deviations. System load versus generation charts show how injected power aligns with grid demand, supporting bioenergy power flow monitoring.
Curtailment events are broken down by interconnection point and cause, helping operators identify whether issues stem from grid frequency deviation, voltage instability, maintenance, or equipment faults.The transmission and losses view focuses on wheeling transactions, energy delivered after losses, wheeling loss variance trends, and transmission charges by zone. Detailed tables track transaction-level data, including wheeled energy, settlement status, and accuracy. Together, these views deliver complete bioenergy power distribution analytics and enable efficient coordination between plant operators, grid operators, and utilities.
How to Analyze Bioenergy Power Plant Transmission Dashboard
Here is how you can analyze data from this dashboard:
- Export Performance Review: Review total exported energy and average export load to assess overall grid contribution.
- Schedule vs Actual Analysis: Compare scheduled versus actual export trends to identify recurring deviations.
- Curtailment Hotspot Identification: Analyze curtailment events by interconnection point to locate grid bottlenecks.
- Demand Alignment Check: Track system load versus generation to evaluate export alignment with grid demand.
- Transmission Loss Monitoring: Monitor wheeling loss percentage and loss variance to detect transmission inefficiencies.
- Cost Driver Assessment: Review transmission charges by zone to understand key cost contributors.
- Settlement Validation: Use settlement accuracy and dispute status to validate billing correctness and regulatory compliance.
Benefits of Bioenergy Power Plant Transmission Dashboard
The following are the benefits of using this dashboard:
- Enhanced Transmission Visibility: Improves visibility into bioenergy plant transmission performance across grid points.
- Revenue Protection: Reduces revenue loss by identifying export deviations and curtailment root causes early.
- Improved Grid Coordination: Enhances coordination with grid operators through accurate export and load alignment data.
- Regulatory Compliance Support: Supports compliance with grid codes and transmission agreements.
- Optimized Transmission Efficiency: Optimizes transmission efficiency through continuous loss and variance tracking.
- Financial Accuracy: Strengthens financial accuracy with validated settlements and billing insights.
- Proactive Asset Planning: Enables proactive maintenance and planning for interconnection assets.
KPIs to Track in Bioenergy Power Plant Transmission Dashboard
The following key KPIs can be tracked by using this dashboard:
- Total Power Exported (MWh): Measures total electricity delivered from the bioenergy plant to the grid
- Average Export Load (MW): Indicates typical export capacity utilization
- Scheduled vs Actual Export Deviation (%): Tracks export accuracy against grid schedules
- Grid Curtailment Incidents: Counts forced reductions in exported power
- Export Outage Duration (hours): Measures downtime affecting grid exports
- Wheeling Loss (%): Quantifies transmission losses during energy delivery
- Energy Delivered After Losses (MWh): Confirms net power received by consumers
- Transmission Charges ($): Tracks costs incurred across transmission zones
- Settlement Accuracy (%): Ensures correctness of transmission billing and settlements
Frequently Asked Questions
Q1. What is the main purpose of a bioenergy power transmission dashboard?
It provides historical insights into power exports, transmission efficiency, curtailments, and losses to ensure reliable grid integration.
Q2. How does this dashboard support bioenergy grid performance monitoring?
It aligns generation, export schedules, and grid demand while highlighting deviations, losses, and compliance risks.
Q3. Can the dashboard help reduce transmission losses?
Yes. By tracking wheeling loss trends and variance, operators can identify inefficiencies and take corrective actions.
Q4. Is the dashboard useful for regulatory and financial reporting?
Absolutely. Settlement accuracy, transmission charges, and compliance metrics support audits, billing validation, and regulatory submissions.
Q5. Who typically uses a bioenergy power plant transmission dashboard?
Grid operators, bioenergy plant managers, utility companies, and energy trading teams use it to manage exports and optimize transmission performance.