What is a Power Transmission Enterprise Strategy & Performance Dashboard?
A Power Transmission Enterprise Strategy & Performance Dashboard is an executive analytics solution designed for transmission system operators (TSOs) and grid utilities to monitor enterprise-level performance, strategic execution, and risk exposure. It consolidates financial, operational, asset, and strategic KPIs into a single view to support long-term planning and regulatory accountability. This dashboard acts as a power transmission enterprise strategy dashboard by aligning regulated revenue, operating efficiency, network availability, capital deployment, and strategic outcomes. It enables leadership teams to evaluate how well enterprise goals translate into measurable grid performance. By combining business performance, asset age profiles, flexibility metrics, and enterprise risk indicators, it functions as a transmission utility executive performance dashboard that supports informed, data-driven decision-making across regions and voltage classes.
How to Create a Power Transmission Enterprise Strategy & Performance Dashboard
You don’t need to build your report from scratch, just start with a ready-to-use dashboard template from Mokkup. Add in your data and export it however you like. Here’s how to do it:
1. Create or Log in to Your Mokkup Account
Start by signing up on Mokkup.ai using your email. If you already have an account, just log in, and you’ll be good to go.
2. Choose and Customize Your Dashboard Template
Find the Power Transmission Enterprise Strategy & Performance Dashboard template in the Templates section. Use the drag-and-drop editor to adjust KPIs, edit filters, or add elements based on your data.
3. Export to Your BI Tool
Once your dashboard wireframe is ready, use the BI Tool Export feature to send it directly to Power BI or Tableau for further analysis and enhancements. You can also download the dashboard as a PDF, PNG, or JPEG, embed it on a platform, or invite your team to collaborate.
Note: This is a Pro template. You’ll need a Pro subscription on Mokkup to use and customize this dashboard wireframe. Upgrade anytime to unlock full access.
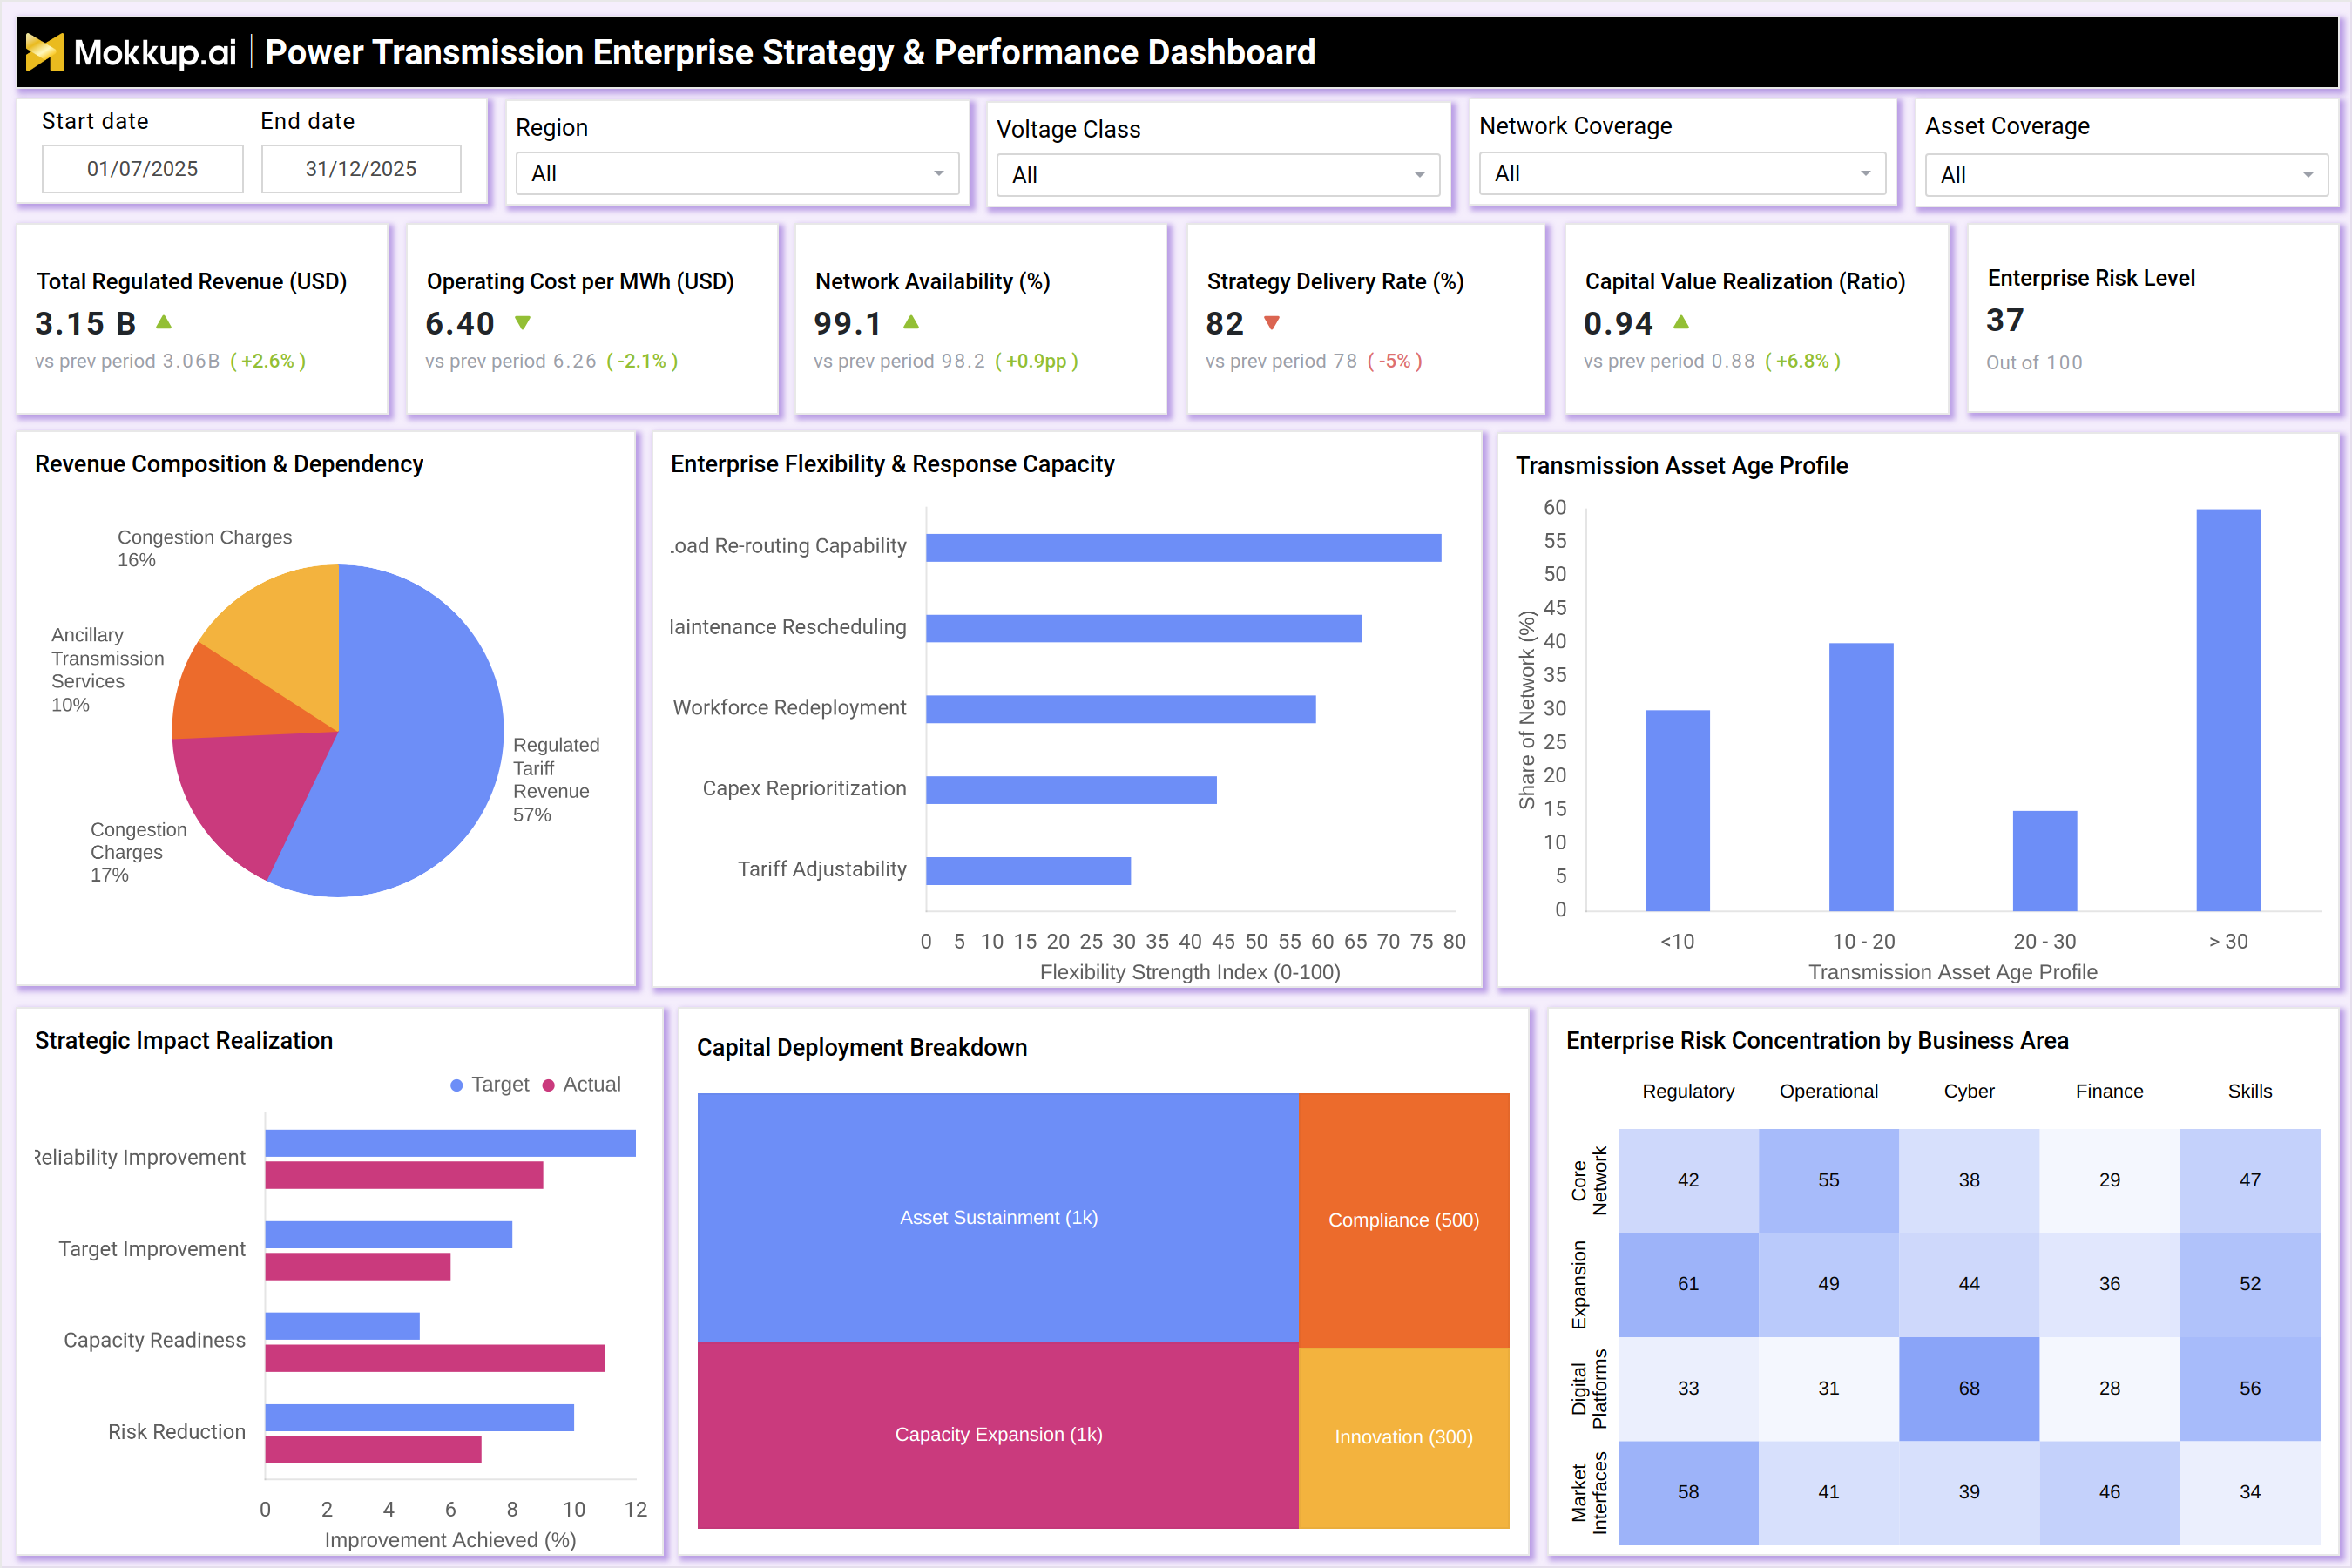
Power Transmission Enterprise Strategy & Performance Dashboard Example
A typical Power Transmission Enterprise Strategy & Performance Dashboard presents enterprise KPIs such as total regulated revenue, operating cost per MWh, network availability, strategy delivery rate, capital value realization, and enterprise risk level. These indicators provide an immediate snapshot of business health and strategic progress. Visuals such as revenue composition highlight dependency on regulated tariffs, congestion charges, and ancillary services. Asset age profiles reveal long-term infrastructure risk, while capital deployment breakdowns show investment allocation across asset sustainment, capacity expansion, compliance, and innovation. Enterprise flexibility metrics measure the organization’s ability to reroute loads, reschedule maintenance, redeploy workforce, and reprioritize capex. Risk concentration heatmaps provide visibility into regulatory, operational, cyber, financial, and skills-related exposure across business areas.
How to Analyze Data in Power Transmission Enterprise Strategy & Performance Dashboard
Here is how you can analyze data from this Transmission grid innovation analytics platform:
- Start by reviewing total regulated revenue and operating cost per MWh to assess financial efficiency.
- Analyze network availability trends to confirm system reliability across regions and voltage classes.
- Compare strategy delivery rate against capital value realization to identify execution gaps.
- Review asset age distribution to understand long-term replacement and modernization pressure.
- Examine enterprise flexibility scores to evaluate response capability during grid stress events.
- Use strategic impact realization metrics to measure improvement in reliability, capacity readiness, and risk reduction.
- Analyze capital deployment allocation to confirm alignment with enterprise priorities.
- Monitor enterprise risk concentration heatmaps to identify high-exposure business areas.
- Track trends over time to validate whether strategic initiatives deliver sustained outcomes.
Benefits of Power Transmission Enterprise Strategy & Performance Dashboard
The following are the benefits of using this dashboard:
- Provides a unified enterprise view of financial, operational, and strategic performance.
- Improves executive visibility into network reliability and asset lifecycle risk.
- Enables better alignment between capital investment and strategic outcomes.
- Supports regulatory reporting with structured, traceable performance metrics.
- Enhances enterprise risk awareness across operational, cyber, and financial domains.
- Improves strategic decision-making for long-term grid planning.
- Helps TSOs balance reliability, cost efficiency, and growth objectives.
- Strengthens accountability for enterprise-level strategy execution.
KPIs to Track in Power Transmission Enterprise Strategy & Performance Dashboard
The following key KPIs can be tracked by using this Smart transmission grid modernization dashboard:
- Total Regulated Revenue: Measures revenue earned under regulated tariff structures.
- Operating Cost per MWh: Tracks cost efficiency of transmission operations.
- Network Availability: Measures uptime and reliability of the transmission network.
- Strategy Delivery Rate: Indicates execution progress of enterprise strategic initiatives.
- Capital Value Realization: Assesses effectiveness of capital investment outcomes.
- Enterprise Risk Level: Aggregates overall enterprise risk exposure.
- Revenue Composition: Tracks dependency across regulated tariffs, congestion, and services.
- Transmission Asset Age Profile: Shows infrastructure aging and renewal risk.
- Enterprise Flexibility Index: Measures response capability during operational disruptions.
- Strategic Impact Realization: Tracks realized improvements versus strategic targets.
- Capital Deployment Allocation: Monitors investment split across sustainment, expansion, compliance, and innovation.
- Enterprise Risk Concentration: Identifies risk exposure by regulatory, cyber, operational, and financial domains.
Frequently Asked Questions
1. Who should use a Power Transmission Enterprise Strategy & Performance Dashboard?
This dashboard is designed for TSOs, transmission utilities, executive leadership, strategy teams, and regulatory stakeholders.
2. How does this dashboard support strategic planning?
It links enterprise KPIs with capital deployment, asset aging, and risk exposure to support long-term decision-making.
3. Can this dashboard support regulatory reporting?
Yes. It provides structured visibility into regulated revenue, compliance investment, and reliability performance.