What is a Power Distribution Short-Term Procurement & Trading Performance Dashboard?
A Power Distribution Short-Term Procurement & Trading Performance Dashboard is an analytics tool designed for distribution utilities (DISCOMs) to monitor how effectively short-term electricity demand is procured and managed across spot markets and short-duration contracts. It combines procurement cost performance, market exposure, schedule deviation risk, and imbalance settlement costs into one operational view. This dashboard works as a power distribution procurement trading dashboard by tracking procurement volumes, price efficiency, and cost-saving outcomes across short-term procurement channels. It is used by power procurement teams to understand where purchases are planned vs reactive, how market timing impacts price outcomes, and how forecast accuracy influences deviation volumes and penalties.
For DISCOMs facing demand variability and supply uncertainty, this platform supports short-term power procurement analytics and enables proactive trading decisions. It also acts as an electricity distribution trading performance dashboard by analyzing price performance by market type and showing exposure risk by region or distribution zone. Overall, it helps utilities improve procurement discipline, reduce cost volatility, and strengthen grid supply reliability.
How to Create a Power Distribution Short-Term Procurement & Trading Performance Dashboard
You don’t need to build your report from scratch, just start with a ready-to-use dashboard template from Mokkup. Add in your data and export it however you like. Here’s how to do it:
1. Create or Log in to Your Mokkup Account
Start by signing up on Mokkup.ai using your email. If you already have an account, just log in, and you’ll be good to go.
2. Choose and Customize Your Dashboard Template
Find the Power Distribution Short-Term Procurement & Trading Performance Dashboard template in the Templates section. Use the drag-and-drop editor to adjust KPIs, edit filters, or add elements based on your data.
3. Export to Your BI Tool
Once your dashboard wireframe is ready, use the BI Tool Export feature to send it directly to Power BI or Tableau for further analysis and enhancements. You can also download the dashboard as a PDF, PNG, or JPEG, embed it on a platform, or invite your team to collaborate.
Note: This is a Pro template. You’ll need a Pro subscription on Mokkup to use and customize this dashboard wireframe. Upgrade anytime to unlock full access.
Power Distribution Short-Term Procurement & Trading Performance Dashboard Example
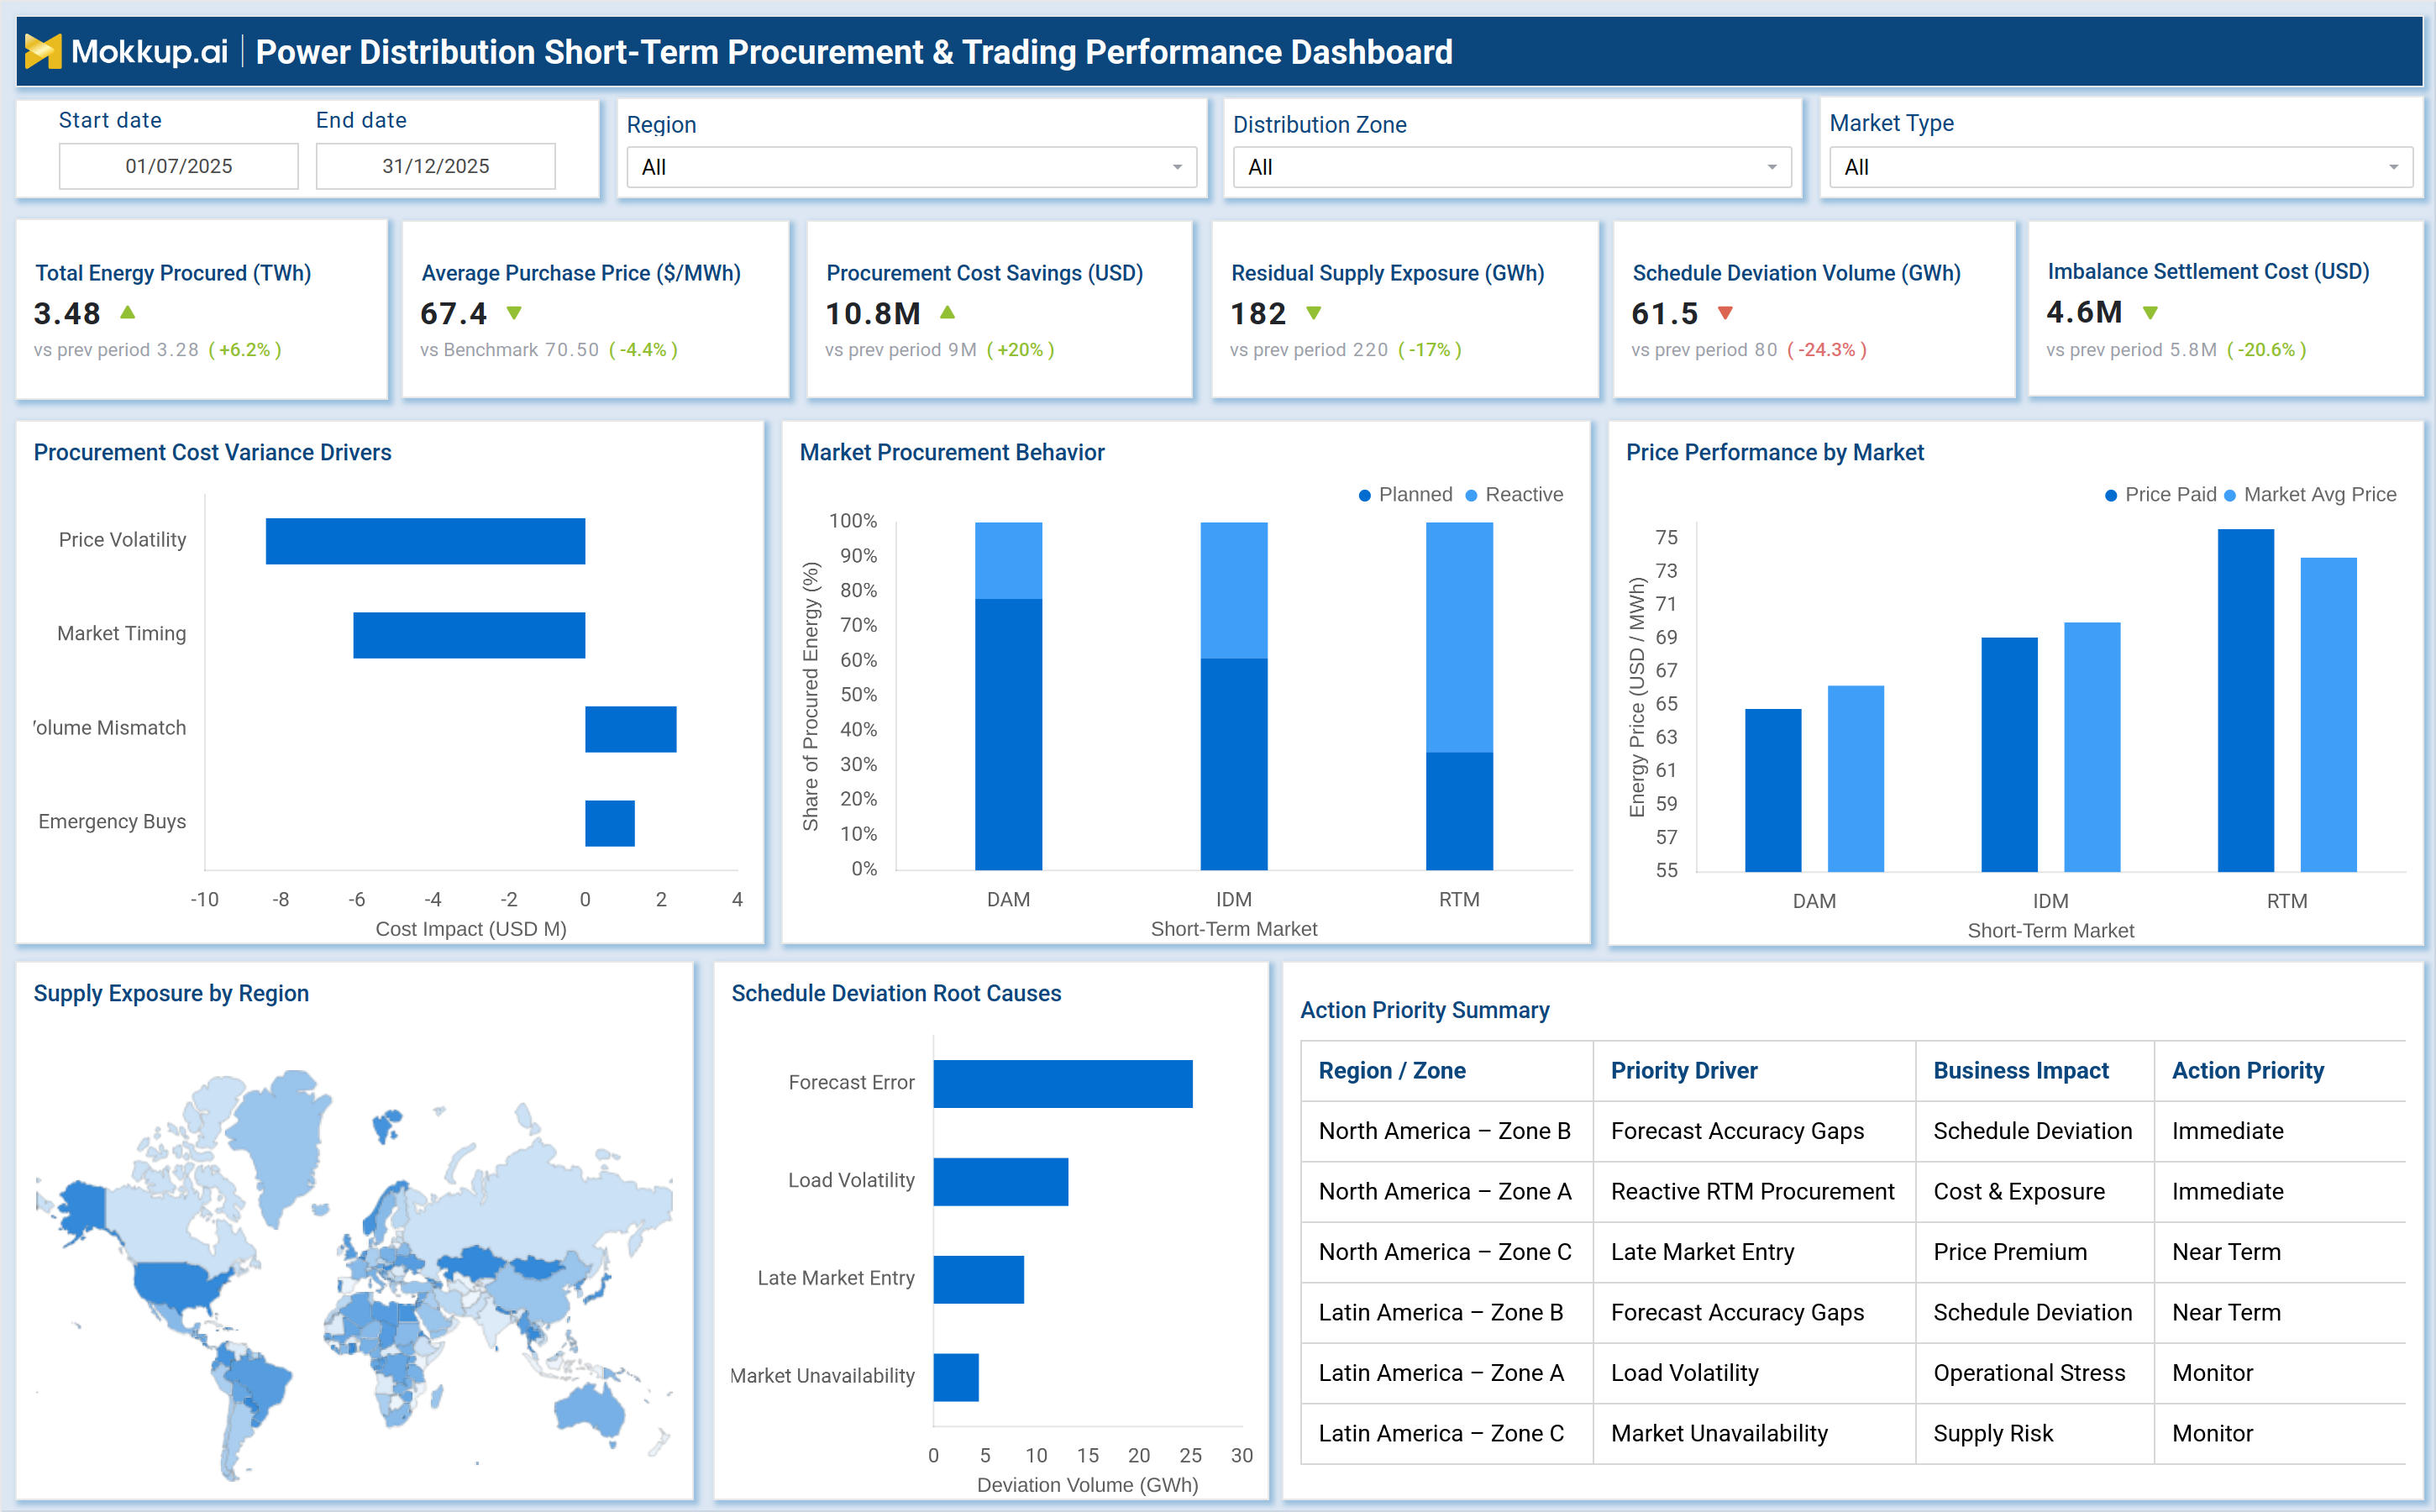
This dashboard presents a consolidated view of short-term power procurement performance for DISCOMs by tracking energy procured, purchase price, cost savings, supply exposure, schedule deviations, and imbalance settlement cost. It helps procurement and trading teams quickly evaluate whether purchases are planned or reactive and how market choices affect total cost. Visuals like procurement cost variance drivers explain what is increasing cost (price volatility, market timing, emergency buys) is and what is reducing cost (volume matching). Market procurement behavior shows planned vs reactive procurement split across DAM, IDM, and RTM. Price performance by market compares the DISCOM’s price paid against the market average to highlight premiums or efficiency. Supply exposure mapping and deviation root cause analysis identify high-risk regions and key drivers such as forecast error or late market entry, while the action priority table converts these insights into zone-level corrective actions.
How to Analyze Data in Power Distribution Short-Term Procurement & Trading Performance Dashboard
Here is how you can analyze data from this power purchase cost optimization dashboard:
- Total Energy Procured (TWh): Track the total volume of energy procured during the reporting period to understand the overall procurement scale and demand coverage.
- Average Purchase Price ($/MWh): Compare the average procurement price against market benchmarks to assess pricing efficiency and identify over- or under-performance.
- Procurement Cost Savings (USD): Review realized cost savings to validate the financial impact of improved market timing, sourcing strategy, and planned procurement.
- Residual Supply Exposure (GWh): Monitor uncovered demand to highlight supply gaps that may increase risk, volatility, or reliance on emergency market purchases.
- Schedule Deviation Volume (GWh): Evaluate deviations between scheduled and actual power to assess forecast accuracy and dispatch discipline.
- Imbalance Settlement Cost (USD): Quantify the financial impact of deviations by tracking penalties and imbalance settlement charges.
- Procurement Cost Variance Drivers: Identify key factors contributing to price premiums or savings, such as demand forecast errors, market selection, or timing issues.
- Market Procurement Behavior: Analyze the balance between planned and reactive procurement across DAM, IDM, and RTM to ensure strategic market participation.
- Price Performance by Market: Compare procurement prices across markets to detect areas where purchases consistently exceed market averages.
- Supply Exposure by Region: Review regional exposure to pinpoint zones that require tighter procurement planning or alternative sourcing strategies.
- Schedule Deviation Root Causes: Distinguish between controllable deviations (forecasting, scheduling) and external factors (market constraints, outages).
- Action Priority Summary: Use the summary table to identify high-impact zones and prioritize immediate corrective actions.
Benefits of Power Distribution Short-Term Procurement & Trading Performance Dashboard
The following are the benefits of using this dashboard:
- Improved Cost & Market Visibility: Enhances transparency into short-term power procurement cost drivers and real-time market exposure.
- Stronger Financial Governance: Reinforces procurement oversight by enabling structured cost optimization through a centralized power purchase dashboard.
- Reduced Deviation Penalties: Minimizes imbalance and deviation charges by detecting forecast and scheduling gaps at an early stage.
- Shift to Planned Procurement Discipline: This helps DISCOMs transition from reactive market buying to more predictable and planned procurement strategies.
- Cross-Market Procurement Efficiency Tracking: Measures performance across DAM, IDM, and RTM markets to support continuous trading and sourcing improvements.
- Regional Risk Monitoring: Identifies zones with high residual supply exposure to proactively manage regional procurement risks.
- Market Price Benchmarking: Enables comparison against market averages to identify and reduce persistent price premiums.
- Clear Operational Action Prioritization: Provides actionable insights and prioritized recommendations for procurement and dispatch teams to act quickly.
KPIs to Track in Power Distribution Short-Term Procurement & Trading Performance Dashboard
The following key KPIs can be tracked by using this dashboard:
- Total Energy Procured (TWh): Measures total short-term electricity procured across markets during the period.
- Average Purchase Price ($/MWh): Tracks weighted average purchase price for procured energy.
- Procurement Cost Savings (USD): Measures savings achieved vs benchmark or reference procurement cost.
- Residual Supply Exposure (GWh): Measures uncovered load exposure that may require urgent short-term procurement.
- Schedule Deviation Volume (GWh): Tracks total deviation volume from scheduled power draw or supply plans.
- Imbalance Settlement Cost (USD): Measures cost incurred due to DSM/imbalance settlement and deviation penalties.
- Planned vs Reactive Procurement Share: Tracks procurement quality by measuring planned procurement dominance.
- Market Price Premium/Discount ($/MWh): Measures the difference between the price paid and the market average per market type.
- Procurement Cost Variance Impact (USD): Quantifies cost impact by driver, such as volatility or timing issues.
- Supply Exposure by Region (GWh): Tracks where supply gaps are concentrated geographically or by zone.
- Deviation Root Cause Contribution: Measures the deviation share caused by forecast error, load volatility, or late entry.
- Action Priority Count (Immediate/Near Term/Monitor): Tracks total zones requiring action by urgency classification.
Frequently Asked Questions
1. What is the main purpose of a short-term procurement dashboard for DISCOMs?
It helps DISCOMs control costs, reduce market exposure risk, and monitor deviation settlement impacts.
2. Which teams use this dashboard?
Power procurement teams, trading desks, scheduling/dispatch teams, finance controllers, and leadership.
3. How does it help reduce power purchase cost?
By identifying price premium drivers, increasing planned procurement share, and improving market timing discipline.