What is a Pathology Labs Preventive Health Screening Dashboard?
A Pathology Labs Preventive Health Screening Dashboard is a centralized tool designed for lab managers and public health coordinators to monitor the performance and impact of preventive health programs. It provides clear visibility into screening volumes, participant engagement, operational efficiency, and population health trends. Unlike scattered reports, this dashboard acts as a consolidated pathology labs preventive health screening dashboard, helping institutions track participation growth, identify health risks, and assess the efficiency of their screening services in one place.
How to Create a Pathology Labs Preventive Health Screening Dashboard
You don’t need to build your report from scratch—just start with a ready-to-use Pathology labs preventive health screening dashboard template from Mokkup. Add in your data and export it however you like. Here’s how to do it:
1. Create or Log in to Your Mokkup Account
Start by signing up on Mokkup.ai using your email. If you already have an account, just log in, and you’ll be good to go.
2. Choose and Customize Your Dashboard Template
Find the Pathology Labs Preventive Health Screening Dashboard template in the Templates section. Use the drag-and-drop editor to adjust KPIs, edit filters, or add elements based on your data.
3. Export to Your BI Tool
Once your dashboard wireframe is ready, use the BI Tool Export feature to send it directly to Power BI or Tableau for further analysis and enhancements. You can also download the dashboard as a PDF, PNG, or JPEG, embed it on a platform, or invite your team to collaborate.
Note: This is a Pro template. You’ll need a Pro subscription on Mokkup to use and customize this dashboard wireframe. Upgrade anytime to unlock full access.
Pathology Labs Preventive Health Screening Dashboard Example
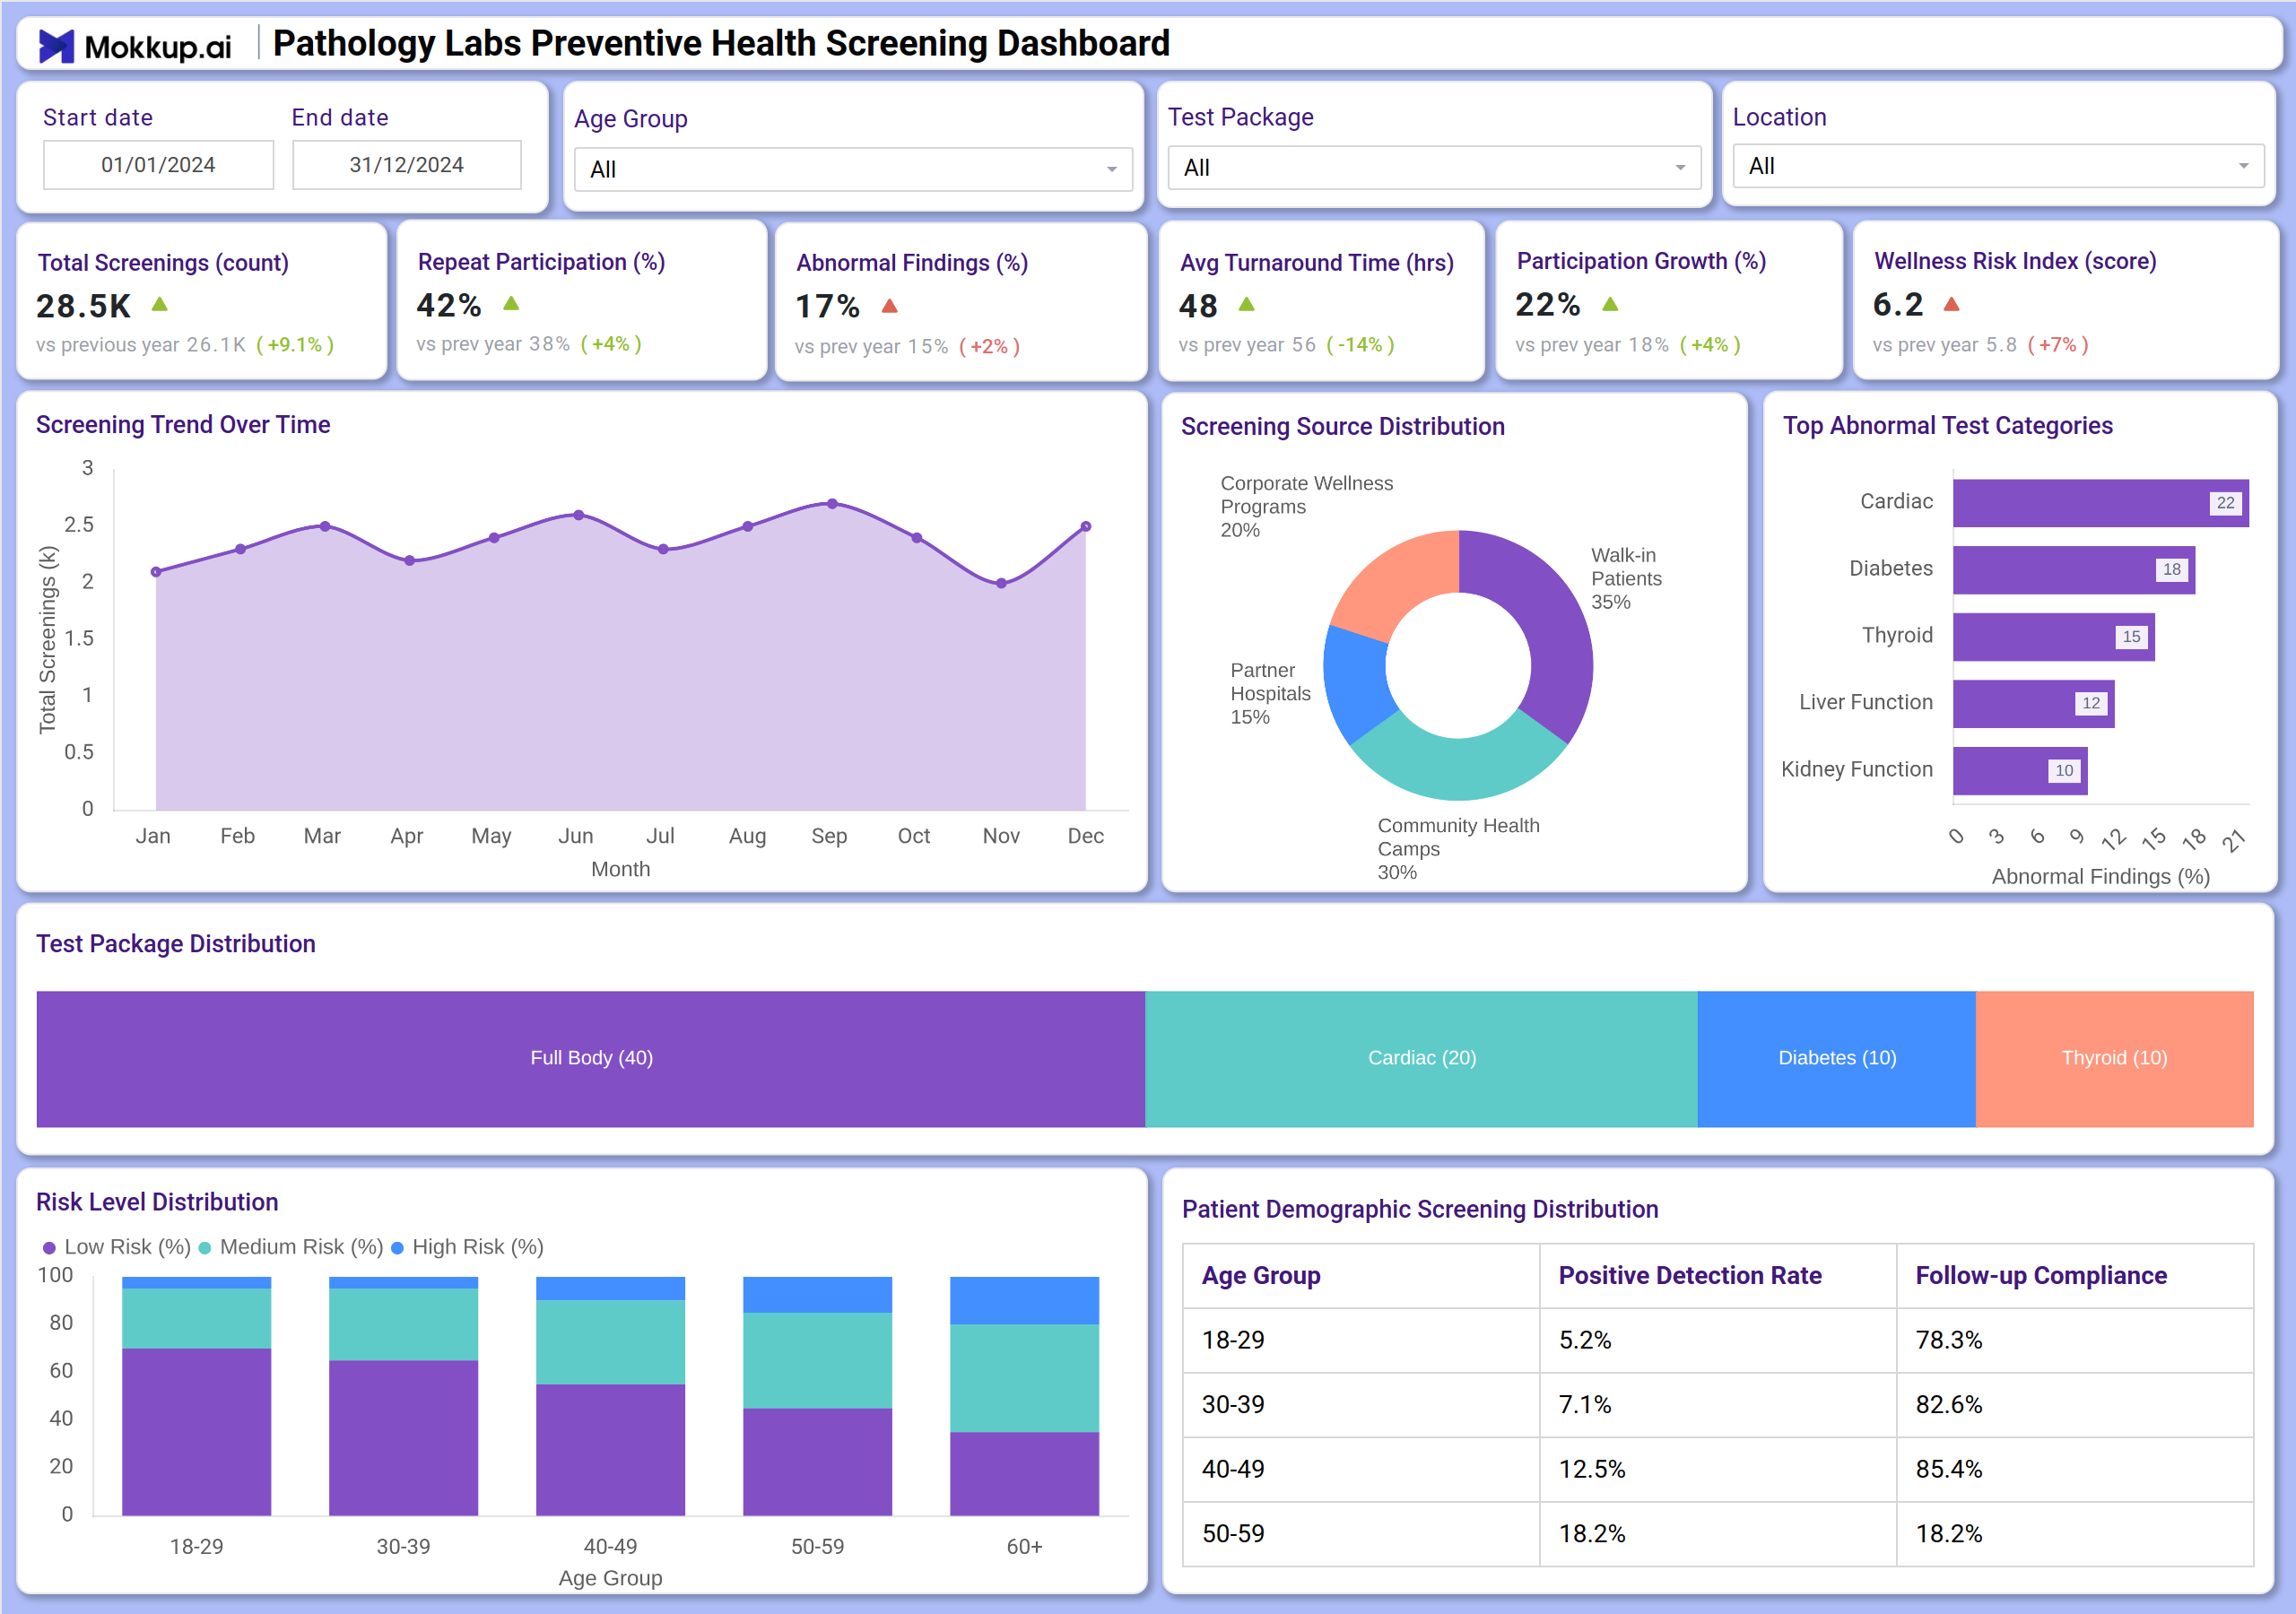
You can create a Pathology Labs Preventive Health Screening Dashboard that combines KPI tiles and visualizations. At the top, KPI cards track key metrics, including total screenings, repeat participation, abnormal findings, and average turnaround time. Below that, charts show trends in screening volume over time, the distribution of the abnormal conclusions by test package, and the demographic breakdown of participants. A geographical map can display location performance, while a funnel chart visualizes participant retention. Together, this dashboard serves as a comprehensive tool for tracking pathology lab screening metrics, ensuring managers have a clear view of program health and effectiveness.
How to Analyze Data in Pathology Labs Preventive Health Screening Dashboards
Here’s how labs and public health programs can make the most of the data available on the Pathology labs' preventive health screening dashboard:
- Track program engagement: Use line charts to monitor screening trends over time and gauge program growth.
- Monitor participant loyalty: Analyze the repeat participation rate to understand patient retention and program satisfaction.
- Assess population health risk: Review the percentage of abnormal findings and the wellness risk index to identify common health issues.
- Evaluate operational efficiency: Compare the average turnaround time against internal targets to ensure timely delivery of results.
- Understand participant demographics: Use pie and bar charts to see the age and gender distribution of your screened population.
- Measure location performance: Check the geographical map to identify high-performing branches or regions with high screening volumes.
Benefits of Pathology Labs Preventive Health Screening Dashboards
Here are the benefits of using this dashboard for tracking pathology lab screening metrics:
- Improved Program Visibility: Clear KPIs across screening volume, participant behavior, and health outcomes.
- Enhanced Participant Retention: Tracks repeat participation to help design loyalty programs and improve engagement.
- Informed Public Health Planning: Abnormal finding trends and wellness risk scores help in allocating resources and designing targeted health campaigns.
- Operational Efficiency: Monitoring average turnaround time ensures labs meet service level expectations and improve workflow.
- Data-Driven Strategy: Provides evidence for expanding popular test packages or launching initiatives in underperforming regions.
- Compliance & Reporting: Works as a preventive health screening, reporting, and compliance dashboard for audits and stakeholder reviews.
Together, these elements provide leadership with a clear picture of program performance and the impact on population health. That’s why many healthcare leaders consider it the best preventive health screening dashboard for pathology labs, aiming to improve public health outcomes and operational excellence.
KPIs to Track in Pathology Labs Preventive Health Screening Dashboards
- Total Screenings (count): The total number of screening tests conducted, indicating program reach and volume.
- Repeat Participation (%): The percentage of participants who have undergone screening more than once, measuring loyalty and program effectiveness.
- Abnormal Findings (%): The percentage of screenings with an abnormal result, highlighting potential population health risks.
- Avg Turnaround Time (hrs): The average time from sample collection to result delivery, tracking operational efficiency.
- Participation Growth (%): The year-over-year growth in the number of participants, showing program expansion and market reach.
- Wellness Risk Index (score): A composite score indicating the average health risk level of the screened population.
Frequently Asked Questions
1. Who should use a Pathology Labs Preventive Health Screening Dashboard?
Lab Managers, Public Health Program Coordinators, and Healthcare Administrators are responsible for managing and scaling preventive health initiatives.
2. Can this dashboard help improve public health outcomes?
Yes. By identifying trends in abnormal findings and population health risks, organizations can launch targeted awareness and early intervention campaigns.
3. How does it support operational decisions for a pathology lab?
It connects screening volumes with turnaround times, helping managers optimize staff scheduling, resource allocation, and workflow processes.
4. Is this dashboard useful for compliance?
Yes, because a pathology lab screening workflow and outcome analytics dashboard support governance, detailed reporting, and compliance audits for public health programs.